23.2 Tissue-Specific Metabolism
Each tissue of the human body has a specialized function, reflected in its anatomy and metabolic activity (Fig. 23-9). Skeletal muscle allows directed motion; adipose tissue stores and distributes energy in the form of fats, which serve as fuel throughout the body and as thermal insulation; in the brain, cells pump ions across their plasma membranes to produce electrical signals. The liver plays a central processing and distribution role in metabolism and furnishes all other organs and tissues with an appropriate mix of nutrients via the bloodstream. The functional centrality of the liver is indicated by the common reference to all other tissues and organs as “extrahepatic.” We therefore begin our discussion of the division of metabolic labor by considering the transformations of carbohydrates, amino acids, and fats in the mammalian liver. This is followed by brief descriptions of the primary metabolic functions of adipose tissue, muscle, brain, and the tissue that interconnects all others: the blood.
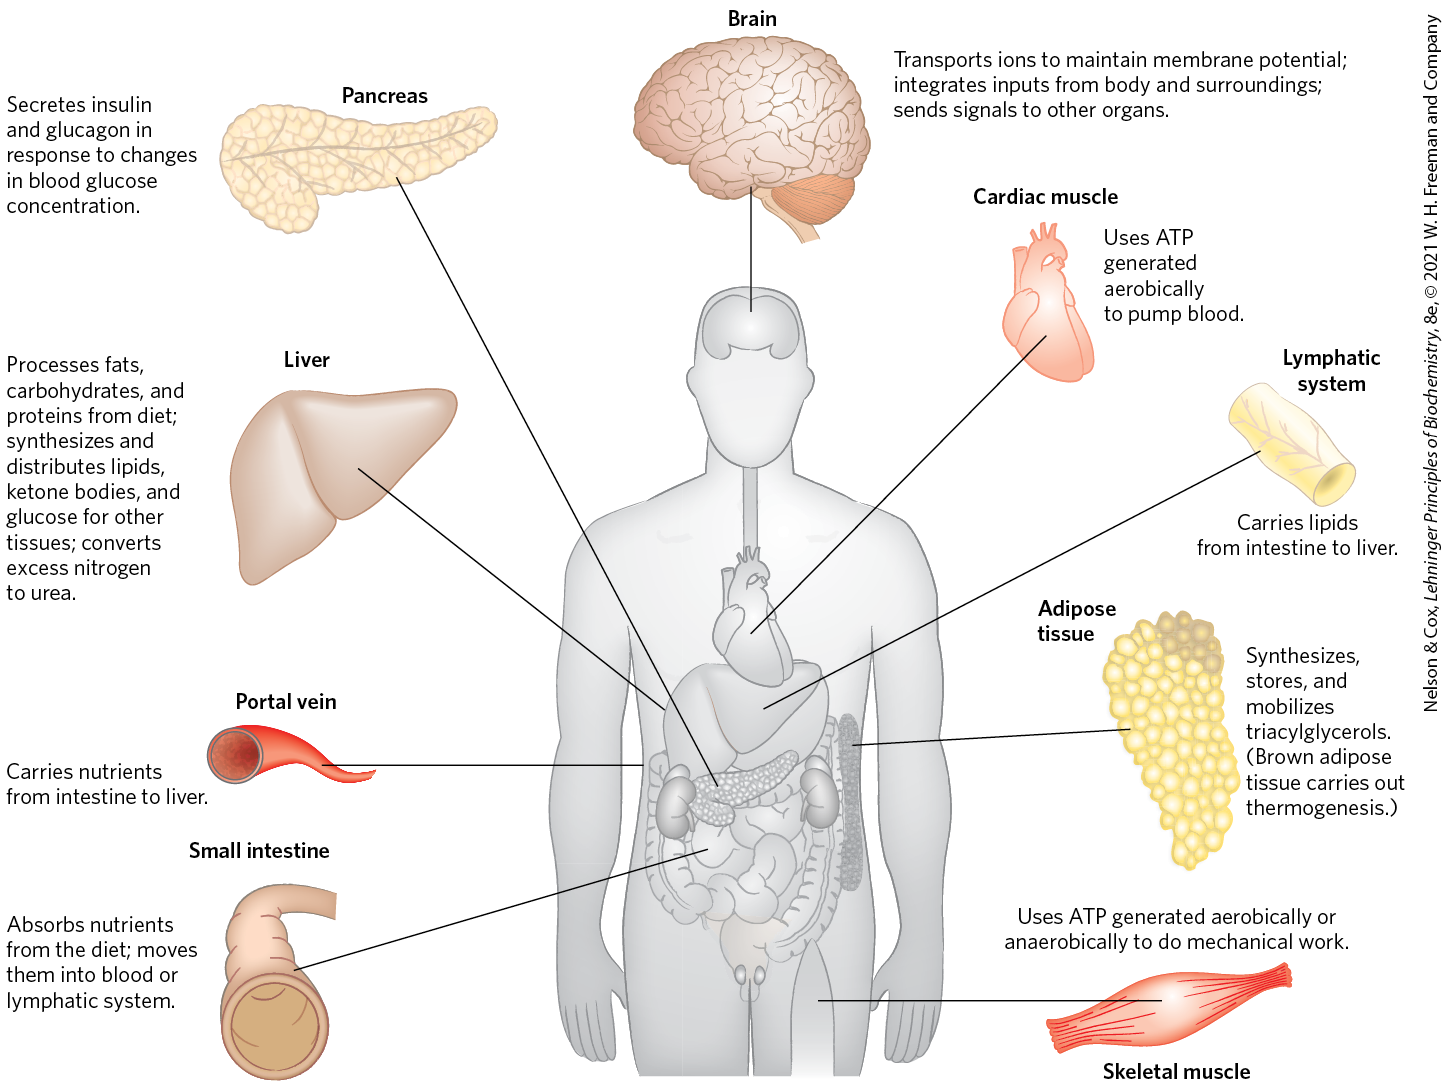
FIGURE 23-9 Specialized metabolic functions of mammalian tissues.
The Liver Processes and Distributes Nutrients
During digestion in mammals, the three main classes of nutrients (carbohydrates, fats, and proteins) undergo enzymatic hydrolysis into their simple constituents (monosaccharides, fatty acids, and amino acids). This breakdown is necessary because the epithelial cells lining the intestinal lumen absorb only relatively small molecules. Many of the fatty acids and monoacylglycerols released by digestion of fats in the intestine are reassembled within these epithelial cells into triacylglycerols (TAGs).
After being absorbed, most sugars and amino acids and some reconstituted TAGs pass from intestinal epithelial cells into blood capillaries and travel in the bloodstream to the liver; the remaining TAGs enter adipose tissue via the lymphatic system. The portal vein (Fig. 23-9) is a direct route from the digestive organs to the liver, and the liver therefore has first access to ingested nutrients. The liver has two main cell types. Kupffer cells are phagocytes, important in immune function. Hepatocytes, of primary interest here, transform dietary nutrients into the fuels and precursors required by other tissues and export them via the blood. The kinds and amounts of nutrients supplied to the liver are determined by the composition of the diet, the interval between meals, and several other factors. The demand of extrahepatic tissues for fuels and precursors varies from one organ to another, and it also varies with the level of activity and overall nutritional state of the individual.
To meet these changing circumstances, the liver has remarkable metabolic flexibility. For example, when the diet is rich in protein, hepatocytes synthesize more of the enzymes needed for amino acid catabolism and gluconeogenesis. Within hours after a shift to a high-carbohydrate diet, the levels of these enzymes begin to drop and the hepatocytes increase their synthesis of enzymes essential to carbohydrate metabolism and fat synthesis. Liver enzymes turn over (that is, are synthesized and degraded) at 5 to 10 times the rate of enzyme turnover in other tissues, such as muscle. Extrahepatic tissues also can adjust their metabolism to prevailing conditions, but none of these tissues is as adaptable as the liver, and none is so central to the organism’s overall metabolism.
We turn now to a survey of the possible fates of sugars, amino acids, and lipids that enter the liver from the bloodstream.
Carbohydrates
The glucose transporter of hepatocytes (GLUT2) allows rapid, passive diffusion of glucose, so that the concentration of glucose in a hepatocyte is essentially the same as that in the blood. Glucose entering hepatocytes is phosphorylated by glucokinase (hexokinase IV) to yield glucose 6-phosphate. Glucokinase has a much higher for glucose (10 mm) than do the hexokinase isozymes in other cells (p. 539) and, unlike these other isozymes, it is not inhibited by its product, glucose 6-phosphate. The presence of glucokinase allows hepatocytes to continue phosphorylating glucose when the glucose concentration rises well above levels that would overwhelm other hexokinases. The high of glucokinase also ensures that the phosphorylation of glucose in hepatocytes is minimal when the glucose concentration is low, preventing the liver from consuming glucose as fuel via glycolysis. This spares glucose for other tissues. Fructose, galactose, and mannose, all absorbed from the small intestine, are also converted to glucose 6-phosphate by enzymatic pathways examined in Chapter 14 (see Fig. 14-9). Glucose 6-phosphate is at the crossroads of carbohydrate metabolism in the liver. It may take any of several major metabolic routes (Fig. 23-10), depending on the current metabolic needs of the organism. By the action of various allosterically regulated enzymes, and through hormonal regulation of enzyme synthesis and activity, the liver directs the flow of glucose into one or more of these pathways.
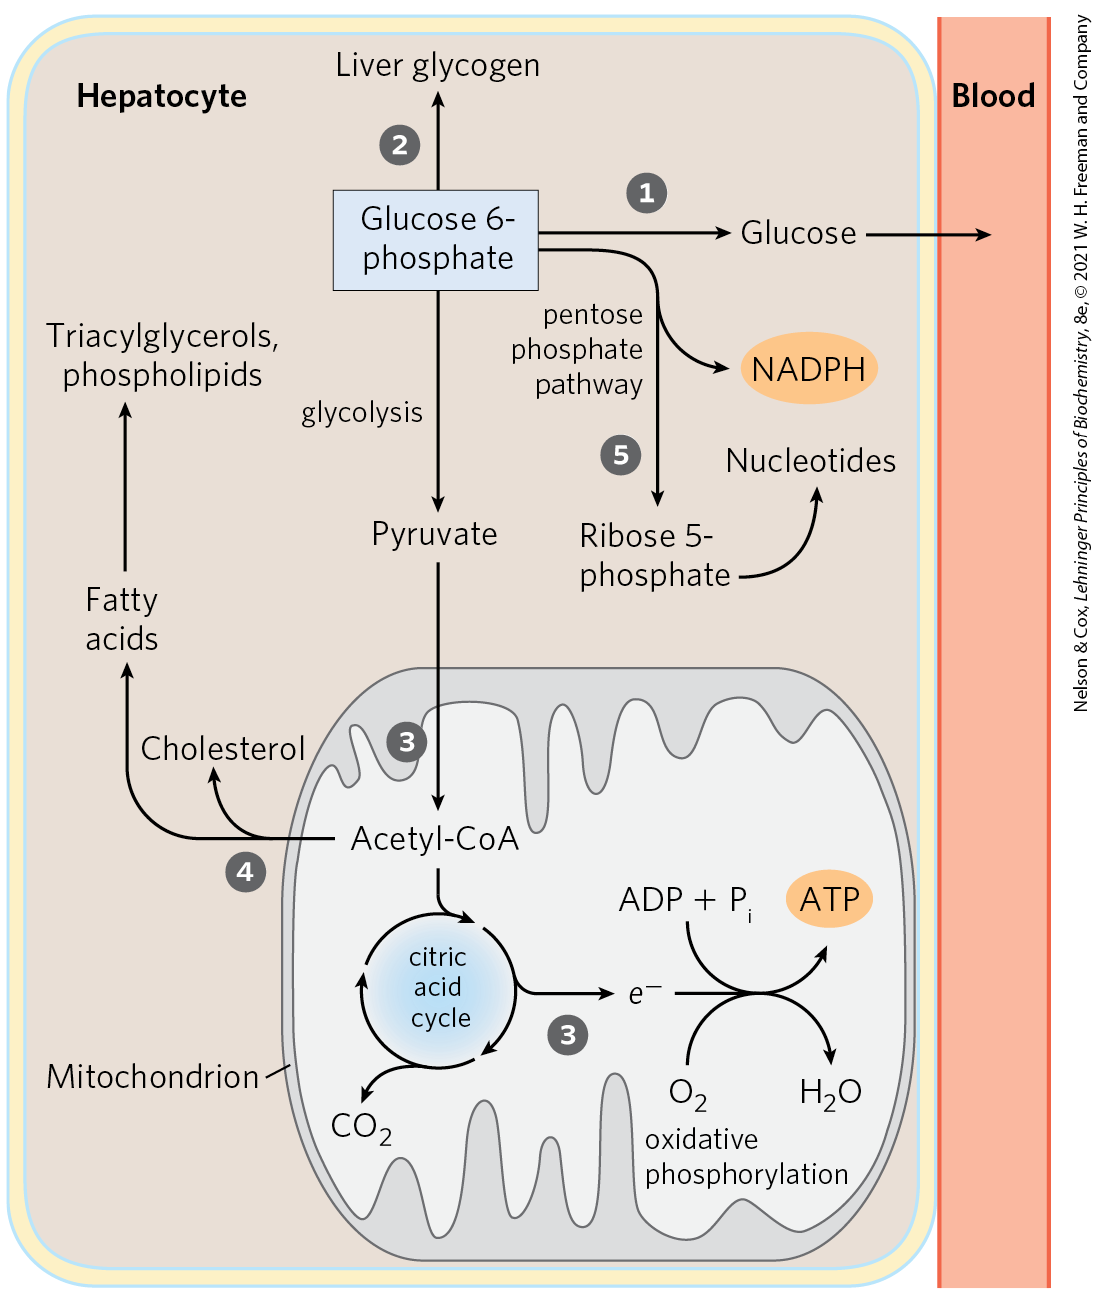
FIGURE 23-10 Metabolic pathways for glucose 6-phosphate in the liver. Here and in Figures 23-11 and 23-12, anabolic pathways are generally shown leading upward, catabolic pathways leading downward, and distribution to other organs leading horizontally. The numbered processes in each figure are described in the text.
Glucose 6-phosphate is dephosphorylated by glucose 6-phosphatase to yield free glucose (see Fig. 15-6), which is exported to replenish blood glucose. Export is the predominant pathway when glucose 6-phosphate is in limited supply, because the blood glucose concentration must be kept sufficiently high (4 to 5 mm) to provide adequate energy for the brain and other tissues. Glucose 6-phosphate not immediately needed to form blood glucose is converted to liver glycogen, or has one of several other fates. Following glycolysis and the pyruvate dehydrogenase reaction, the acetyl-CoA so formed can be oxidized for ATP production by the citric acid cycle, with ensuing electron transfer and oxidative phosphorylation yielding ATP. (Normally, however, fatty acids are the preferred fuel for ATP production in hepatocytes.) Acetyl-CoA can also serve as the precursor of fatty acids, which are incorporated into TAGs and phospholipids, and of cholesterol. Much of the lipid synthesized in the liver is transported to other tissues by blood lipoproteins. Alternatively, glucose 6-phosphate can enter the pentose phosphate pathway, yielding both reducing power (NADPH), needed for the biosynthesis of fatty acids and cholesterol, and ribose 5-phosphate, a precursor for nucleotide biosynthesis. NADPH is also an essential cofactor in the detoxification and elimination of many drugs and other xenobiotics (compounds that don’t occur naturally but are the products of human activity, such as drugs, food additives, and preservatives) that are metabolized in the liver.
 Glucose 6-phosphate is dephosphorylated by glucose 6-phosphatase to yield free glucose (see
  Glucose 6-phosphate not immediately needed to form blood glucose is converted to liver glycogen, or has one of several other fates. Following glycolysis and the pyruvate dehydrogenase reaction,
  the acetyl-CoA so formed can be oxidized for ATP production by the citric acid cycle, with ensuing electron transfer and oxidative phosphorylation yielding ATP. (Normally, however, fatty acids are the preferred fuel for ATP production in hepatocytes.)
  Acetyl-CoA can also serve as the precursor of fatty acids, which are incorporated into TAGs and phospholipids, and of cholesterol. Much of the lipid synthesized in the liver is transported to other tissues by blood lipoproteins.
  Alternatively, glucose 6-phosphate can enter the pentose phosphate pathway, yielding both reducing power (NADPH), needed for the biosynthesis of fatty acids and cholesterol, and ribose 5-phosphate, a precursor for nucleotide biosynthesis. NADPH is also an essential cofactor in the detoxification and elimination of
 Amino Acids
Amino acids that enter the liver follow several important metabolic routes (Fig. 23-11). They are precursors for protein synthesis, a process discussed in Chapter 27. The liver constantly renews its own proteins, which have a relatively high turnover rate (average half-life of hours to days), and it is also the site of biosynthesis of most plasma proteins. Alternatively, amino acids pass in the bloodstream to other organs to be used in the synthesis of tissue proteins. Other amino acids are precursors in the biosynthesis of nucleotides, hormones, and other nitrogenous compounds in the liver and other tissues.
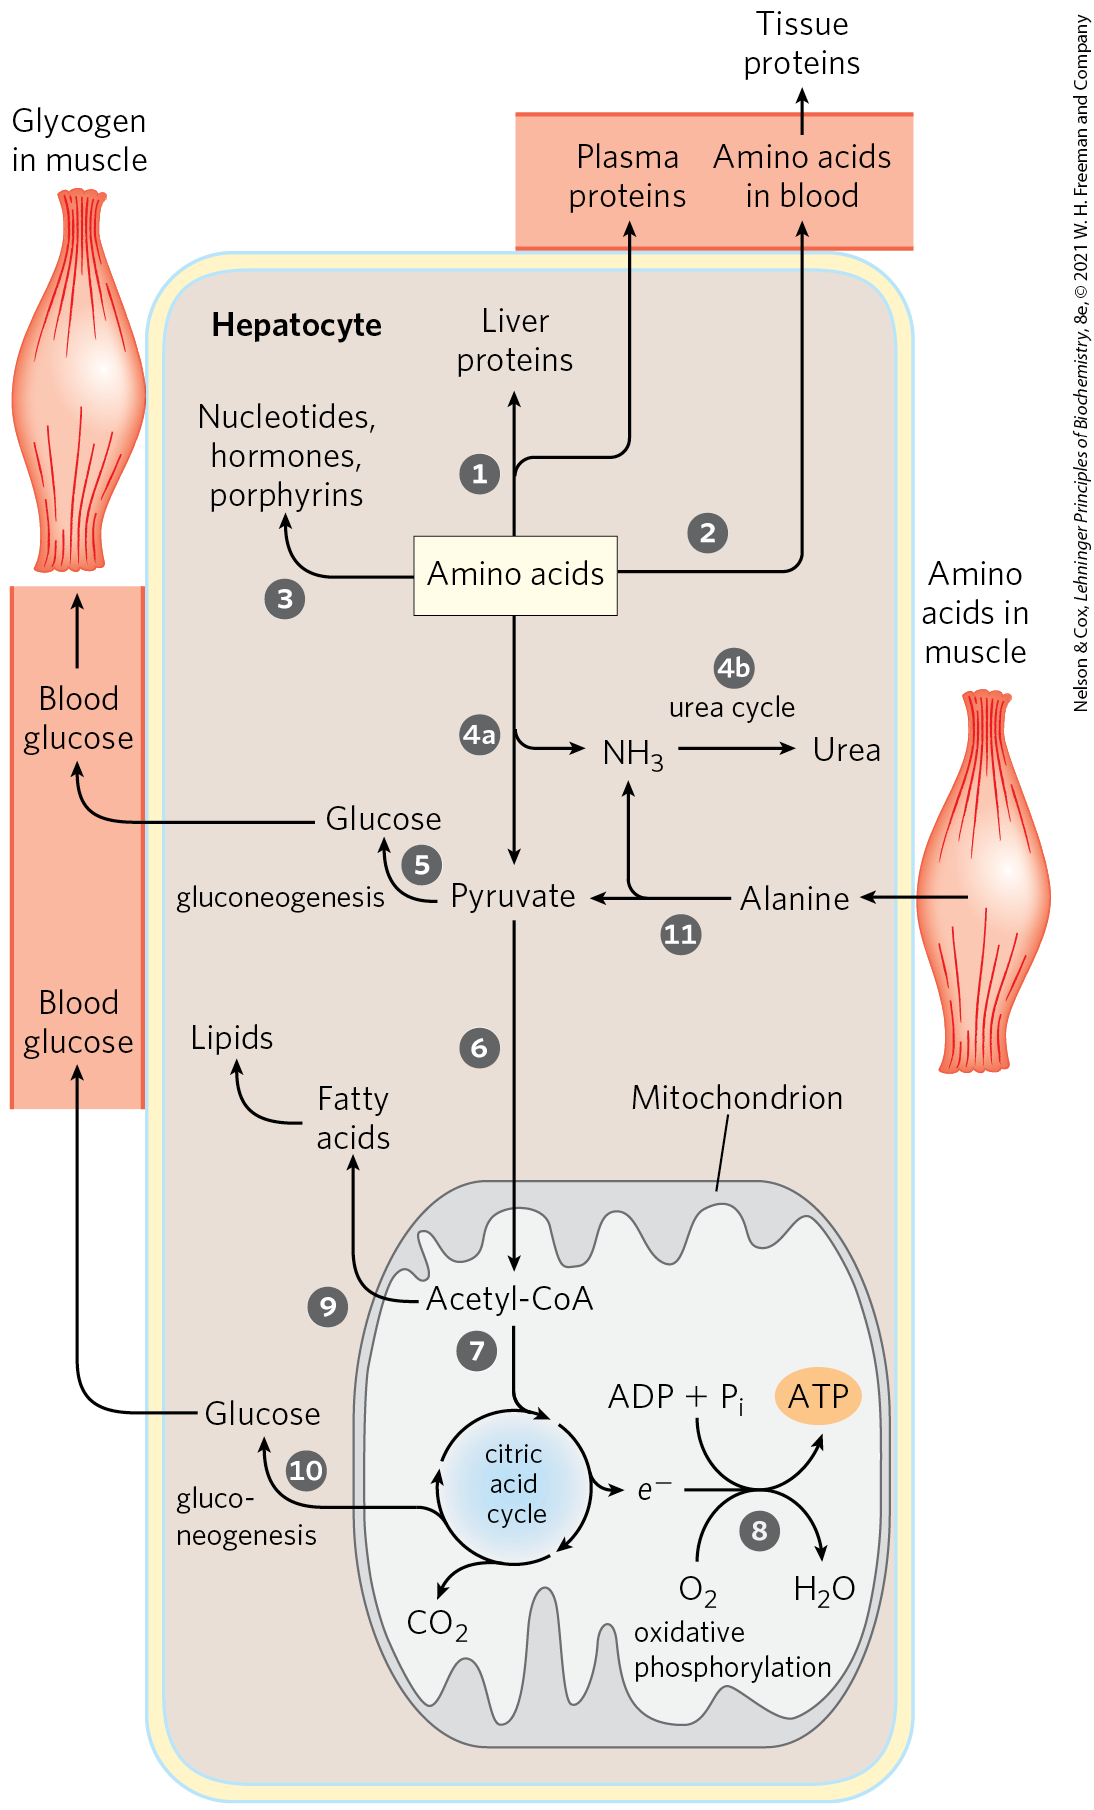
FIGURE 23-11 Metabolism of amino acids in the liver.
Amino acids not needed as biosynthetic precursors are transaminated or deaminated and degraded to yield pyruvate and citric acid cycle intermediates, with various fates; the ammonia released is converted to the excretory product urea. Pyruvate can be converted to glucose and glycogen via gluconeogenesis, or can be converted to acetyl-CoA, which has several possible fates: oxidation via the citric acid cycle and oxidative phosphorylation to produce ATP, or conversion to lipids for storage. Citric acid cycle intermediates can be siphoned off into glucose synthesis by gluconeogenesis.
 Amino acids not needed as biosynthetic precursors are transaminated or deaminated and degraded to yield pyruvate and citric acid cycle intermediates, with various fates;
  the ammonia released is converted to the excretory product urea.
  can be converted to acetyl-CoA, which has several possible fates:
  oxidation via the citric acid cycle and
  oxidative phosphorylation to produce ATP, or
  conversion to lipids for storage.
  Citric acid cycle intermediates can be siphoned off into glucose synthesis by gluconeogenesis.
The liver also metabolizes amino acids that arrive intermittently from other tissues. The blood is adequately supplied with glucose just after the digestion and absorption of dietary carbohydrate or, between meals, by the conversion of liver glycogen to blood glucose. During the interval between meals, especially if prolonged, some muscle protein is degraded to amino acids. These amino acids donate their amino groups (by transamination) to pyruvate, the product of glycolysis, to yield alanine, which is transported to the liver and deaminated. Hepatocytes convert the resulting pyruvate to blood glucose via gluconeogenesis , and the ammonia to urea for excretion . One benefit of this glucose-alanine cycle is the smoothing out of fluctuations in blood glucose between meals. The amino acid deficit incurred in muscles is made up after the next meal by incoming dietary amino acids.
 The liver also metabolizes amino acids that arrive intermittently from other tissues. The blood is adequately supplied with glucose just after the digestion and absorption of dietary carbohydrate or, between meals, by the conversion of liver glycogen to blood glucose. During the interval between meals, especially if prolonged, some muscle protein is degraded to amino acids. These amino acids donate their amino groups (by transamination) to pyruvate, the product of glycolysis, to yield alanine, which
  is transported to the liver and deaminated. Hepatocytes convert the resulting pyruvate to blood glucose via gluconeogenesis
 Lipids
The fatty acid components of lipids entering hepatocytes also have several different fates (Fig. 23-12). Some are converted to liver lipids. Under most circumstances, fatty acids are the primary oxidative fuel in the liver. Free fatty acids may be activated and oxidized to yield acetyl-CoA and NADH. The acetyl-CoA is further oxidized via the citric acid cycle, and oxidations in the cycle drive the synthesis of ATP by oxidative phosphorylation. Excess acetyl-CoA, not required by the liver, is converted to acetoacetate and β-hydroxybutyrate; these ketone bodies circulate in the blood to other tissues to be used as fuel for the citric acid cycle. Ketone bodies, unlike fatty acids, can cross the blood-brain barrier, providing the brain with a source of acetyl-CoA for energy-yielding oxidation. Ketone bodies can supply a significant fraction of the energy in some extrahepatic tissues — up to one-third in the heart and as much as 60% to 70% in the brain during prolonged fasting. Some of the acetyl-CoA derived from fatty acids (and from glucose) is used for the biosynthesis of cholesterol, which is required for membrane synthesis. Cholesterol is also the precursor of all steroid hormones and of the bile salts, which are essential for the digestion and absorption of lipids.
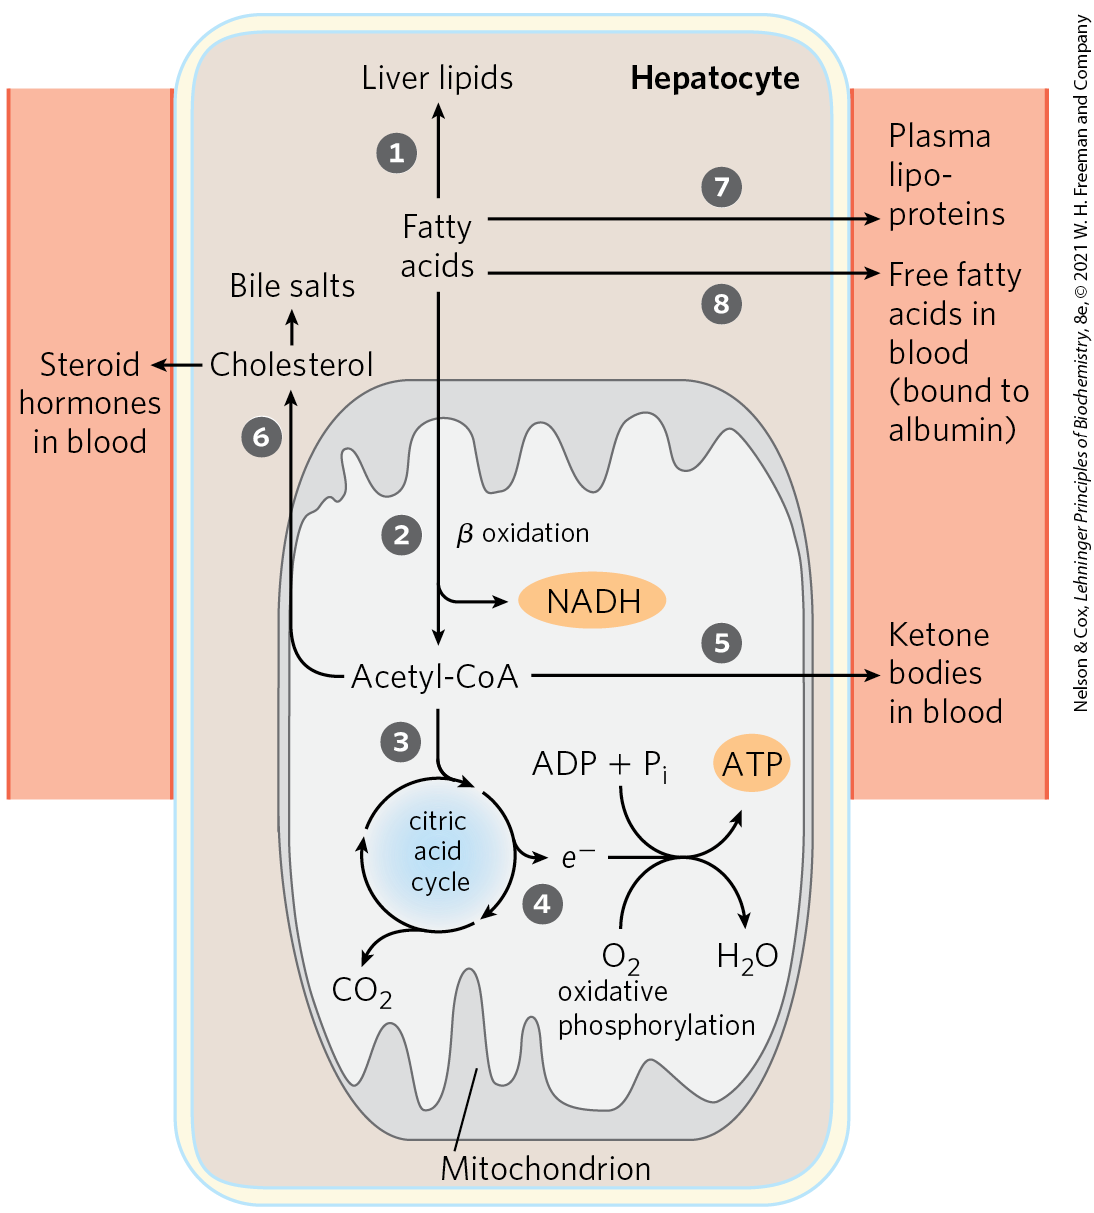
FIGURE 23-12 Metabolism of fatty acids in the liver.
The other two metabolic fates of lipids require specialized mechanisms for the transport of insoluble lipids in blood. Fatty acids are converted to the phospholipids and TAGs of plasma lipoproteins, which carry lipids to adipose tissue for storage. Some free fatty acids (FFAs) are bound to serum albumin and carried to the heart and skeletal muscles, which take up and oxidize FFAs as a major fuel. Serum albumin is the most abundant plasma protein; one molecule can carry up to seven FFA molecules (see Fig. 17-3).
The liver thus serves as the body’s distribution center, exporting nutrients in the correct proportions to other organs, smoothing out fluctuations in metabolism caused by intermittent food intake, and processing excess amino groups into urea and other products to be disposed of by the kidneys. Certain nutrients are stored in the liver, including iron ions and vitamin A. The liver also detoxifies xenobiotics. Detoxification often includes the cytochrome P-450–dependent hydroxylation of relatively insoluble organic compounds, making them sufficiently soluble for further breakdown and excretion (see Box 21-1).
Adipose Tissues Store and Supply Fatty Acids
There are two primary types of adipose tissue, white and brown (Fig. 23-13), with different roles, and we focus first on the more abundant of the two. White adipose tissue (WAT) is amorphous and widely distributed in the body: under the skin, around deep blood vessels, and in the abdominal cavity. The adipocytes of white adipose tissue are large (diameter 30 to 70 μm), spherical cells, completely filled with a single large lipid droplet that constitutes about 65% of the cell mass and squeezes the mitochondria and nucleus into a thin layer against the plasma membrane (Fig. 23-13a, c). The lipid droplet contains TAGs and sterol esters and is coated with a monolayer of phospholipids, oriented with their polar head groups facing the cytosol. Specific proteins are associated with the surface of the droplets, including perilipin and the enzymes for synthesis and breakdown of TAGs (see Fig. 17-2). White adipose tissue typically makes up about 15% of the mass of a healthy young adult human. Adipocytes are metabolically active, responding quickly to hormonal stimuli in a metabolic interplay with the liver, skeletal muscles, and heart.
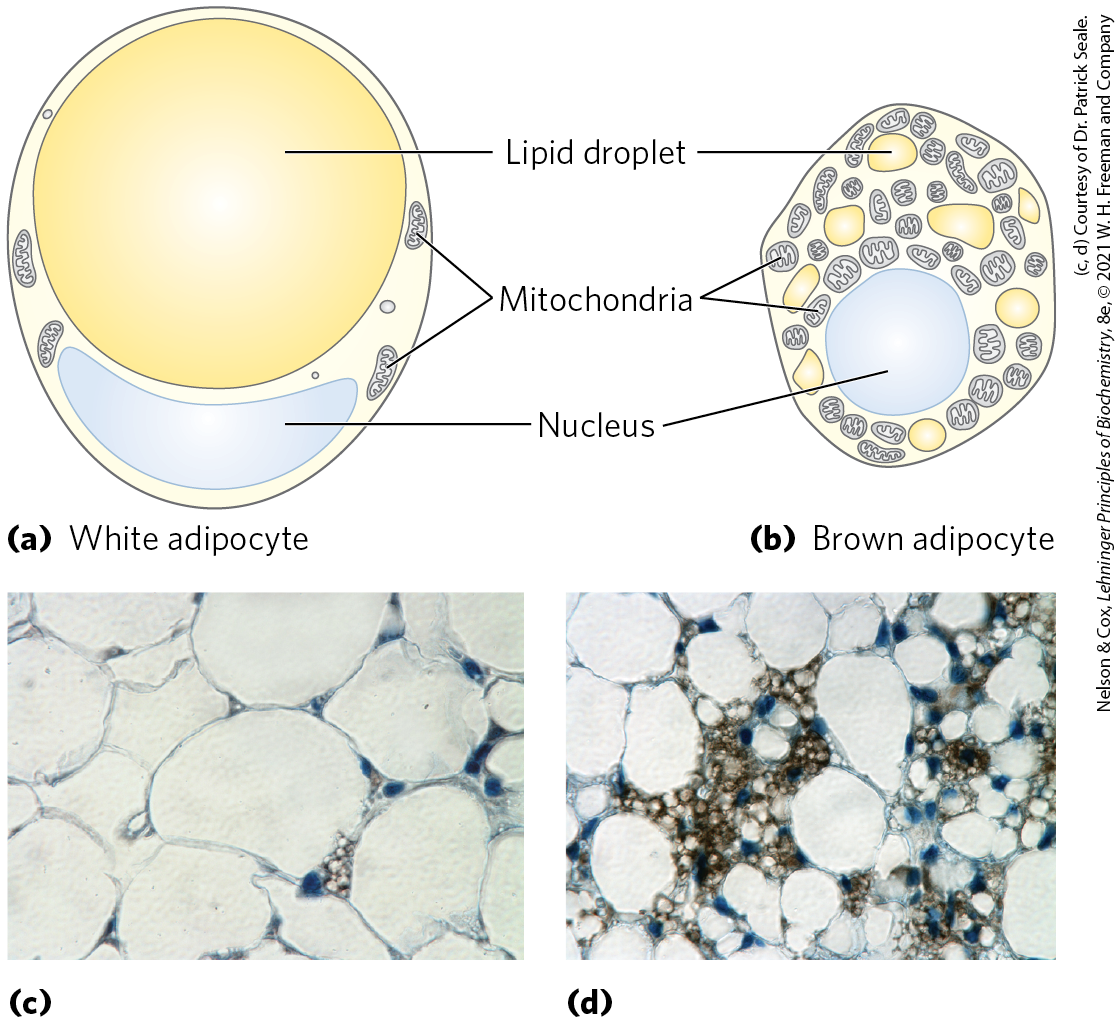
FIGURE 23-13 White and brown adipose tissue. Schematic views of typical mouse adipocytes from (a) white adipose tissue (WAT) and (b) brown adipose tissue (BAT). White adipocytes are larger and contain a single huge lipid droplet, which squeezes the mitochondria and nucleus against the plasma membrane. In brown adipocytes, mitochondria are much more prominent, the nucleus is near the center of the cell, and multiple small fat droplets are present. Below are light micrographs of (c) adipocytes in white adipose tissue, stained to show nuclei, and (d) a region of mixed white and brown adipocytes, stained with an antibody specific to UCP1, the uncoupling protein responsible for thermogenesis.
Adipocytes have an active glycolytic metabolism, oxidize pyruvate and fatty acids via the citric acid cycle, and carry out oxidative phosphorylation. During periods of high carbohydrate intake, adipose tissue can convert glucose (via pyruvate and acetyl-CoA) to fatty acids, convert the fatty acids to TAGs, and store the TAGs as large lipid droplets — although in humans, much of the fatty acid synthesis occurs in hepatocytes. Adipocytes store TAGs arriving from the liver (carried in the blood as very-low-density lipoproteins) and from the intestinal tract (carried in chylomicrons), particularly after meals rich in fat.
When the demand for fuel rises (between meals, for example), lipases in adipocytes hydrolyze stored TAGs to release FFAs, which can travel in the bloodstream to skeletal muscle, the heart, and, during starvation, the liver. The release of fatty acids from adipocytes is greatly accelerated by epinephrine, which stimulates the cAMP-dependent phosphorylation of perilipin and thus gives lipases that are specific for tri-, di-, and monoacylglycerols access to TAGs in lipid droplets (see Fig. 17-2). Hormone-sensitive lipase is also stimulated by phosphorylation. Insulin counterbalances this effect of epinephrine, decreasing the activity of the lipase.
The breakdown and synthesis of TAGs in adipose tissue constitute a substrate cycle; up to 70% of the fatty acids released by the three lipases are reesterified in adipocytes, re-forming TAGs. Each cycle consumes ATP (used to activate the fatty acids as acyl-CoA esters), so the net effect of the substrate cycling is the breakdown of ATP and the accompanying release of heat. In adipose tissue, glycerol liberated by adipocyte lipases cannot be reused in the synthesis of TAGs, because adipocytes lack glycerol kinase. Instead, the glycerol phosphate required for TAG synthesis is made from pyruvate by glyceroneogenesis, requiring the action of the cytosolic PEP carboxykinase (see Fig. 21-22).
In addition to its central function as a fuel depot, adipose tissue plays an important role as an endocrine organ, producing and releasing hormones that signal the state of energy reserves and coordinate metabolism of fats and carbohydrates throughout the body. We return to this function in Section 23.4 when we discuss the hormonal regulation of body mass.
Brown and Beige Adipose Tissues Are Thermogenic
In small vertebrates and hibernating animals, a significant proportion of the adipose tissue is brown adipose tissue (BAT), distinguished from white adipose tissue by its smaller (diameter 20 to 40 μm), differently shaped (polygonal, not round) adipocytes (Fig. 23-13b, d). Like white adipocytes, brown adipocytes store TAGs, but in several smaller lipid droplets per cell rather than as a single central droplet. Brown adipocytes have more mitochondria and a richer supply of capillaries and innervation than white adipocytes; it is the cytochromes of mitochondria and the hemoglobin in capillaries that give brown adipose tissue its characteristic color. A unique feature of brown adipocytes is their production of uncoupling protein 1 (UCP1), also called thermogenin (see Fig. 19-36). This protein is responsible for one of the principal functions of brown adipose tissue: thermogenesis.
In brown adipocytes, fatty acids stored in lipid droplets are released, enter mitochondria, and undergo complete conversion to by β oxidation and the citric acid cycle. The reduced and NADH so generated pass their electrons through the respiratory chain to molecular oxygen. In white adipocytes, protons pumped out of the mitochondria during electron transfer reenter the matrix through ATP synthase, with the energy of electron transfer conserved in ATP synthesis. In brown adipocytes, UCP1 provides an alternative route for the reentry of protons that bypasses ATP synthase. The energy of the proton gradient is thus dissipated as heat, which can maintain the body (especially the nervous system and viscera) at its optimal temperature when the ambient temperature is relatively low.
In the human fetus, differentiation of fibroblast preadipocytes into brown adipose tissue begins at the twentieth week of gestation, and at the time of birth, brown adipose tissue represents 1% to 5% of total body mass. The brown fat deposits are located where the heat generated by thermogenesis can ensure that vital tissues — blood vessels to the head, major abdominal blood vessels, and the viscera, including the pancreas, adrenal glands, and kidneys — are not chilled as the newborn enters a world of lower ambient temperature (Fig. 23-14a).
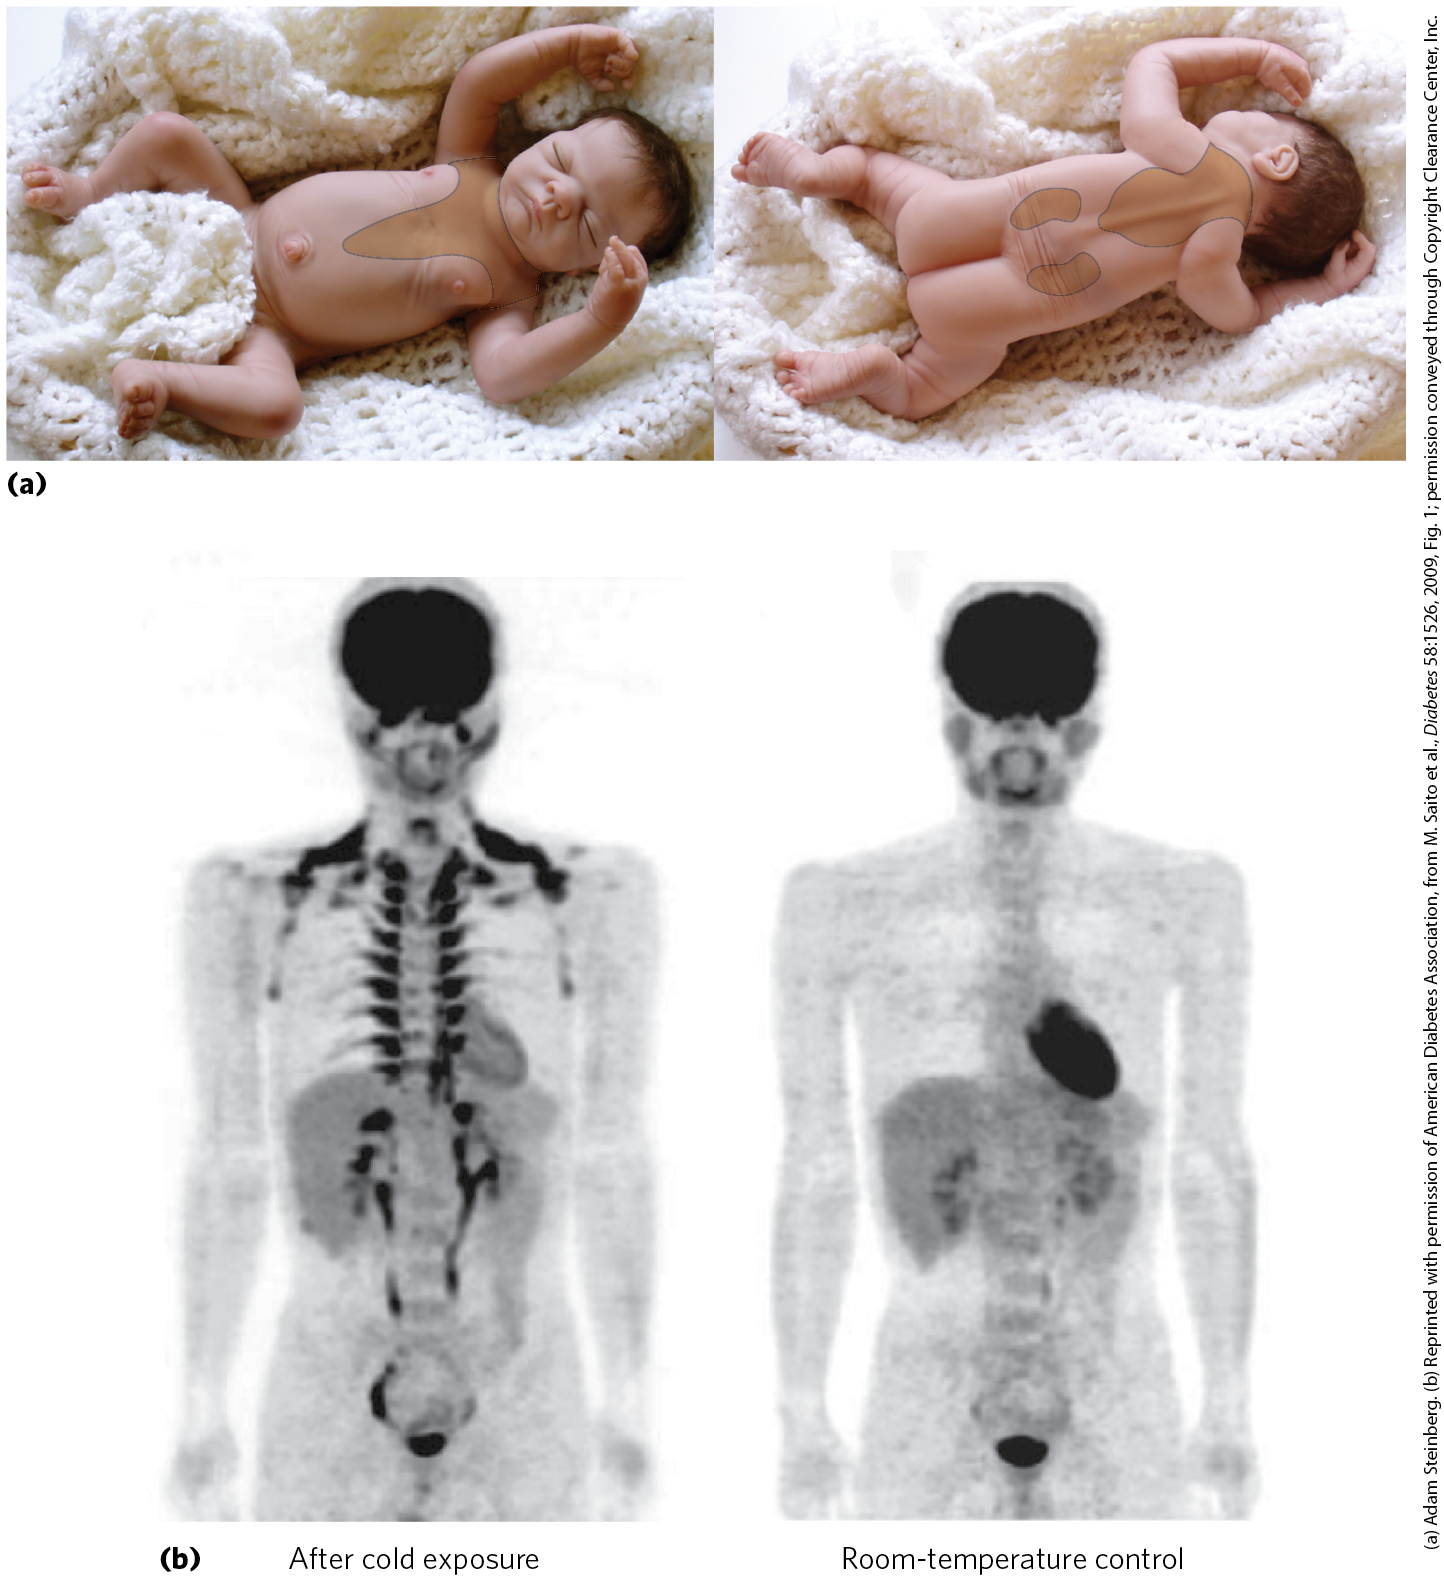
FIGURE 23-14 Brown adipose tissue in infants and adults. (a) At birth, human infants have brown fat distributed as shown here, to protect the spine, major blood vessels, and internal organs. (b) Positron emission tomography (PET) scanning can show metabolic activity in a living person, in real time. PET scans allow visualization of isotopically labeled glucose in precisely localized regions of the body. A positron-emitting glucose analog, -fluoro-2-deoxy-d-glucose (FDG), is injected into the bloodstream; a short time later, a PET scan shows how much of the glucose has been taken up by each part of the body — a measure of metabolic activity. On the left is a PET scan of a healthy 25-year-old man who fasted for 12 hours, then stayed for 1 hour in a cold room, with his legs on ice to thoroughly chill him. At the end of the hour, he was injected with -FDG, then remained under cold conditions for another hour. Whole-body PET scans were then done at . For the control scan, the same man underwent the same PET scan protocol two weeks later, but this time following 2 hours at instead of chilling (right). Intense labeling of the brain and heart shows high rates of glucose uptake; labeling of the kidneys and bladder indicates clearance of FDG. In the scan after chilling (left), -FDG labels brown adipose tissue in the region above the collarbone and along the vertebrae.
At birth, white adipose tissue development begins and brown adipose tissue begins to disappear. Young adult humans have much-diminished deposits of brown adipose tissue, ranging from 3% of all adipose tissue in males to 7% in females, making up less than 0.1% of body mass. However, adults have, distributed among their white adipose cells, significant numbers of adipocytes that can be converted by cold exposure or by β-adrenergic stimulation into cells very similar to brown adipocytes. These beige adipocytes have multiple lipid droplets, are richer in mitochondria than white adipocytes, and produce UCP1, so they function effectively as heat generators. Brown and beige adipocytes produce heat by oxidation of their own fatty acids, but they also take up and oxidize both fatty acids and glucose from the blood at rates out of proportion to their mass. In fact, the detection of brown adipose tissue by PET scanning depends on the adipocytes’ relatively high rate of glucose uptake and metabolism (Fig. 23-14b). In adaptation to warm or cold surroundings, and in the normal differentiation of white, brown, and beige adipose tissue, the nuclear transcription factor PPARγ (described later in the chapter) plays a central role. And as we noted above, the peptide hormone irisin, produced in muscle by exercise, triggers the development of beige adipose tissue that continues to burn fuel long after the exercise ends.
Muscles Use ATP for Mechanical Work
Metabolism in skeletal muscle cells — myocytes — is specialized to generate ATP as the immediate source of energy for contraction. Moreover, skeletal muscle is adapted to do its mechanical work intermittently, on demand. Sometimes skeletal muscles must work at their maximum capacity for a short time, as in a 100 m sprint; at other times more prolonged work is required, as in running a marathon or in prolonged physical labor.
There are two general classes of muscle tissue, which differ in physiological role and fuel utilization. Slow-twitch muscle, also called red muscle, provides relatively low tension but is highly resistant to fatigue. It produces ATP by the relatively slow but steady process of oxidative phosphorylation. Red muscle is very rich in mitochondria and is served by dense networks of blood vessels, which bring the oxygen essential to ATP production. Fast-twitch muscle, or white muscle, has fewer mitochondria than red muscle and is less well supplied with blood vessels, but it can develop greater tension and do so faster. White muscle is quicker to fatigue because, when active, it uses ATP faster than it can replace it. There is a genetic component to the proportion of red and white muscle in any individual, but with training, an athlete can improve the endurance of fast-twitch muscle.
Skeletal muscle can use free fatty acids or glucose as fuel, depending on the degree of muscular activity (Fig. 23-15). In resting muscle, the primary fuels are FFAs from adipose tissue. These are oxidized and degraded to yield acetyl-CoA, which enters the citric acid cycle, ultimately yielding the energy for ATP synthesis by oxidative phosphorylation. Muscle in light activity uses blood glucose in addition to fatty acids. The glucose is phosphorylated, then degraded by glycolysis to pyruvate, which is converted to acetyl-CoA and oxidized via the citric acid cycle and oxidative phosphorylation.
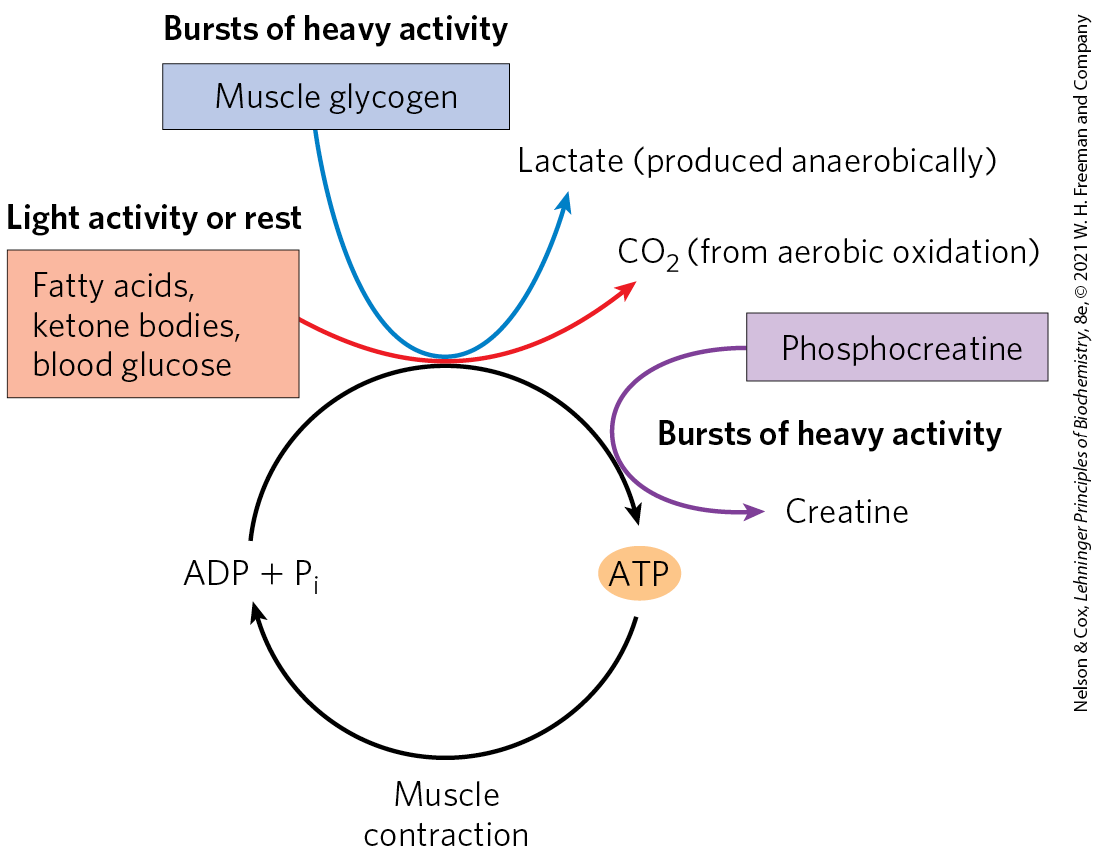
FIGURE 23-15 Energy sources for muscle contraction. Different fuels are used for ATP synthesis during bursts of heavy activity and during light activity or rest. Phosphocreatine can rapidly supply ATP.
In maximally active fast-twitch muscles, the demand for ATP is so great that the blood flow cannot provide and fuels fast enough to supply sufficient ATP by aerobic respiration alone. Under these conditions, stored muscle glycogen is broken down to lactate by fermentation (p. 525). Each glucose unit degraded yields three ATP, because phosphorolysis of glycogen produces glucose 6-phosphate (via glucose 1-phosphate), sparing the ATP normally consumed in the hexokinase reaction. Lactic acid fermentation thus responds more quickly than oxidative phosphorylation to an increased need for ATP, supplementing basal ATP production by aerobic oxidation of other fuels via the citric acid cycle and respiratory chain. The secretion of epinephrine, which stimulates both the release of glucose from liver glycogen and the breakdown of glycogen in muscle tissue, greatly enhances the use of blood glucose and muscle glycogen as fuels for muscular activity. (Epinephrine mediates the so-called fight-or-flight response, discussed more fully below.)
The relatively small amount of glycogen (about 1% of the total weight of skeletal muscle) limits the glycolytic energy available during all-out exertion. Moreover, the accumulation of lactate and consequent decrease in pH in maximally active muscles reduces their efficiency. Skeletal muscle, however, contains another source of ATP, phosphocreatine (10 to 30 mm), which can rapidly regenerate ATP from ADP by the creatine kinase reaction:
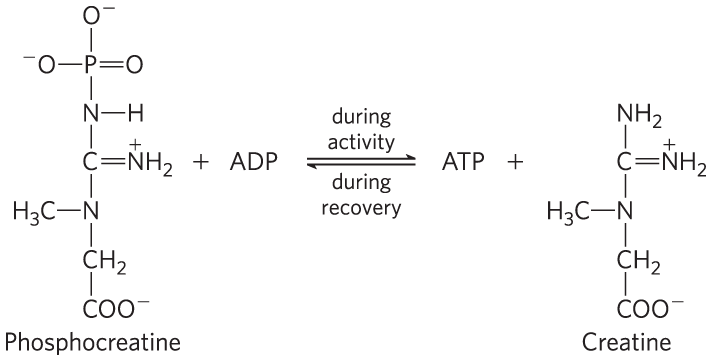
During periods of active contraction and glycolysis, this reaction proceeds predominantly in the direction of ATP synthesis; during recovery from exertion, the same enzyme resynthesizes phosphocreatine from creatine and ATP. Because of the relatively high levels of ATP and phosphocreatine in muscle, these compounds can be detected in intact muscle, in real time, by NMR spectroscopy (Fig. 23-16). Creatine serves to shuttle ATP equivalents from the mitochondrion to sites of ATP consumption and can be the limiting factor in the development of new muscle tissue (Box 23-1).
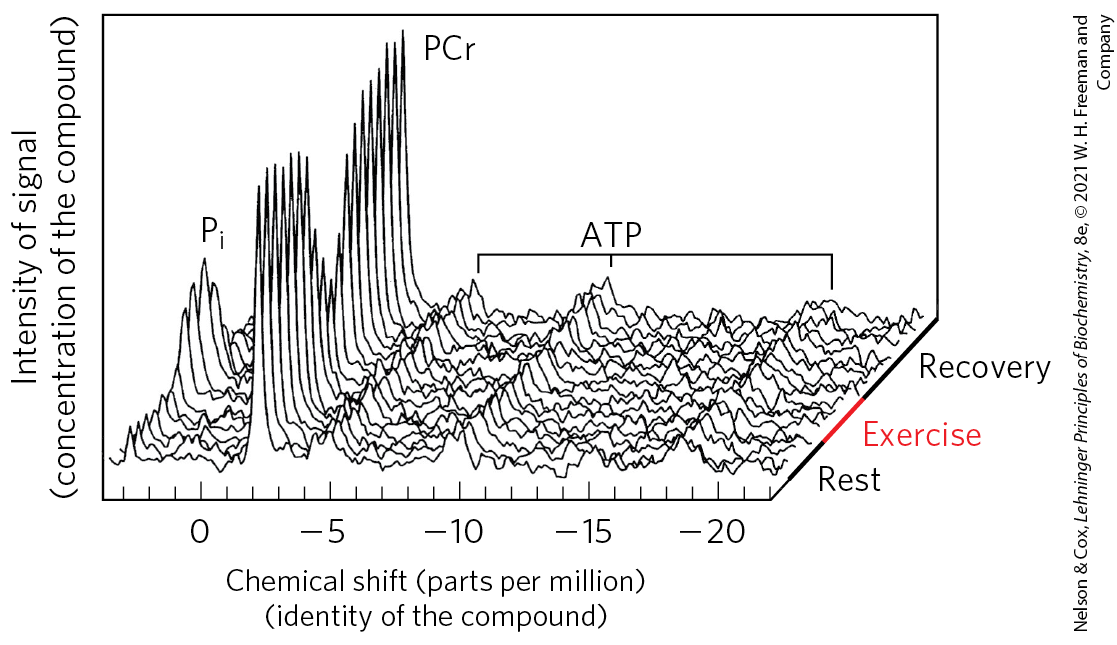
FIGURE 23-16 Phosphocreatine buffers ATP concentration during exercise. A “stack plot” of magnetic resonance spectra (of ) shows inorganic phosphate (), phosphocreatine (PCr), and ATP (each of its three phosphates giving a signal). The series of plots represents the passage of time, from a period of rest to one of exercise, and then of recovery. Notice that the ATP signal barely changes during exercise, kept high by continued respiration and by the reservoir of phosphocreatine, which diminishes during exercise. During recovery, when ATP production by catabolism is greater than ATP use by the (now resting) muscle, the phosphocreatine reservoir is refilled. [Data from M. L. Blei, K. E. Conley, and M. J. Kushmerick, J. Physiol. 465:203, 1993, Fig. 4.]
After a period of intense muscular activity, the individual continues breathing heavily for some time, using much of the extra for oxidative phosphorylation in the liver. The ATP produced is used for gluconeogenesis (in the liver) from lactate that has been carried in the blood from the muscles. The glucose thus formed returns to the muscles to replenish their glycogen, completing the Cori cycle (Fig. 23-17; see also Box 15-1).
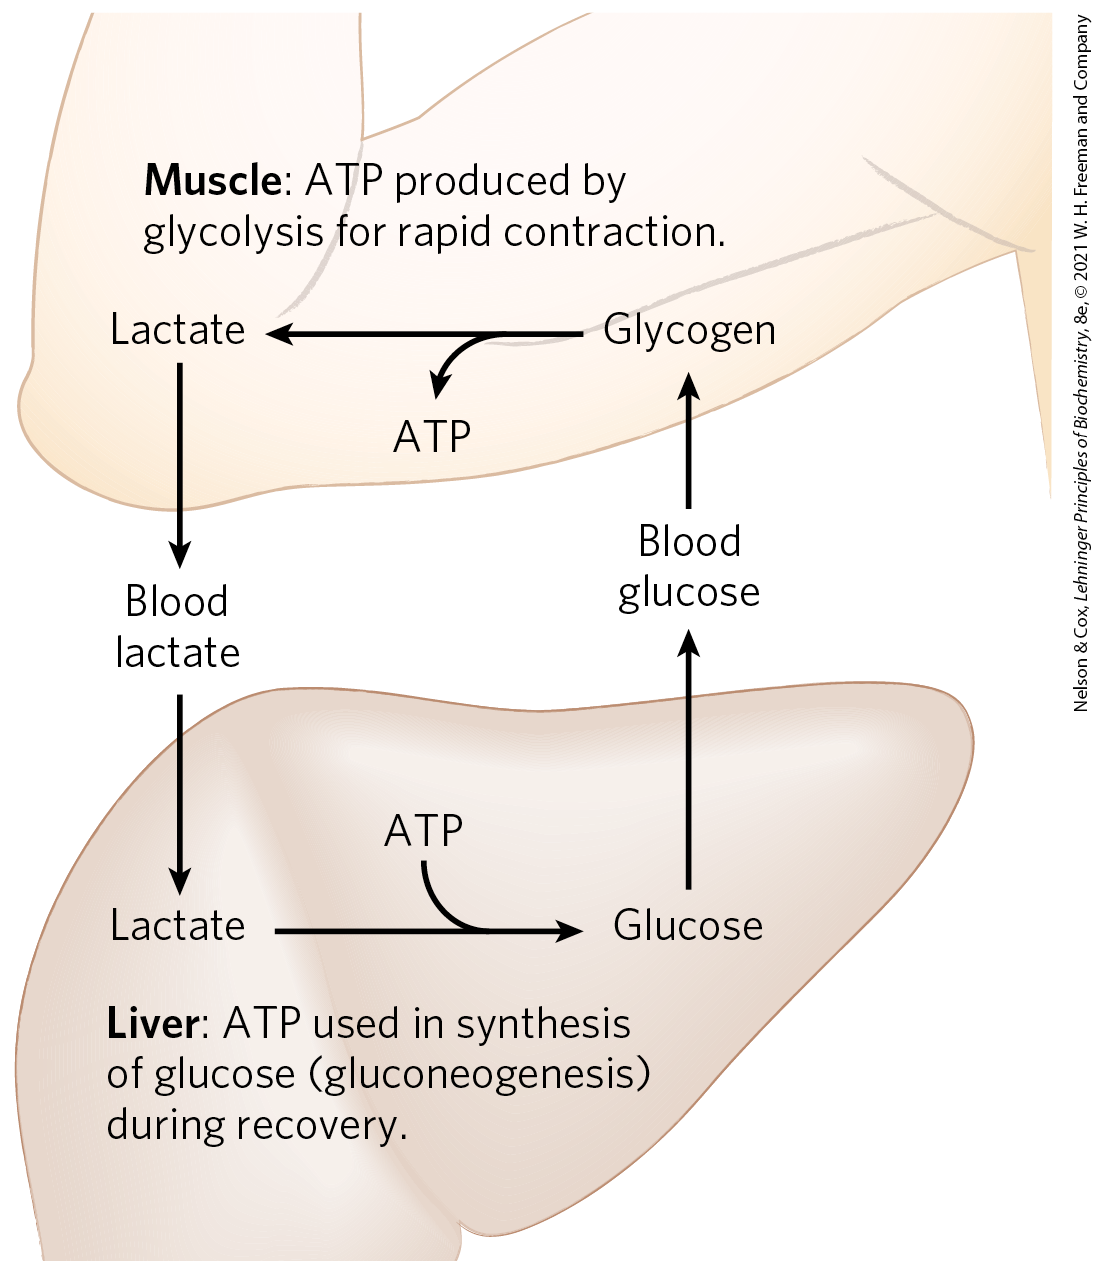
FIGURE 23-17 Metabolic cooperation between skeletal muscle and the liver: the Cori cycle. Extremely active muscles use glycogen as their energy source, generating lactate by glycolysis. During recovery, some of the lactate is transported to the liver and converted to glucose by gluconeogenesis. The glucose is released to the blood and returned to the muscles to replenish their glycogen stores. The overall pathway, glucose → lactate → glucose, constitutes the Cori cycle.
Actively contracting skeletal muscle generates heat as a byproduct of imperfect coupling of the chemical energy of ATP with the mechanical work of contraction. This heat production can be put to good use when ambient temperature is low: skeletal muscle carries out shivering thermogenesis, rapidly repeated muscle contraction that produces heat but little motion, helping to maintain the body at its preferred temperature of .
Heart muscle differs from skeletal muscle in that it is continuously active in a regular rhythm of contraction and relaxation, and has a completely aerobic metabolism at all times. Mitochondria are much more abundant in heart muscle than in skeletal muscle, making up almost half the volume of the cells (Fig. 23-18). The heart uses mainly FFAs as a source of energy, but also some glucose and ketone bodies taken up from the blood; these fuels are oxidized aerobically to generate ATP. Like skeletal muscle, heart muscle does not store lipids or glycogen in large amounts. It does have small amounts of reserve energy in the form of phosphocreatine, enough for a few seconds of contraction. Because the heart is normally aerobic and obtains its energy from oxidative phosphorylation, the failure of to reach part of the heart muscle when the blood vessels are blocked by lipid deposits (atherosclerosis) or blood clots (coronary thrombosis) can cause that region of the heart muscle to die. This is what happens in myocardial infarction (heart attack).
 Heart muscle differs from skeletal muscle in that it is continuously active in a regular rhythm of contraction and relaxation, and has a completely aerobic metabolism at all times. Mitochondria are much more abundant in heart muscle than in skeletal muscle, making up almost half the volume of the cells (
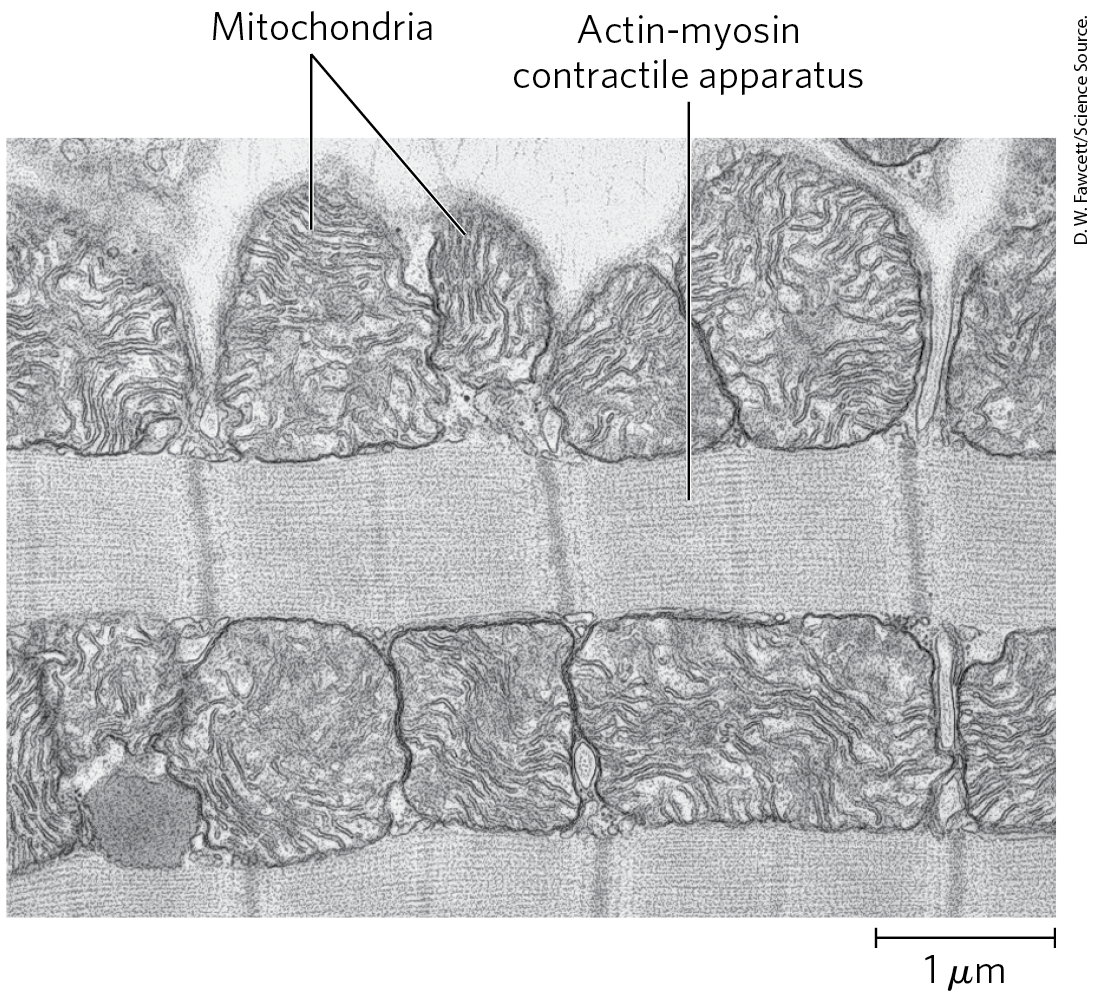
FIGURE 23-18 Electron micrograph of heart muscle. In the profuse mitochondria of heart tissue, pyruvate (from glucose), fatty acids, and ketone bodies are oxidized to drive ATP synthesis. This steady aerobic metabolism allows the human heart to pump blood at a rate of nearly 6 L/min, or about 350 L/h — which amounts to of blood over 70 years.
The Brain Uses Energy for Transmission of Electrical Impulses
The metabolism of the brain is remarkable in several respects. The neurons of the adult mammalian brain normally use only glucose as fuel (Fig. 23-19). (Astrocytes, the other major cell type in the brain, can oxidize fatty acids.) The brain, which constitutes about 2% of total body mass, has a very active respiratory metabolism (Fig. 23-15); more than 90% of the ATP produced in the neurons comes from oxidative phosphorylation. The brain uses at a fairly constant rate, accounting for almost 20% of the total consumed by the body at rest. Because the brain contains very little glycogen, it is constantly dependent on incoming glucose in the blood. Should blood glucose fall significantly below a critical level for even a short time, severe and sometimes irreversible changes in brain function may result.
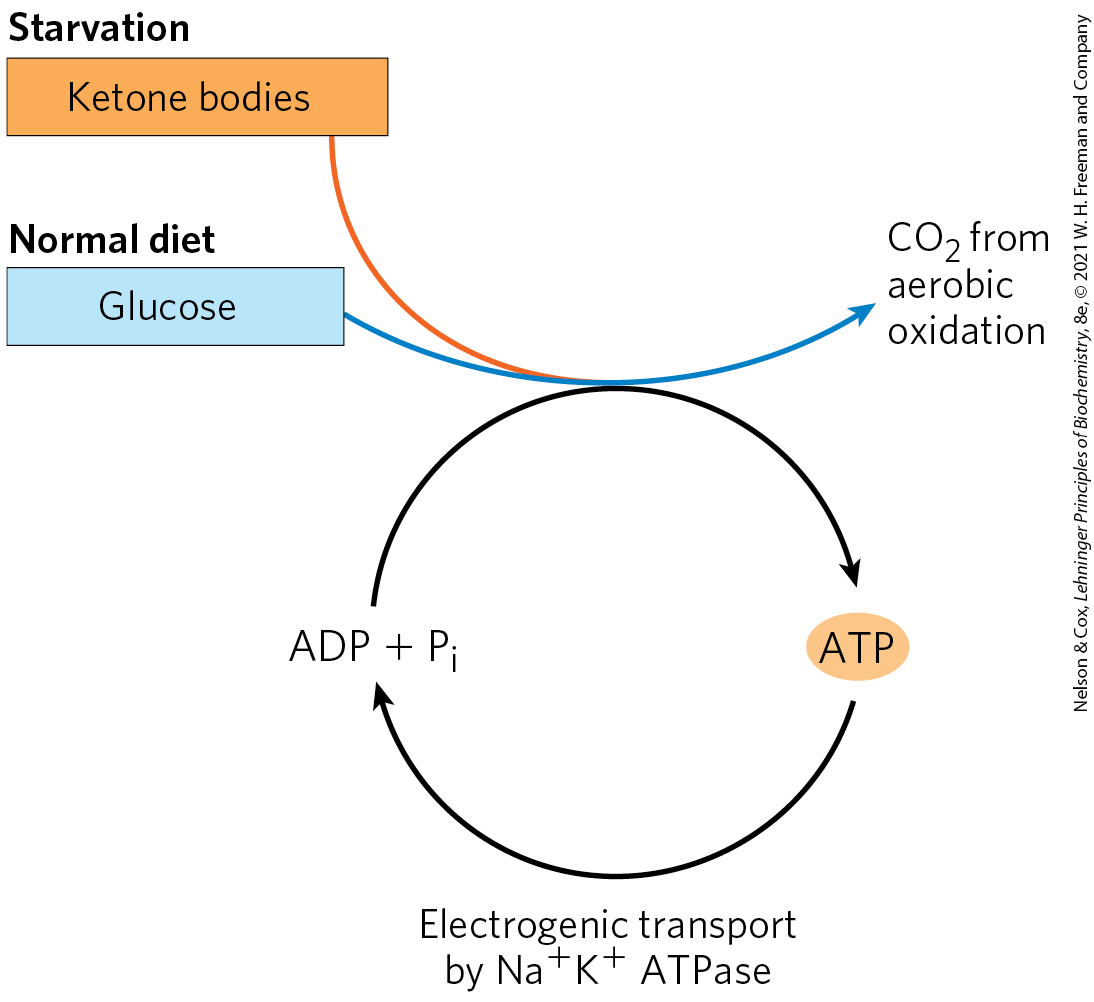
FIGURE 23-19 The fuels that supply ATP in the brain. The energy source used by the brain varies with nutritional state. The ketone body used during starvation is β-hydroxybutyrate. Electrogenic transport by the ATPase maintains the transmembrane potential essential to information transfer among neurons.
Although the neurons of the brain cannot directly use free fatty acids or lipids from the blood as fuels, they can, when necessary, get up to 60% of their energy requirement from the oxidation of β-hydroxybutyrate (a ketone body), formed in the liver from fatty acids. The capacity of the brain to oxidize β-hydroxybutyrate via acetyl-CoA becomes important during prolonged fasting or starvation, after liver glycogen has been depleted, because it allows the brain to use body fat as an energy source. This spares muscle proteins — until they become the brain’s ultimate source of glucose, via gluconeogenesis in the liver, during severe starvation.
 Although the neurons of the brain cannot directly use free fatty acids or lipids from the blood as fuels, they can, when necessary, get up to 60% of their energy requirement from the oxidation of β-hydroxybutyrate (a ketone body), formed in the liver from fatty acids. The capacity of the brain to oxidize β-hydroxybutyrate via acetyl-CoA becomes important during prolonged fasting or starvation, after liver glycogen has been depleted, because it allows the brain to use body fat as an energy source. This spares muscle proteins — until they become the brain’s ultimate source of glucose, via gluconeogenesis in the liver, during severe starvation.
In neurons, energy is required to create and maintain an electrical potential across the plasma membrane. The membrane contains an electrogenic ATP-driven antiporter, the ATPase, which simultaneously pumps two ions into and three ions out of the neuron (see Fig. 11-39). The resulting transmembrane potential changes transiently as an electrical signal, an action potential, sweeps from one end of a neuron to the other (see Fig. 12-33). Action potentials are the chief mechanism of information transfer in the nervous system, so depletion of ATP in neurons would have disastrous effects on all activities coordinated by neuronal signaling.
Blood Carries Oxygen, Metabolites, and Hormones
Blood mediates the metabolic interactions among all tissues. It transports nutrients from the small intestine to the liver and from the liver and adipose tissue to other organs; it also transports waste products from extrahepatic tissues to the liver for processing and to the kidneys for excretion. Oxygen moves in the bloodstream from the lungs to the tissues, and generated by tissue respiration returns via the bloodstream to the lungs for exhalation. Blood also carries hormonal signals from one tissue to another. In its role as signal carrier, the circulatory system resembles the nervous system: both regulate and integrate the activities of different organs.
The average adult human has 5 to 6 L of blood. Almost half of this volume is occupied by three types of blood cells (Fig. 23-20): erythrocytes (red cells), filled with hemoglobin and specialized for carrying and ; much smaller numbers of leukocytes (white cells) of several types (including lymphocytes, also found in lymphatic tissue), which are central to the immune system to defend against infections; and platelets (cell fragments), which help to mediate blood clotting. The liquid portion is the blood plasma, which is 90% water and 10% solutes. Dissolved or suspended in the plasma are many proteins, lipoproteins, nutrients, metabolites, waste products, inorganic ions, and hormones. More than 70% of the plasma solids are plasma proteins, primarily immunoglobulins (circulating antibodies), serum albumin, apolipoproteins (for lipid transport), transferrin (for iron transport), and blood-clotting proteins such as fibrinogen and prothrombin.
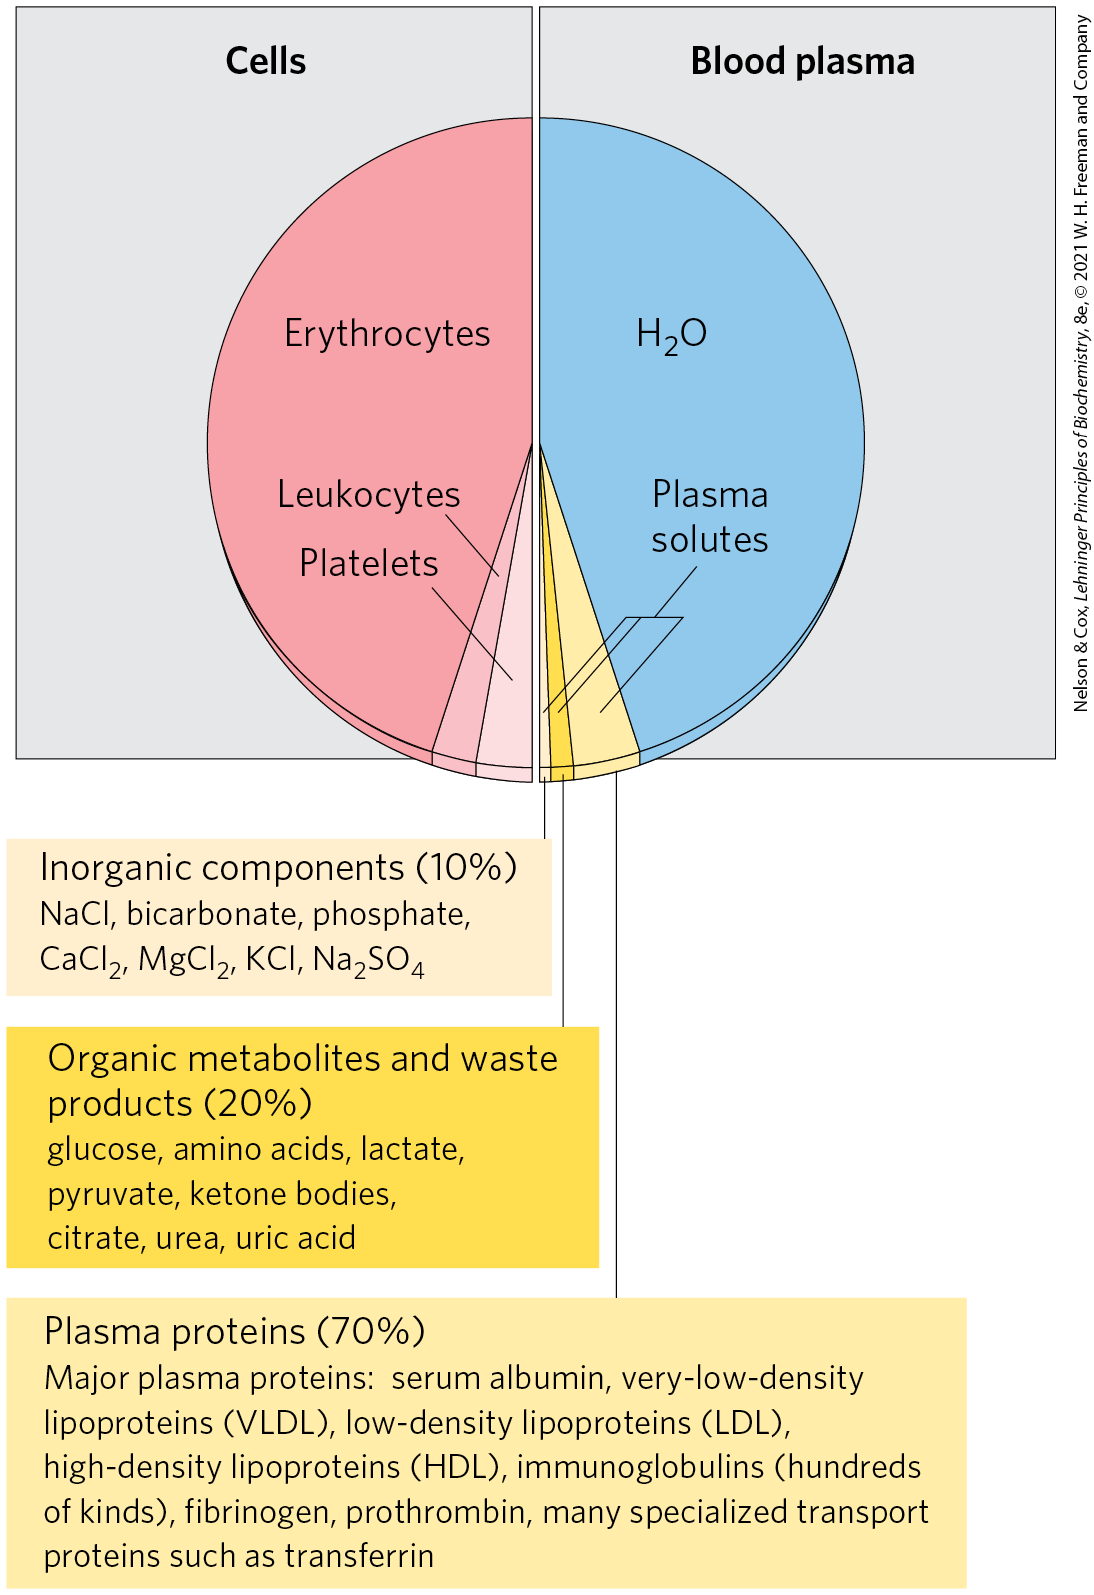
FIGURE 23-20 The composition of blood (by weight). Whole blood can be separated into blood plasma and cells by centrifugation. About 10% of blood plasma is solutes, about 10% of these consisting of inorganic salts, 20% small organic molecules, and 70% plasma proteins. The major dissolved components are listed here. Blood contains many other substances, often in trace amounts. These include other metabolites, enzymes, hormones, vitamins, trace elements, and bile pigments. Measurements of the concentrations of components in blood plasma are important in the diagnosis and treatment of many diseases.
The ions and low molecular weight solutes in blood plasma are not fixed components; they are in constant flux between blood and various tissues. Dietary uptake of the inorganic ions that are the predominant electrolytes of blood and cytosol , , and is, in general, counterbalanced by their excretion in the urine. For many blood components, something near a dynamic steady state is achieved: the concentration of a component changes little, although a continuous flux occurs between the digestive tract, blood, and urine. The plasma levels of , , and remain close to 140, 5, and 2.5 mm, respectively, with little change in response to dietary intake. Any significant departure from these values can result in serious illness or death. The kidneys play an especially important role in maintaining ion balance by selectively filtering waste products and excess ions out of the blood while preventing the loss of essential nutrients and ions.
The human erythrocyte loses its nucleus and mitochondria during differentiation. It therefore relies on glycolysis alone for its supply of ATP. The lactate produced by glycolysis returns to the liver, where gluconeogenesis converts it to glucose, to be stored as glycogen or recirculated to peripheral tissues. The erythrocyte has constant access to glucose in the bloodstream.
The concentration of glucose in plasma is subject to tight regulation. We have noted the constant requirement of the brain for glucose and the role of the liver in maintaining blood glucose in the normal range, 60 to 90 mg/100 mL of whole blood (~4.5 mm). (Because erythrocytes make up a significant fraction of blood volume, their removal by centrifugation leaves a supernatant fluid, the plasma, containing the “blood glucose” in a smaller volume. To convert blood glucose to plasma glucose concentration, multiply the blood glucose level by 1.14.) When blood glucose in a human drops to 70 mg/100 mL (the hypoglycemic condition), the person experiences discomfort and mental confusion (Fig. 23-21); further reductions lead to coma, convulsions, and, in extreme hypoglycemia, death. Maintaining the normal concentration of glucose in blood is therefore a high priority, and a variety of regulatory mechanisms have evolved to achieve that end. Among the most important regulators of blood glucose are the hormones insulin, glucagon, and epinephrine, as discussed in the next section.
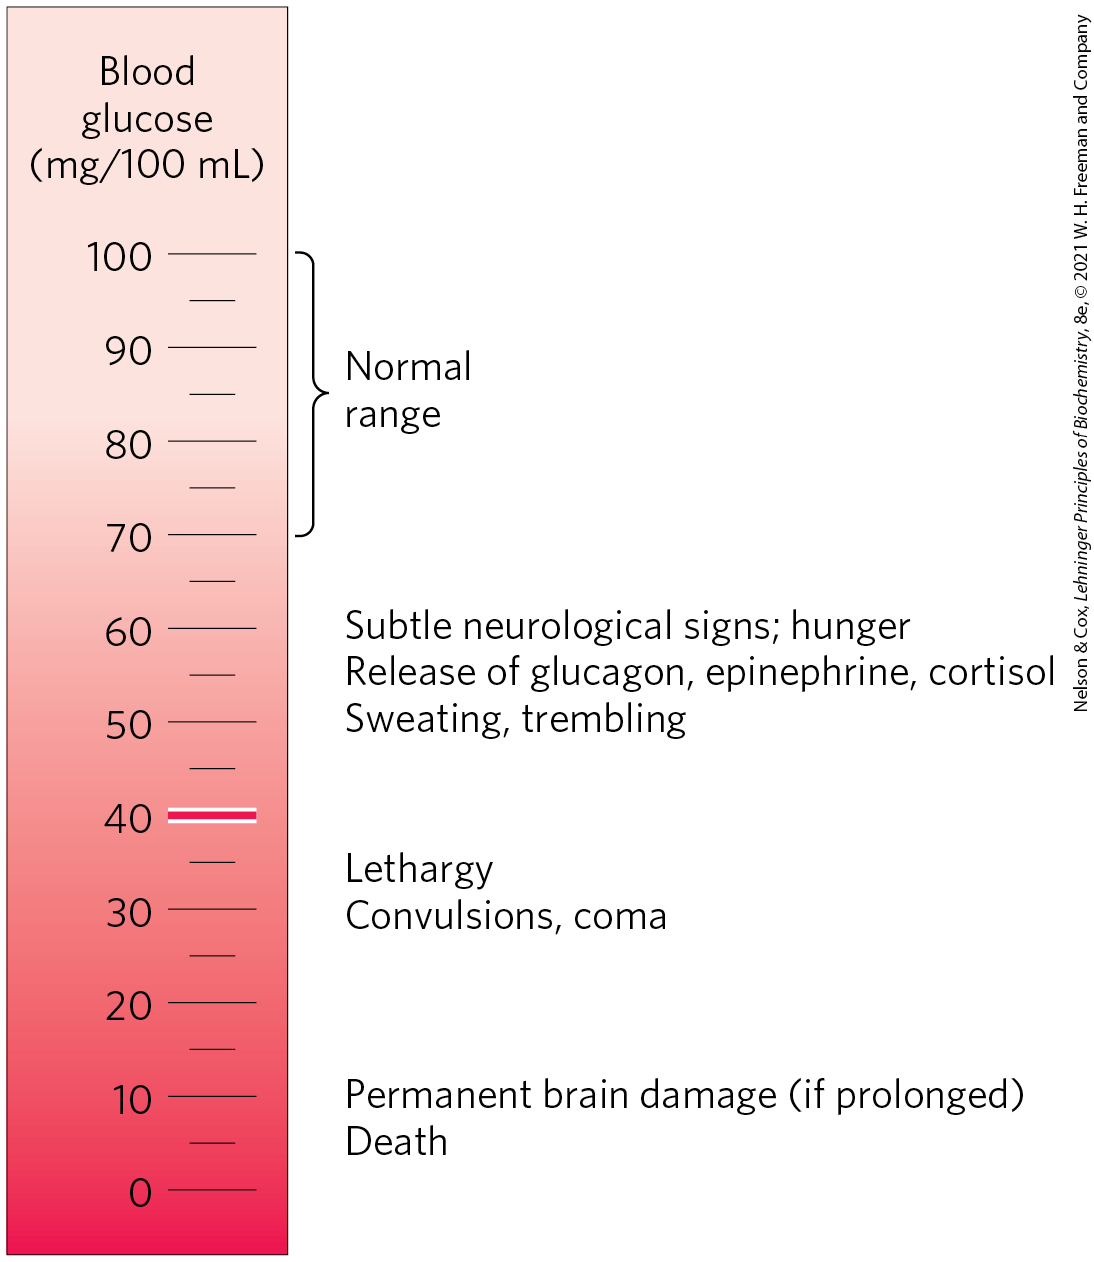
FIGURE 23-21 Physiological effects of low blood glucose in humans. Blood glucose levels of 40 mg/100 mL and below constitute severe hypoglycemia.
SUMMARY 23.2 Tissue-Specific Metabolism
- In mammals there is a division of metabolic labor among specialized tissues and organs. The liver is the central processing and distribution organ for nutrients. Glucose 6-phosphate may be used to synthesize glycogen or fatty acids, or it may be sent into the citric acid cycle to produce ATP, or into the pentose phosphate pathway to yield NADPH and pentoses. Amino acids are used to synthesize liver and plasma proteins, or their carbon skeletons are converted to glucose and glycogen by gluconeogenesis; the ammonia formed by deamination is converted to urea. Fatty acids in the liver may undergo β oxidation, or be converted to triglycerides, phospholipids or cholesterol, or be converted into ketone bodies.
- White adipose tissue stores large reserves of triacylglycerol molecules and releases them into the blood in response to epinephrine or glucagon. Brown and beige adipose tissue are specialized for thermogenesis, the result of fatty acid oxidation in uncoupled mitochondria.
- Skeletal muscle is specialized to produce and use ATP for mechanical work, oxidizing fatty acids and glucose during low to moderate muscular activity. During strenuous muscular activity, glycogen is the ultimate fuel, supplying ATP through glycolysis and fermentation to lactate. Phosphocreatine directly replenishes ATP during active contraction. Heart muscle obtains nearly all its ATP from oxidative phosphorylation, with fatty acids as the primary fuel.
- The neurons of the brain use only glucose and β-hydroxybutyrate as fuels, the latter being important during fasting or starvation. The brain uses most of its ATP for the active transport of and to maintain the electrical potential across the neuronal membrane.
- The blood transfers nutrients, oxygen, waste products, and hormonal signals among tissues and organs. It is made up of cells (erythrocytes, leukocytes, and platelets) and electrolyte-rich water (plasma) containing many dissolved proteins.
 In mammals there is a division of metabolic labor among specialized tissues and organs. The liver is the central processing and distribution organ for nutrients. Glucose 6-phosphate may be used to synthesize glycogen or fatty acids, or it may be sent into the citric acid cycle to produce ATP, or into the pentose phosphate pathway to yield NADPH and pentoses. Amino acids are used to synthesize liver and plasma proteins, or their carbon skeletons are converted to glucose and glycogen by gluconeogenesis; the ammonia formed by deamination is converted to urea. Fatty acids in the liver may undergo β oxidation, or be converted to triglycerides, phospholipids or cholesterol, or be converted into ketone bodies.