11.3 Solute Transport across Membranes
Every living cell must acquire from its surroundings the raw materials for biosynthesis and for energy production, and must release the byproducts of metabolism to its environment; both processes require that small compounds or inorganic ions cross the plasma membrane. Within the eukaryotic cell, different compartments have different concentrations of ions and of metabolic intermediates and products, and these, too, must move across intracellular membranes in tightly regulated processes. A few nonpolar compounds can dissolve in the lipid bilayer and cross a membrane unassisted, but for any polar compound or ion, a specific membrane protein carrier is essential. Approximately 2,000 genes in the human genome encode proteins that function in transporting solutes across membranes. In some cases, a membrane protein simply facilitates the diffusion of a solute down its concentration gradient; but transport can also occur against a gradient of concentration, electrical potential, or both, and in these cases, as we shall see, the transport process requires energy. Ions may also diffuse across membranes via ion channels formed by proteins, or they may be carried across by ionophores, small molecules that mask the charge of ions and allow them to diffuse through the lipid bilayer. Figure 11-27 summarizes the various types of transport mechanisms discussed in this section.
 A few nonpolar compounds can dissolve in the lipid bilayer and cross a membrane unassisted, but for any polar compound or ion, a specific membrane protein carrier is essential. Approximately 2,000 genes in the human genome encode proteins that function in transporting solutes across membranes. In some cases, a membrane protein simply facilitates the diffusion of a solute down its concentration gradient; but transport can also occur against a gradient of concentration, electrical potential, or both, and in these cases, as we shall see, the transport process requires energy. Ions may also diffuse across membranes via ion channels formed by proteins, or they may be carried across by ionophores, small molecules that mask the charge of ions and allow them to diffuse through the lipid bilayer.
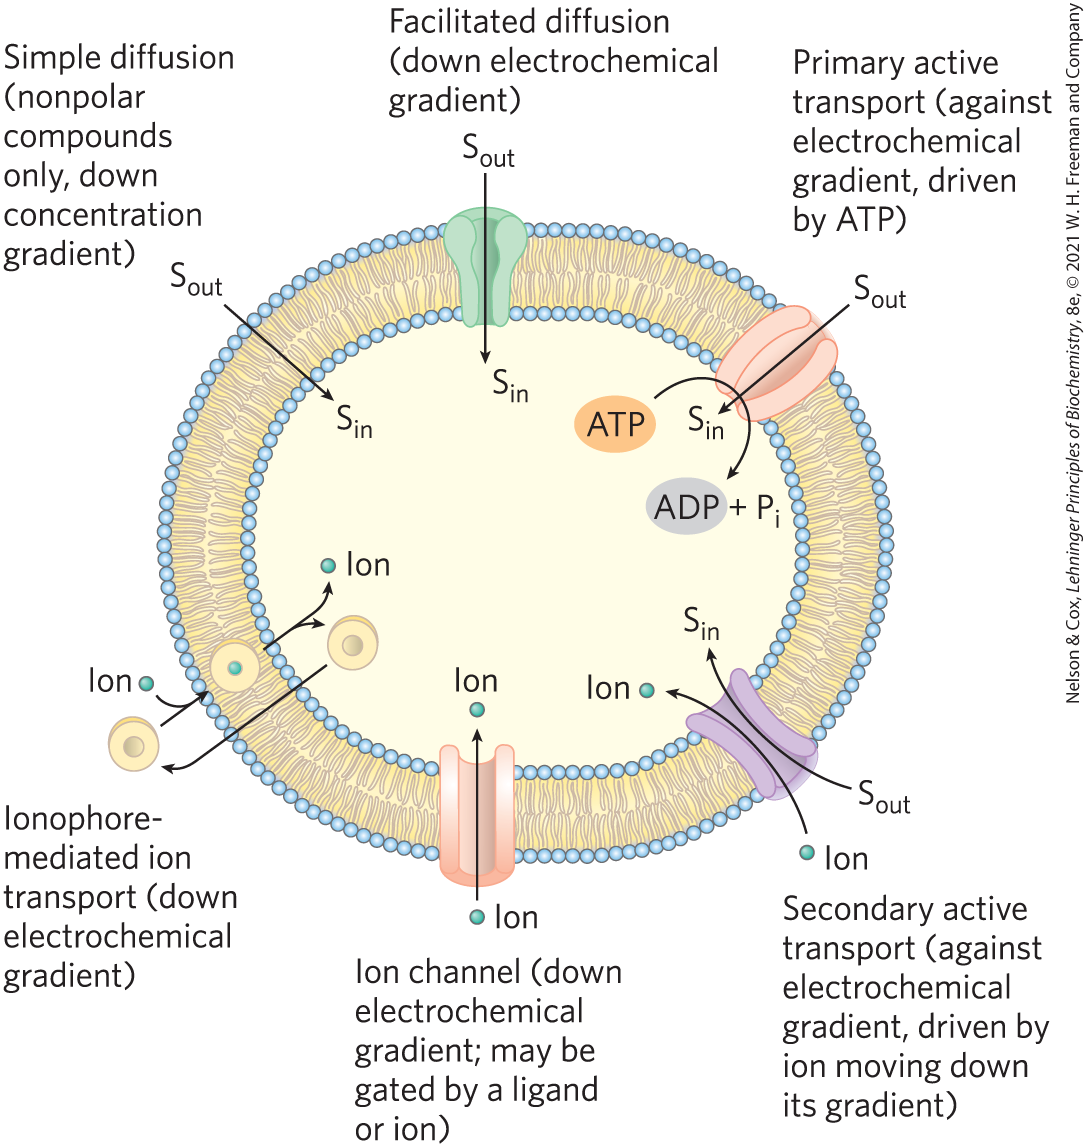
FIGURE 11-27 Summary of transporter types. Some types (ionophores, ion channels, and passive transporters) simply speed transmembrane movement of solutes (S) down their electrochemical gradients, whereas others (active transporters) can pump solutes against a gradient, using ATP or a gradient of a second solute to provide the energy.
Transport May Be Passive or Active
When two aqueous compartments containing unequal concentrations of a soluble compound or ion are separated by a permeable divider (membrane), the solute moves by simple diffusion from the region of higher concentration, through the membrane, to the region of lower concentration, until the two compartments have equal solute concentrations (Fig. 11-28a). When ions of opposite charge are separated by a permeable membrane, there is a transmembrane electrical gradient, a membrane potential, (expressed in millivolts). This membrane potential produces a force opposing ion movements that increase and driving ion movements that reduce (Fig. 11-28b). Thus, the direction in which a charged solute tends to move spontaneously across a membrane depends on both the chemical gradient (the difference in solute concentration) and the electrical gradient across the membrane. Together these two factors are referred to as the electrochemical gradient or electrochemical potential. This behavior of solutes is in accord with the second law of thermodynamics: molecules tend to spontaneously assume the distribution of greatest randomness and lowest energy.
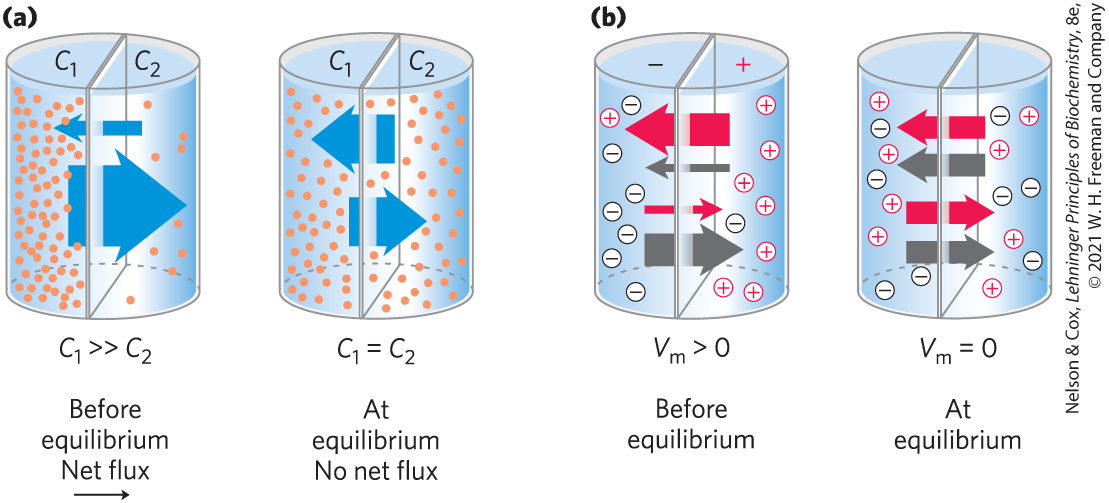
FIGURE 11-28 Movement of solutes across a permeable membrane. (a) Net movement of an electrically neutral solute is toward the side of lower solute concentration until equilibrium is achieved. The solute concentrations on the left and right sides of the membrane, as shown here, are designated and . The rate of transmembrane solute movement (indicated by the arrows) is proportional to the concentration ratio. (b) Net movement of an electrically charged solute is dictated by a combination of the electrical potential and the ratio of chemical concentrations across the membrane; net ion movement continues until this electrochemical potential reaches zero.
Membrane proteins that act by increasing the rate of solute movement across membranes are called transporters or carriers. Transporters are of two general types: passive and active. Passive transporters simply facilitate movement down a concentration gradient, increasing the transport rate. This process is called passive transport or facilitated diffusion. Active transporters (sometimes called pumps) can move substrates across a membrane against a concentration gradient or an electrical potential, a process called active transport. Primary active transporters use energy provided directly by a chemical reaction; secondary active transporters couple uphill transport of one substrate with downhill transport of another.
Transporters and Ion Channels Share Some Structural Properties but Have Different Mechanisms
To pass through a lipid bilayer, a polar or charged solute must first give up its interactions with the water molecules in its hydration shell, then diffuse about 3 nm (30 Å) through a substance (lipid) in which it is poorly soluble (Fig. 11-29a). The energy used to strip away the hydration shell and to move the polar compound from water into lipid, then through the lipid bilayer, is regained as the compound leaves the membrane on the other side and is rehydrated. However, the intermediate stage of transmembrane passage is a high-energy state comparable to the transition state in an enzyme-catalyzed chemical reaction. In both cases, an activation barrier must be overcome to reach the intermediate stage (Fig. 11-29; compare with Fig. 6-3). The energy of activation for translocation of a polar solute across the bilayer is so large that pure lipid bilayers are virtually impermeable to polar and charged species on time scales relevant to cell growth and division.
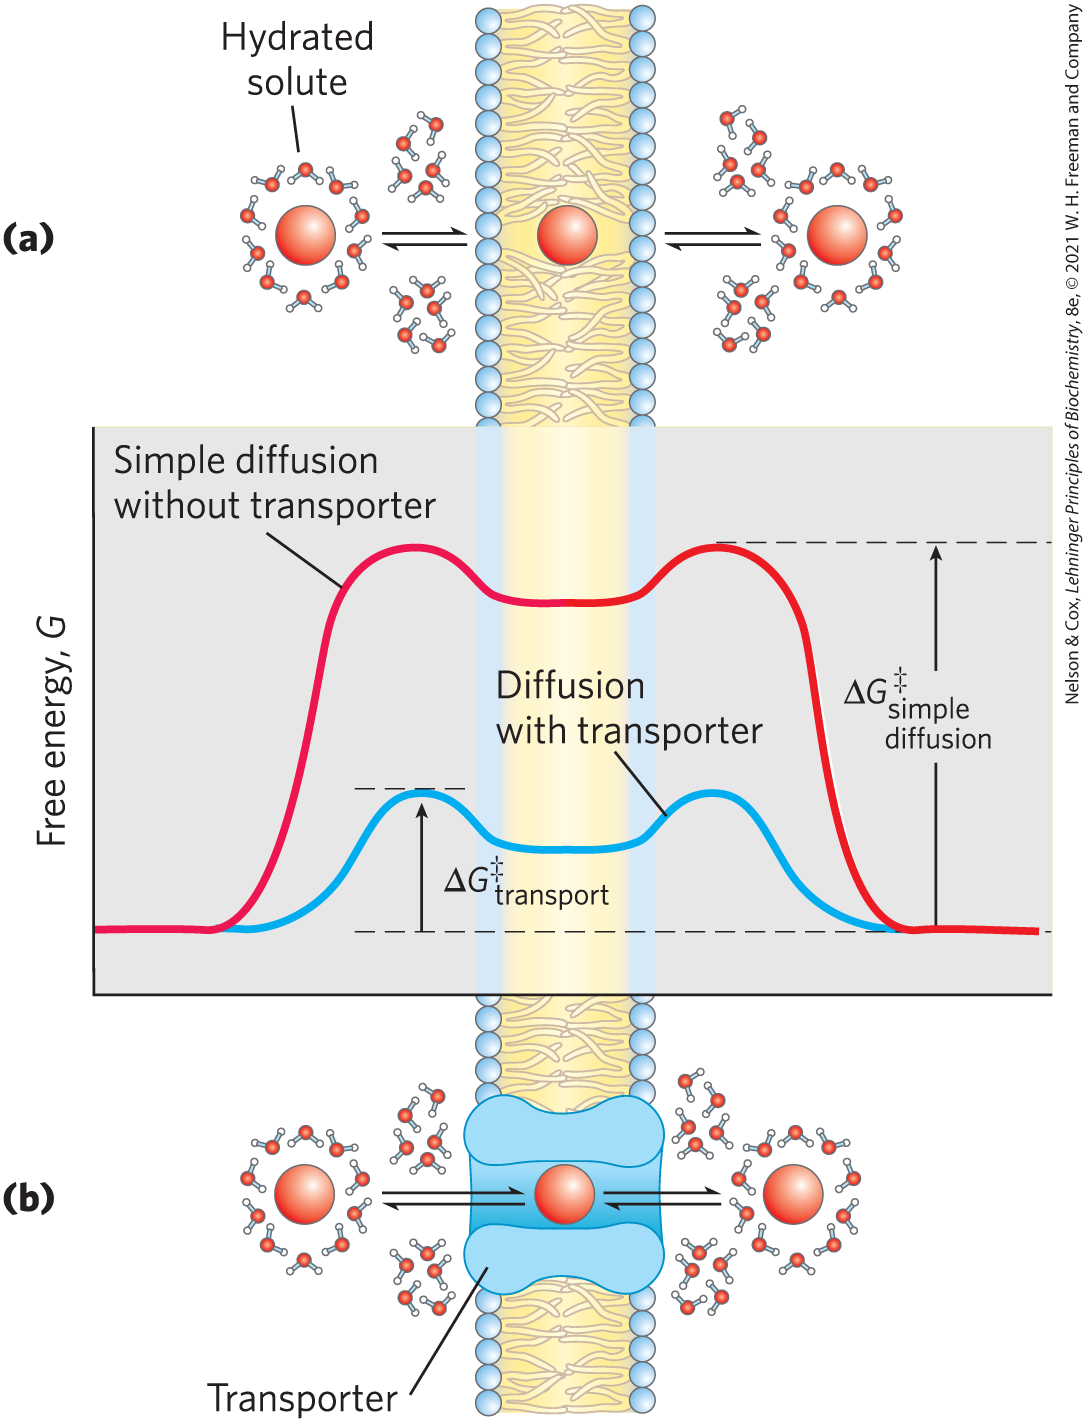
FIGURE 11-29 Energy changes accompanying passage of a hydrophilic solute through the lipid bilayer of a biological membrane. (a) In simple diffusion, removal of the hydration shell is highly endergonic, and the energy of activation for diffusion through the bilayer is very high. (b) A transporter protein reduces the for transmembrane diffusion of the solute. It does this by forming noncovalent interactions with the dehydrated solute to replace the hydrogen bonding with water and by providing a hydrophilic transmembrane pathway.
Membrane proteins lower the activation energy for transport of polar compounds and ions by providing an alternative path across the membrane for specific solutes. Lowering the activation energy greatly increases the rate of transmembrane movement (recall p. 182). Transporters are not enzymes in the usual sense; their “substrates” are moved from one compartment to another but are not chemically altered. Like enzymes, however, transporters bind their substrates with stereochemical specificity through multiple weak, noncovalent interactions. The negative free-energy change associated with these weak interactions, , counterbalances the positive free-energy change that accompanies loss of the water of hydration from the substrate, , thereby lowering for transmembrane passage (Fig. 11-29b). Transporter proteins span the lipid bilayer several times, forming a transmembrane pathway lined with hydrophilic amino acid side chains. The pathway provides an alternative route for a specific substrate to move across the lipid bilayer without its having to dissolve in the bilayer, further lowering for transmembrane diffusion. The result is an orders-of-magnitude increase in the substrate’s rate of passage across the membrane.
Ion channels use a different mechanism than transporters to move inorganic ions across membranes. Ion channels speed the passage of ions across membranes by providing an aqueous path across the membrane through which inorganic ions can diffuse at very high rates. Most ion channels have a “gate” (Fig. 11-30a) regulated by a biological signal. When the gate is open, ions move across the membrane, through the channel, in the direction dictated by the ion’s charge and the electrochemical gradient. Movement occurs at rates approaching the limit of unhindered diffusion (tens of millions of ions per second per channel — much higher than typical transporter rates). Ion channels typically show some specificity for an ion, but they are not saturable with their ion substrate. Flow through a channel stops either when the gating mechanism is closed (again, by a biological signal) or when there is no longer an electrochemical gradient providing the driving force for the movement. In contrast, transporters, which bind their “substrates” with high stereospecificity, catalyze transport at rates well below the limits of free diffusion, and they are saturable in the same sense as are enzymes: there is some substrate concentration above which further increases will not produce a greater rate of transport. Transporters have a gate on either side of the membrane, and the two gates are never open at the same time (Fig. 11-30b).
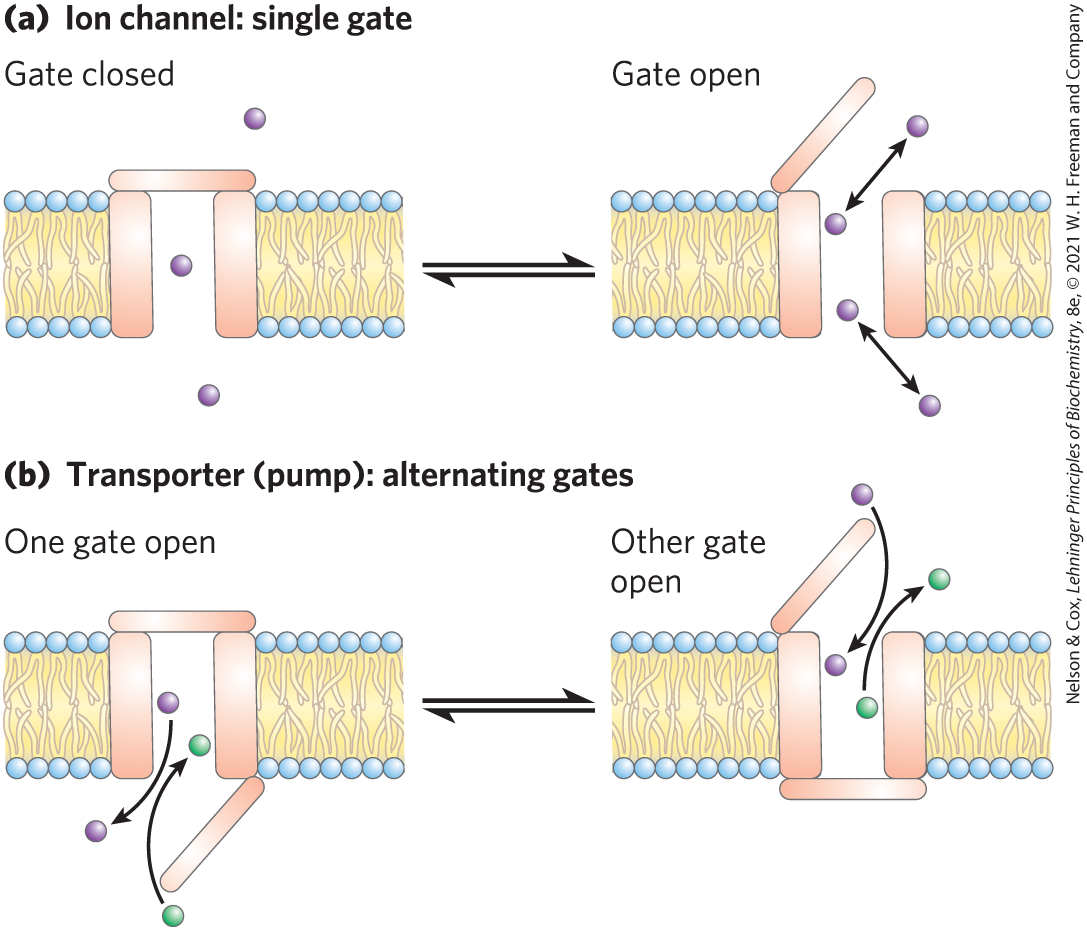
FIGURE 11-30 Differences between channels and transporters. (a) Ion channels have a transmembrane pore that is either open or closed, depending on the position of the single gate. When the gate is open, ions move through at a rate limited only by the maximum rate of diffusion. (b) Transporters have two gates, and both are never open at the same time. Movement of a substrate (an ion or a small molecule) through the membrane is therefore limited by the time needed for one gate to open and close (on one side of the membrane) and the second gate to open. Rates of movement through ion channels can be orders of magnitude greater than rates through transporters, but channels simply allow the ion to flow down the electrochemical gradient, whereas active transporters (pumps) can move a substrate against its concentration gradient. [Information from D. C. Gadsby, Nat. Rev. Mol. Cell Biol. 10:344, 2009, Fig. 1.]
Both transporters and ion channels constitute large families of proteins, defined not only by their primary sequences but also by their secondary structures. We next consider some well-studied representatives of the main transporter and channel families. You will also encounter some of these in Chapter 12 when we discuss transmembrane signaling, and some in later chapters in the context of the metabolic pathways in which they participate.
The Glucose Transporter of Erythrocytes Mediates Passive Transport
Energy-yielding metabolism in erythrocytes depends on a constant supply of glucose from the blood plasma, where the glucose concentration is maintained at about 4.5 to 5 mm. Glucose enters the erythrocyte by passive transport via a specific glucose transporter called GLUT1, at a rate about 50,000 times greater than it could cross the membrane unassisted.
The process of glucose transport can be described by analogy with an enzymatic reaction in which the “substrate” is glucose outside the cell , the “product” is glucose inside the cell , and the “enzyme” is the transporter, T. When the initial rate of glucose uptake is measured as a function of external glucose concentration (Fig. 11-31), the resulting plot is hyperbolic: at high external glucose concentrations, the rate of uptake approaches . Formally, such a transport process can be described by the set of equations
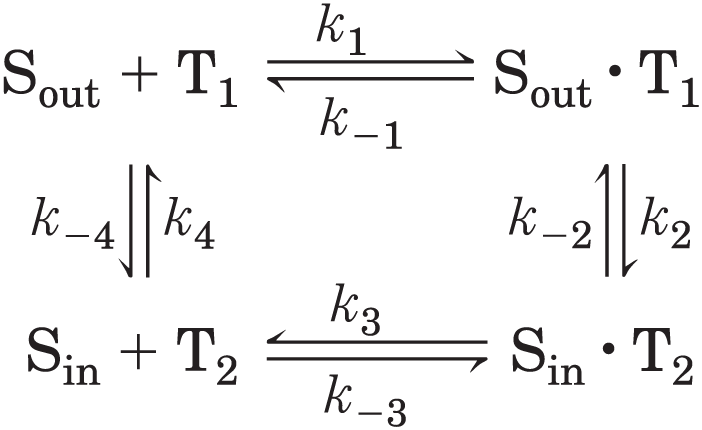
in which , and so forth are the forward and reverse rate constants for each step; is the transporter conformation in which the glucose-binding site faces outward (in contact with blood plasma), and is the conformation in which it faces inward. Given that every step in this sequence is reversible, the transporter is, in principle, equally able to move glucose into or out of the cell. As for enzyme assays, this transporter assay measures the initial rate of uptake, when the product concentration (glucose concentration inside the cell) is zero, while the substrate concentration (glucose on the outside) is varied. In the living cell, GLUT1 accelerates the movement of glucose down its concentration gradient, which normally means into the cell. Glucose that enters a cell is generally metabolized immediately, and the intracellular glucose concentration is thereby kept low relative to its concentration in the blood.
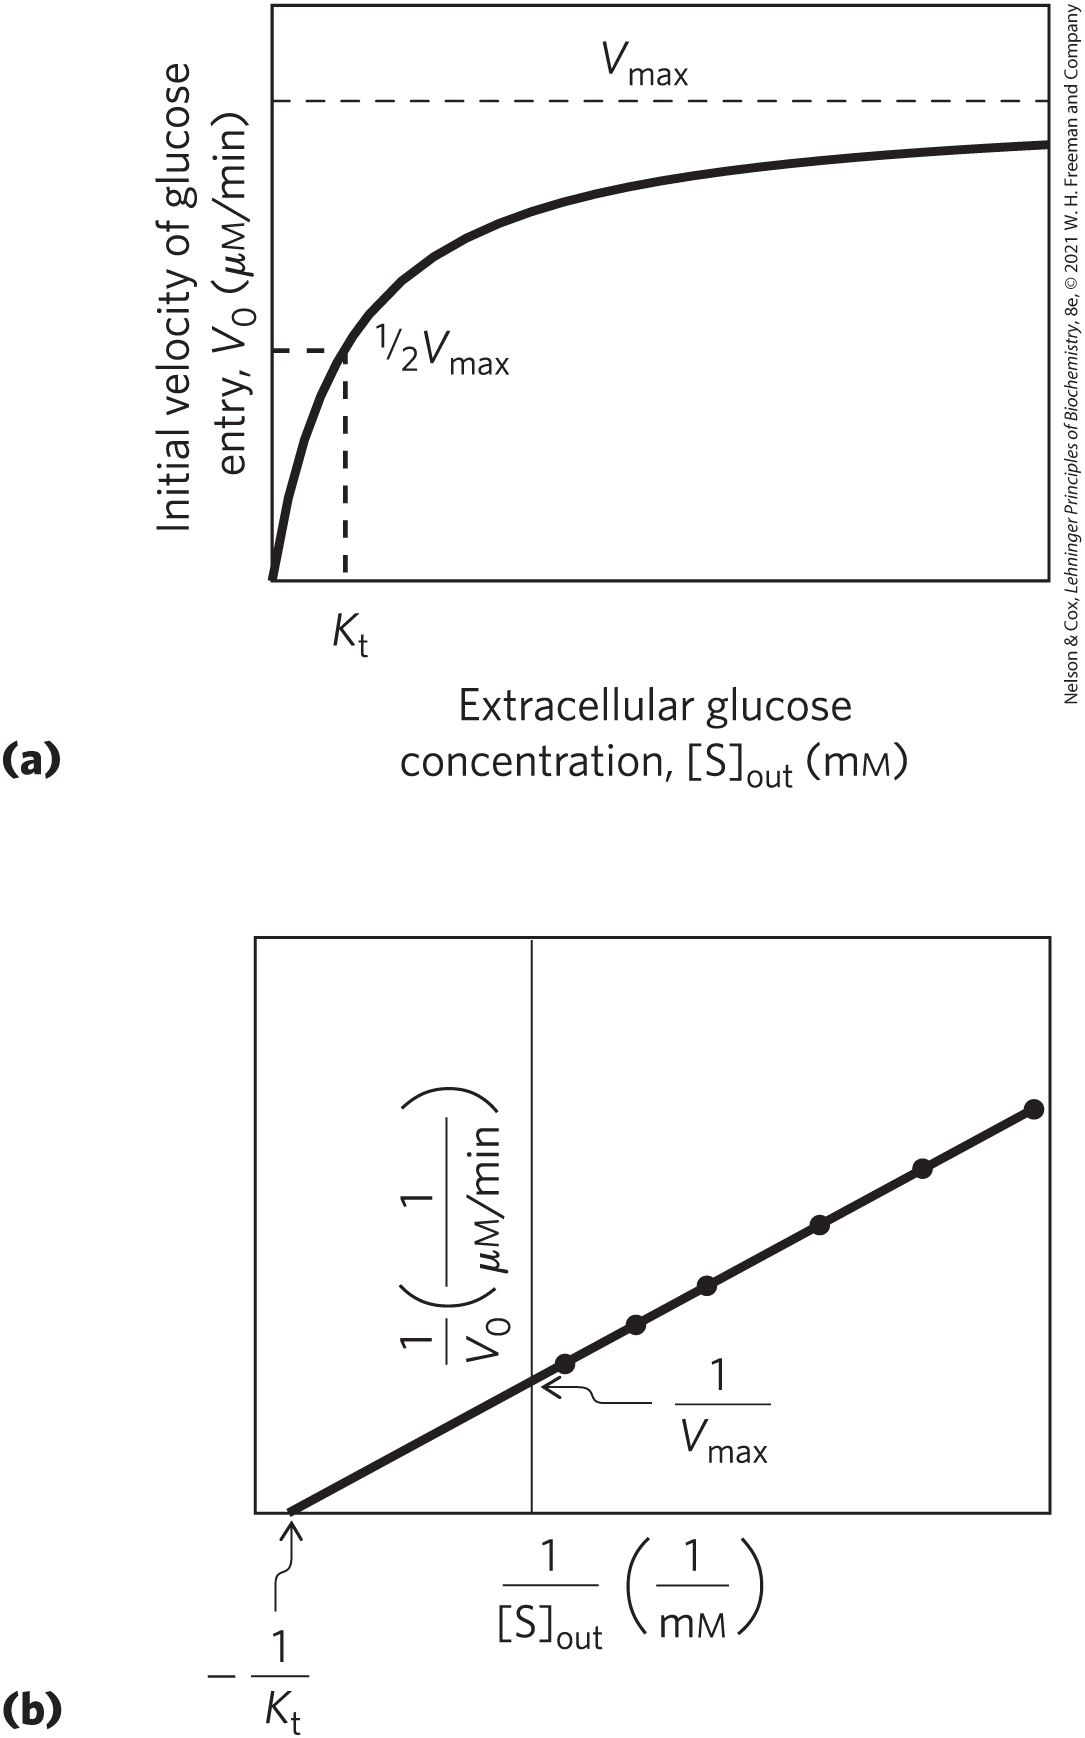
FIGURE 11-31 Kinetics of glucose transport into erythrocytes. (a) The initial rate of glucose entry into an erythrocyte, , depends on the initial concentration of glucose on the outside, . (b) Double-reciprocal plot of the data in (a). The kinetics of passive transport is analogous to the kinetics of an enzyme-catalyzed reaction. (Compare these plots with Fig. 6-12 and 6-14.) is analogous to , the Michaelis constant.
The rate equations for glucose transport can be derived exactly as for enzyme-catalyzed reactions (Chapter 6), yielding an expression analogous to the Michaelis-Menten equation
(11-1)
in which is the initial velocity of accumulation of glucose inside the cell when its concentration in the surrounding medium is , and is a constant analogous to the Michaelis constant, a combination of rate constants that is characteristic of each transport system. This equation describes the initial velocity, the rate observed when . As is the case for enzyme-catalyzed reactions, the slope-intercept form of the equation describes a linear plot of against , from which we can obtain values of and (Fig. 11-31b). When , the rate of uptake is ; the transport process is half-saturated. The concentration of glucose in blood, as noted above, is 4.5 to 5 mm, which is close enough to the to ensure that GLUT1 is half-saturated with substrate and operates near one-half .
Because no chemical bonds are made or broken in the conversion of to , neither “substrate” nor “product” is intrinsically more stable, and the process of entry is therefore fully reversible. As approaches , the rates of entry and exit become equal. Such a system is therefore incapable of accumulating glucose within a cell at concentrations above that in the surrounding medium; it simply equilibrates glucose on the two sides of the membrane much faster than would occur in the absence of a specific transporter. GLUT1 is specific for d-glucose, with a of about 6 mm. For the close analogs d-mannose and d-galactose, which differ only in the position of one hydroxyl group, the values of are 20 mm and 30 mm, respectively, and for l-glucose, exceeds 3,000 mm. Thus, GLUT1 shows the three hallmarks of passive transport: high rates of diffusion down a concentration gradient, saturability, and stereospecificity.
GLUT1 is an integral protein with 12 hydrophobic segments, each forming a membrane-spanning helix (Fig. 11-32a). The helices that line the transmembrane path for glucose are amphipathic; for each helix, the residues along one side are predominantly nonpolar, and those on the other side are mainly polar. This amphipathic structure is evident in a helical wheel diagram (Fig. 11-32b). A cluster of amphipathic helices are arranged so that their polar sides face each other and line a hydrophilic pore through which glucose can pass (Fig. 11-32c), while their hydrophobic sides interact with the surrounding membrane lipids such that the hydrophobic effect stabilizes the entire transporter structure.
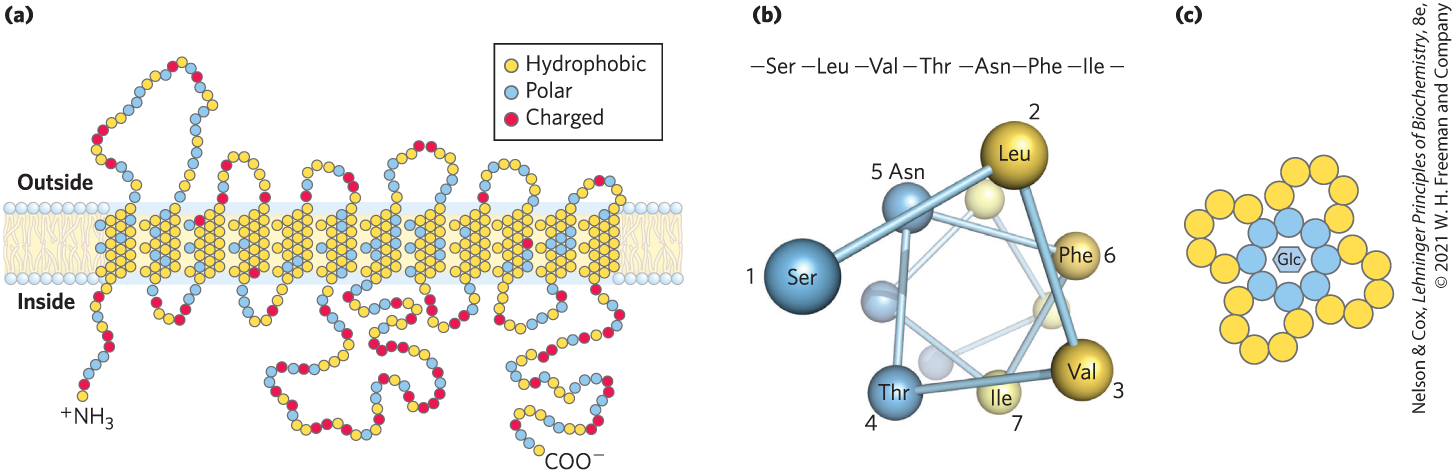
FIGURE 11-32 Membrane topology of the glucose transporter GLUT1. (a) Transmembrane helices are represented here as oblique (angled) rows of three or four amino acid residues, each row depicting one turn of the α helix. Of the 12 helices, 9 contain three or more polar or charged residues (blue or red), often separated by several hydrophobic residues (yellow). (b) A helical wheel diagram shows the distribution of polar and nonpolar residues on the surface of a helical segment. The helix is diagrammed as though observed along its axis from the amino terminus. Adjacent residues in the linear sequence are connected, and each residue is placed around the wheel in the position it occupies in the helix; recall that 3.6 residues are required to make one complete turn of the α helix. In this example, the polar residues (blue) are on one side of the helix, and the hydrophobic residues (yellow) are on the other. This is, by definition, an amphipathic helix. (c) Side-by-side association of amphipathic helices, each with its polar face oriented toward the central cavity, produces a transmembrane channel lined with polar (and charged) residues, available for interaction with glucose. [Information from (a, c) M. Mueckler, Eur. J. Biochem. 219:713, 1994.]
Structural studies of mammalian GLUT1 and other GLUT transporters suggest that the protein cycles through a series of conformational changes, interconverting a form with its glucose-binding site accessible only from the extracellular side, through a form in which the bound glucose is sequestered and inaccessible from either side, to a form with the glucose-binding site open only to the intracellular side (Fig. 11-33).
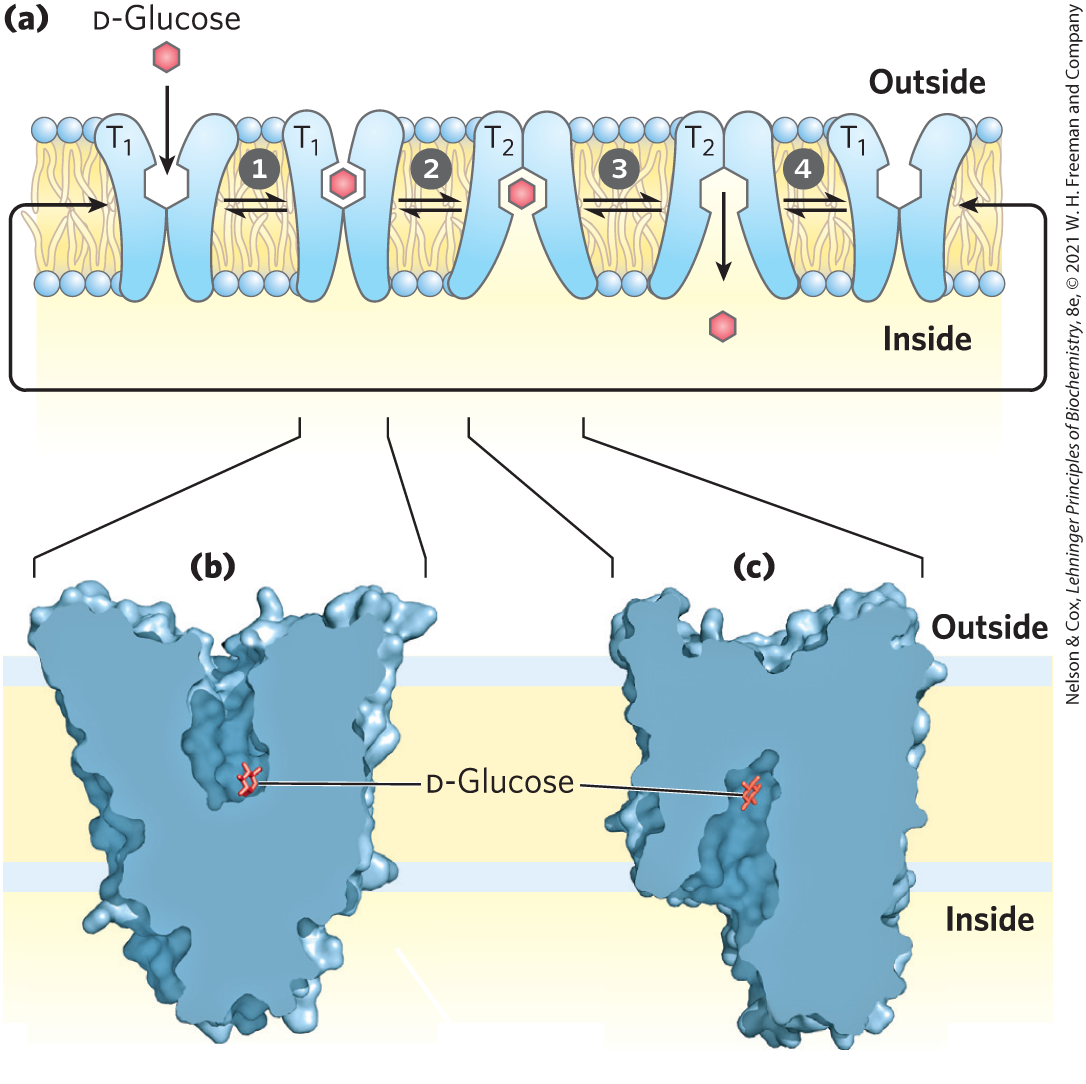
FIGURE 11-33 Model of glucose transport into erythrocytes by GLUT1. (a) The transporter exists in two extreme conformations: , with the glucose-binding site exposed on the outer surface of the plasma membrane, and , with the binding site exposed on the inner surface. Glucose transport occurs in four steps. Glucose in blood plasma binds to a stereospecific site on ; this lowers the activation energy for a conformational change from • to • , effecting transmembrane passage of the glucose. Glucose is released from into the cytoplasm, and the transporter returns to the conformation, ready to transport another glucose molecule. Between the forms and , there is an intermediate form (not shown here) in which glucose is sequestered within the transporter, with access to neither side. The structures of (b) human GLUT3 in the conformation and (c) human GLUT1 in the conformation, determined by x-ray crystallography, support the model shown in (a). [Data from (b) PDB ID 4ZWC, D. Deng et al., Nature 526:391, 2015; (c) PDB ID 4PYP, D. Deng et al., Nature 510:121, 2014.]
 Glucose in blood plasma binds to a stereospecific site on ; this lowers the activation energy for
  a conformational change from • to • , effecting transmembrane passage of the glucose.
  Glucose is released from into the cytoplasm, and
  the transporter returns to the conformation, ready to transport another glucose molecule. Between the forms and , there is an intermediate form (not shown here) in which glucose is sequestered within the transporter, with access to neither side. The structures of (b) human GLUT3 in the conformation and (c) human GLUT1 in the conformation, determined by x-ray crystallography, support the model shown in (a). [Data from (b) PDB ID 4ZWC, D. Deng et al., Nature 526:391, 2015; (c) PDB ID 4PYP, D. Deng et al., Nature 510:121, 2014.]
Twelve passive glucose transporters are encoded in the human genome, each with its unique kinetic properties, patterns of tissue distribution, and function (Table 11-1). GLUT1, in addition to supplying glucose to erythrocytes, also transports glucose across the blood-brain barrier, supplying the glucose that is essential for normal brain metabolism. The very rare individuals with defects in GLUT1 have a variety of brain-related symptoms, including seizures, movement and language disorders, and developmental delays. Standard care for such individuals includes a ketogenic diet, which provides the ketones that can serve as an alternative energy source for the brain. In the liver, GLUT2 transports glucose out of hepatocytes when liver glycogen is broken down to replenish blood glucose. GLUT2 has a large and can therefore respond to increased levels of intracellular glucose (produced by glycogen breakdown) by increasing outward transport. Skeletal and heart muscle and adipose tissue have yet another glucose transporter, GLUT4 , which is distinguished by its response to insulin: its activity increases when insulin signals a high blood glucose concentration, thus increasing the rate of glucose uptake into muscle and adipose tissue. Box 11-1 describes the effect of insulin on this transporter.
 Twelve passive glucose transporters are encoded in the human genome, each with its unique kinetic properties, patterns of tissue distribution, and function (
| Transporter | Tissue(s) where expressed | Role/characteristicsa | |
|---|---|---|---|
| GLUT1 | Erythrocytes, blood-brain barrier, placenta, most tissues at a low level | 3 | Basal glucose uptake; defective in De Vivo disease |
| GLUT2 | Liver, pancreatic islets, intestine, kidney | 17 | In liver and kidney, removal of excess glucose from blood; in pancreas, regulation of insulin release |
| GLUT3 | Brain (neuron), testis (sperm) | 1.4 | Basal glucose uptake; high turnover number |
| GLUT4 | Muscle, fat, heart | 5 | Activity increased by insulin |
| GLUT5 | Intestine (primarily), testis, kidney | 6b | Primarily fructose transport |
| GLUT6 | Spleen, leukocytes, brain | > 5 | Possibly no transporter function |
| GLUT7 | Small intestine, colon, testis, prostate | 0.3 | — |
| GLUT8 | Testis, sperm acrosome | ~2 | — |
| GLUT9 | Liver, kidney, intestine, lung, placenta | 0.6 | Urate and glucose transporter in liver, kidney |
| GLUT10 | Heart, lung, brain, liver, muscle, pancreas, placenta, kidney | 0.3c | Glucose and galactose transporter |
| GLUT11 | Heart, skeletal muscle | 0.16 | Glucose and fructose transporter |
| GLUT12 | Skeletal muscle, heart, prostate, placenta | — | — |
|
Information on localization from M. Mueckler and B. Thorens, Mol. Aspects Med. 34:121, 2013. values for glucose from R. Augustin, IUBMB Life 62:315, 2010. aDash indicates role uncertain. b for fructose. c for 2-deoxyglucose. |
|||
The Chloride-Bicarbonate Exchanger Catalyzes Electroneutral Cotransport of Anions across the Plasma Membrane
The erythrocyte contains another passive transport system, an anion exchanger that is essential in transport to the lungs from tissues such as skeletal muscle and liver. Waste released from respiring tissues into the blood plasma enters the erythrocyte, where it is converted to bicarbonate by the enzyme carbonic anhydrase. (Recall that is the primary buffer of blood pH; see Fig. 2-20.) The reenters the blood plasma for transport to the lungs (Fig. 11-34). Because is much more soluble in blood plasma than is , this roundabout route increases the capacity of the blood to carry carbon dioxide from the tissues to the lungs. In the lungs, reenters the erythrocyte and is converted to , which is eventually released into the lung space and exhaled. To be effective, this shuttle requires very rapid movement of across the erythrocyte membrane. As described in Chapter 5 (pp. 160–161), there is a second mechanism for moving from tissue to lung, involving reversible binding of to hemoglobin.)
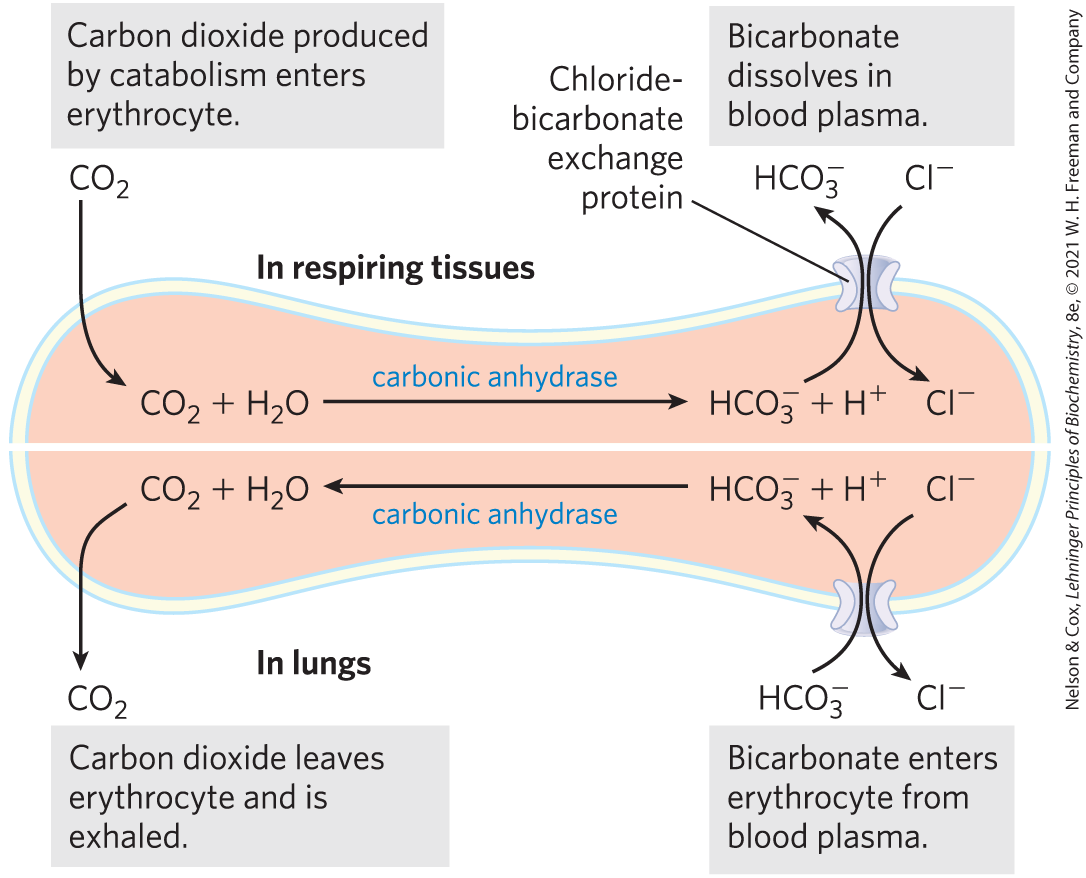
FIGURE 11-34 Chloride-bicarbonate exchanger of the erythrocyte membrane. This cotransport system allows the entry and exit of without changing the membrane potential. Its role is to increase the -carrying capacity of the blood. The top half of the figure illustrates the events that take place in respiring tissues; the bottom half illustrates the events in the lungs.
The chloride-bicarbonate exchanger, also called the anion exchange (AE) protein, increases the rate of transport across the erythrocyte membrane more than a millionfold. Like the glucose transporter, it is a dimeric integral protein that spans the membrane 14 times. This protein mediates the simultaneous movement of two anions: for every ion that moves in one direction, one ion moves in the opposite direction, with no net transfer of charge: the exchange is electroneutral. The coupling of and movements is obligatory; in the absence of chloride, bicarbonate transport stops. In this respect, the anion exchanger is typical of those systems, called cotransport systems, that simultaneously carry two solutes across a membrane (Fig. 11-35). When, as in this case, the two substrates move in opposite directions, the process is antiport. In symport, two substrates are moved simultaneously in the same direction. Transporters that carry only one substrate, such as the erythrocyte glucose transporter, are known as uniport systems.
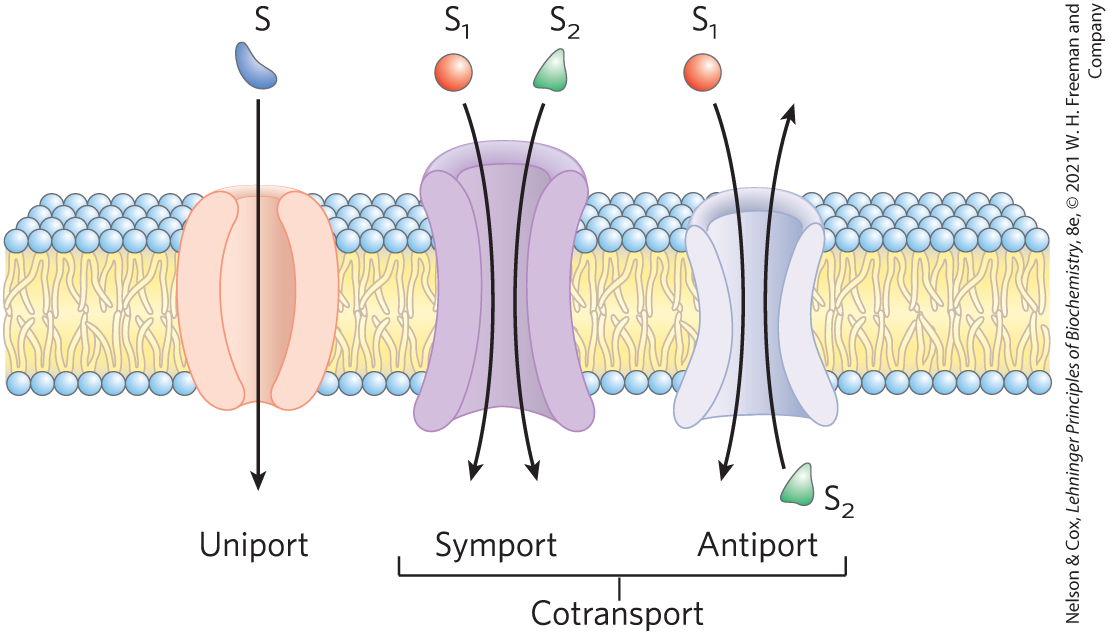
FIGURE 11-35 Three general classes of transport systems. Transporters differ in the number of solutes (substrates) transported and the direction in which each solute moves. Examples of all three types of transporter are discussed in the text. Note that this classification tells us nothing about whether these are energy-requiring (active transport) or energy-independent (passive transport) processes.
Active Transport Results in Solute Movement against a Concentration or Electrochemical Gradient
In passive transport, the transported species always moves down its electrochemical gradient and is not accumulated above the equilibrium concentration. Active transport, by contrast, results in the accumulation of a solute above the equilibrium point. Active transport is essential when cells function in an environment in which key substrates are present outside the cell only at very low concentrations. For example, the bacterium E. coli can grow in a medium containing only 1 μm (inorganic phosphate), but the cell must maintain internal levels in the millimolar range. Worked Example 11-2 describes another such situation, which requires cells to pump outward across the plasma membrane. Active transport is thermodynamically unfavorable (endergonic) and takes place only when coupled, directly or indirectly, to an exergonic process such as the absorption of sunlight, an oxidation reaction, the breakdown of ATP, or the concomitant flow of some other chemical species down its electrochemical gradient. In primary active transport, solute accumulation is coupled directly to an exergonic chemical reaction, such as conversion of ATP to (Fig. 11-36). Secondary active transport occurs when endergonic (uphill) transport of one solute is coupled to the exergonic (downhill) flow of a different solute that was originally pumped uphill by primary active transport.
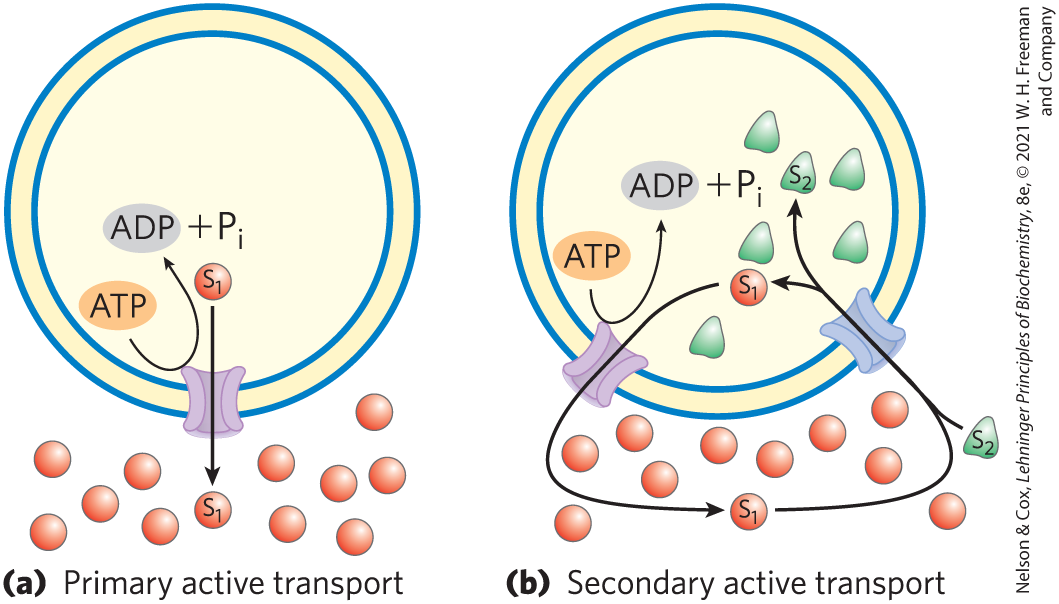
FIGURE 11-36 Two types of active transport. (a) In primary active transport, the energy released by ATP hydrolysis drives solute movement against an electrochemical gradient. (b) In secondary active transport, a gradient of an ion (designated ; often ) has been established by primary active transport. Movement of down its electrochemical gradient now provides the energy to drive cotransport of a second solute, , against its electrochemical gradient.
The amount of energy needed for the transport of a solute against a gradient can be calculated from the initial concentration gradient. The general equation for the free-energy change in the chemical process that converts substrate (S) to product (P) is
(11-2)
where is the standard free-energy change, R is the gas constant (8.315 J/mol • K), and T is the absolute temperature. When the “reaction” is simply transport of a solute from a region where its concentration is to a region where its concentration is , no bonds are made or broken and is zero. The free-energy change for transport, , is then
(11-3)
If there is, say, a 10-fold difference in concentration between two compartments, the cost of moving 1 mol of an uncharged solute at 25 °C uphill across a membrane separating the compartments is
Equation 11-3 holds for all uncharged solutes.
WORKED EXAMPLE 11-1 Energy Cost of Pumping an Uncharged Solute
Calculate the energy cost (free-energy change) of pumping an uncharged solute against a -fold concentration gradient at 25 °C.
SOLUTION:
Begin with Equation 11-3. Substitute for (), 8.315 J/mol • K for R, and 298 K for T:
When the solute is an ion, its movement without an accompanying counterion results in the endergonic separation of positive and negative charges, producing an electrical potential; such a transport process is said to be electrogenic. The energetic cost of moving an ion depends on the electrochemical potential (Fig. 11-25), the sum of the chemical and electrical gradients:
(11-4)
where Z is the charge on the ion, F is the Faraday constant (96,480 J/V • mol), and Δψ is the transmembrane electrical potential (in volts). Eukaryotic cells typically have plasma membrane potentials of about 0.05 V (with the inside negative relative to the outside), so the second term on the right side of Equation 11-4 can make a significant contribution to the total free-energy change for transporting an ion. Most cells maintain more than a 10-fold difference in ion concentrations across their plasma or intracellular membranes, and for many cells and tissues active transport is therefore a major energy-consuming process.
WORKED EXAMPLE 11-2 Energy Cost of Pumping a Charged Solute
Calculate the energy cost (free-energy change) of pumping from the cytosol, where its concentration is about m, to the extracellular fluid, where its concentration is about 1.0 mm. Assume a temperature of 37 °C (body temperature in a mammal) and a standard transmembrane potential of 50 mV (inside negative) for the plasma membrane.
SOLUTION:
This is a case in which energy must be expended to counter two forces acting on the ion being transported: the membrane potential and the concentration difference across the membrane. These forces are expressed in the two terms on the right side of Equation 11-4:
in which the first term describes the chemical gradient and the second describes the electrical potential.
In Equation 11-4, substitute 8.315 J/mol • K for R, 310 K for T, for , for (the charge on a ion) for Z, 96,500 J/V • mol for F, and 0.050 V for Δψ. Note that the transmembrane potential is 50 mV (inside negative), so the change in potential when an ion moves from inside to outside is 50 mV.
The mechanism of active transport is of fundamental importance in biology. As we shall see in Chapters 19 and 20, ATP is formed in mitochondria and chloroplasts by a mechanism that is essentially ATP-driven ion transport operating in reverse. The energy made available by the spontaneous flow of protons across a membrane is calculable from Equation 11-4; remember that ΔG for flow down an electrochemical gradient has a negative value, and ΔG for transport of ions against an electrochemical gradient has a positive value.
P-Type ATPases Undergo Phosphorylation during Their Catalytic Cycles
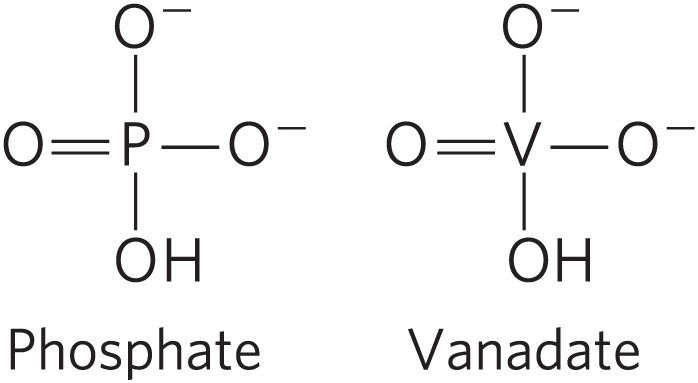
The family of active transporters called P-type ATPases are cation transporters that are reversibly phosphorylated by ATP (thus the name P-type) as part of the transport cycle. Phosphorylation forces a conformational change that is central to movement of the cation across the membrane. The human genome encodes at least 70 P-type ATPases that share similarities in amino acid sequence and topology, especially near the Asp residue that undergoes phosphorylation. All are integral proteins with 8 or 10 predicted membrane-spanning regions in a single polypeptide, and all are sensitive to inhibition by the transition-state analog vanadate, which mimics phosphate when under nucleophilic attack by a water molecule.
The P-type ATPases are widespread in eukaryotes and bacteria. The ATPase of animal cells (an antiporter for and ions) and the plasma membrane ATPase of plants and fungi set the transmembrane electrochemical potential in cells by establishing ion gradients across the plasma membrane. These gradients provide the driving force for secondary active transport and are also the basis for electrical signaling in neurons. In animal tissues, the sarcoplasmic/endoplasmic reticulum ATPase (SERCA) pump and the plasma membrane ATPase pump, which are uniporters for ions, together maintain the cytosolic level of below 1 µm. The SERCA pump moves from the cytosol into the lumen of the sarcoplasmic reticulum. Parietal cells in the lining of the mammalian stomach have a P-type ATPase that pumps and out of the cells and into the stomach, thereby acidifying the stomach contents. Lipid flippases, as we noted earlier, are structurally and functionally related to P-type transporters. Bacteria and eukaryotes use P-type ATPases to pump toxic heavy metal ions such as and out of cells.
All P-type pumps have similar structures (Fig. 11-37) and similar mechanisms. The mechanism postulated for P-type ATPases takes into account the large conformational changes and the phosphorylation-dephosphorylation of the critical Asp residue in the P (phosphorylation) domain that is known to occur during a catalytic cycle. For the SERCA pump (Fig. 11-38), each catalytic cycle moves two ions across the membrane and converts an ATP to ADP and . The role of ATP binding and phosphoryl transfer to the enzyme is to bring about the interconversion of two conformations, E1 and E2, of the transporter. In the E1 conformation, the two -binding sites are exposed on the cytosolic side of the ER or sarcoplasmic reticulum and bind with high affinity. ATP binding and Asp phosphorylation drive a conformational change from E1 to E2 that exposes the -binding sites to the lumen and greatly reduces their affinity for , which releases the ions into the lumen. By this mechanism, the energy released by hydrolysis of ATP during one phosphorylation-dephosphorylation cycle drives across the membrane against a large electrochemical gradient.
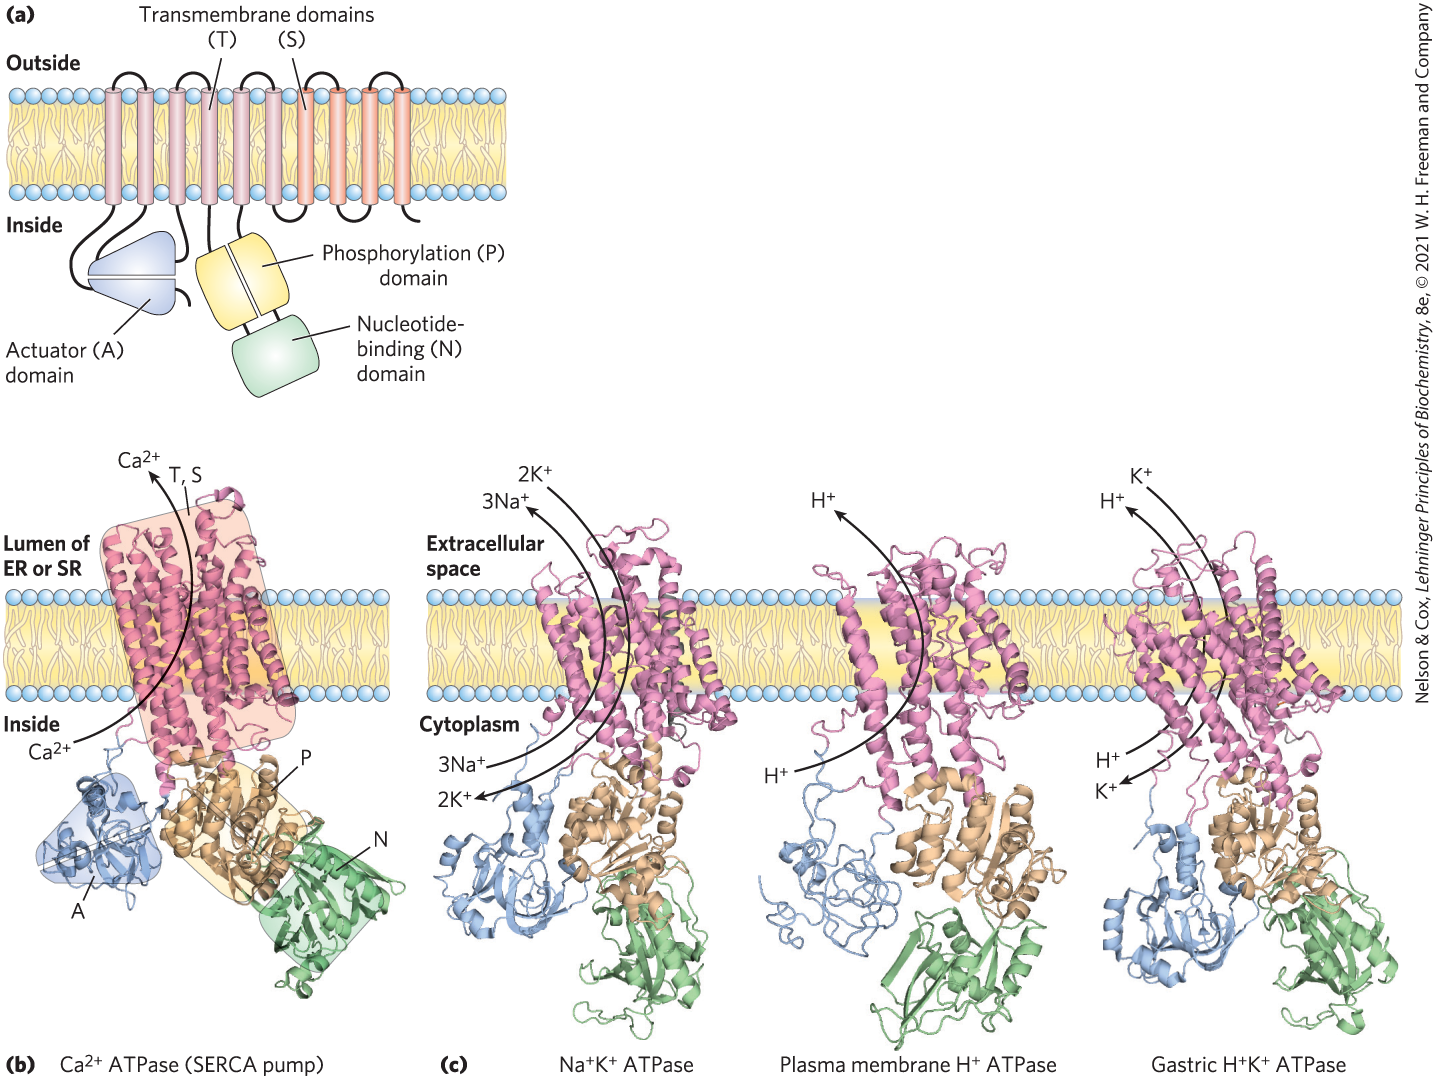
FIGURE 11-37 The general structure of the P-type ATPases. (a) P-type ATPases have three cytoplasmic domains (A, N, and P) and two transmembrane domains (T and S) consisting of multiple helices. The N (nucleotide-binding) domain binds ATP and and has protein kinase activity that phosphorylates a specific Asp residue in the P (phosphorylation) domain of all P-type ATPases. The A (actuator) domain has protein phosphatase activity and removes the phosphoryl group from the Asp residue with each catalytic cycle of the pump. A transport (T) domain with six transmembrane helices includes the ion-transporting structure, and four more transmembrane helices make up the support (S) domain, which provides physical support to the transport domain and may have other specialized functions in certain P-type ATPases. The binding sites for the ions to be transported are near the middle of the membrane, 40 to 50 Å from the phosphorylated Asp residue — thus, Asp phosphorylation-dephosphorylation does not directly affect ion binding. The A domain communicates movements of the N and P domains to the ion-binding sites. (b) A ribbon representation of the ATPase (SERCA pump). ATP binds to the N domain, and the ions to be transported bind to the T domain. (c) Other P-type ATPases have domain structures, and presumably mechanisms, like those of the SERCA pump; shown here are ATPase, the plasma membrane ATPase, and the gastric ATPase. [(a) Information from M. Bublitz et al., Curr. Opin. Struct. Biol. 20:431, 2010, Fig. 1. Data from (b) PDB ID 1SU4, C. Toyoshima et al., Nature 405:647, 2000; (c) ATPase, PDB ID 3KDP, J. Preben Morth et al., Nature 450:1043, 2007; ATPase, PDB ID 3B8C, B. P. Pedersen et al., Nature 450:1111, 2007; ATPase, PDB ID 3IXZ, K. Abe et al., EMBO J. 28:1637, 2009, and PDB ID 3B8E, J. Preben Morth et al., Nature 450:1043, 2007.]
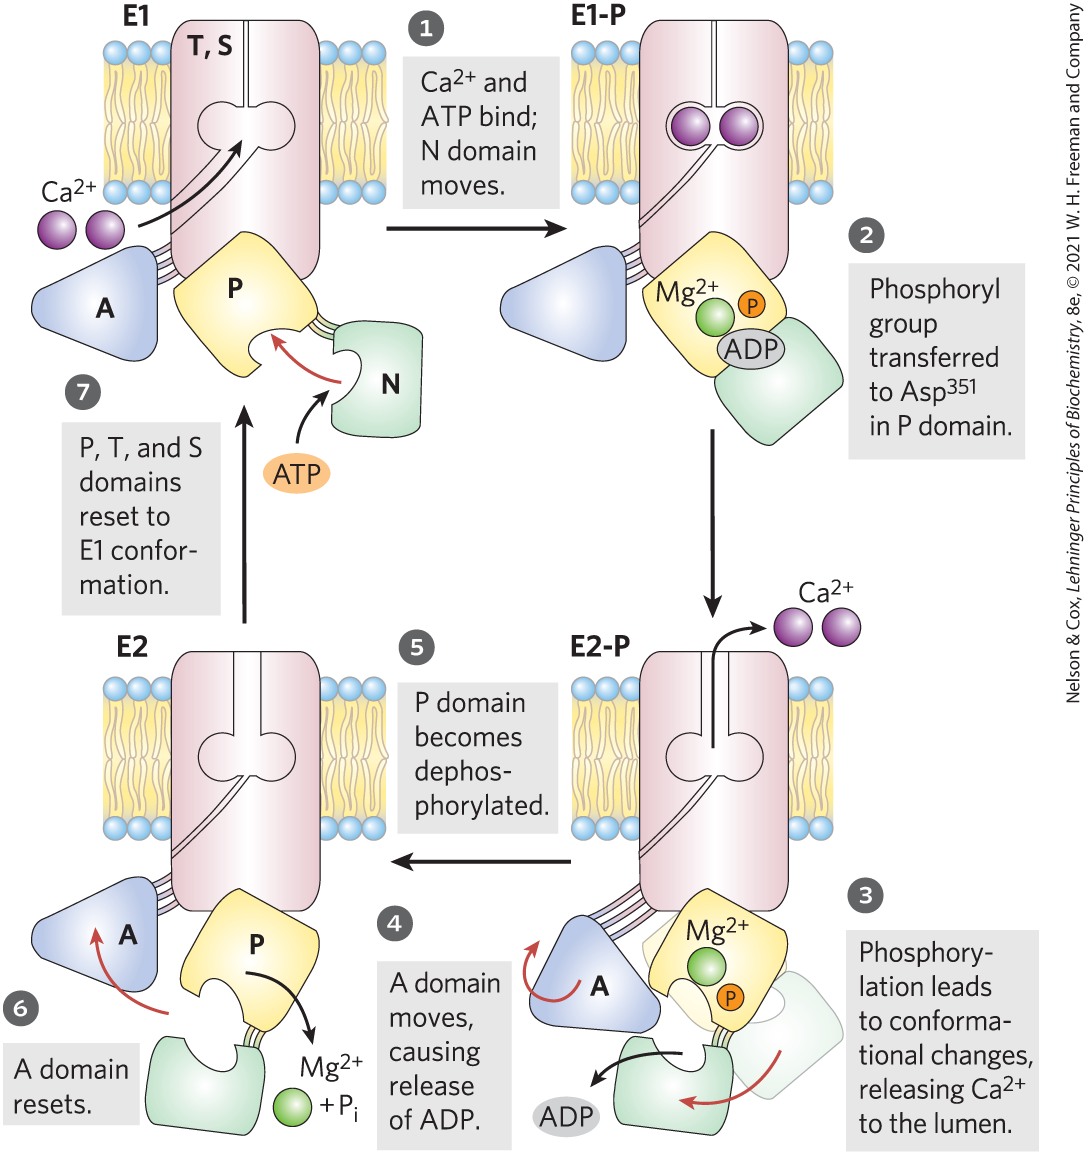
FIGURE 11-38 Postulated mechanism of the SERCA pump. The transport cycle begins with the protein in the E1 conformation, with the -binding sites facing the cytosol. Two ions bind, then ATP binds to the transporter and phosphorylates , forming E1-P. Phosphorylation favors the second conformation, E2-P, in which the -binding sites, now with a reduced affinity for , are accessible on the other side of the membrane (the lumen or extracellular space), and the released diffuses away. ADP is released, and E2-P is dephosphorylated. The A domain resets and the protein returns to the E1 conformation for another round of transport. [Information from W. Kühlbrandt, Nat. Rev. Mol. Cell Biol. 5:282, 2004.]
 E2-P is dephosphorylated.
  The A domain resets and
  the protein returns to the E1 conformation for another round of transport. [Information from W. Kühlbrandt, Nat. Rev. Mol. Cell Biol. 5:282, 2004.]
A variation on this basic mechanism is seen in the ATPase of the plasma membrane. This cotransporter couples phosphorylation-dephosphorylation of the critical Asp residue to the simultaneous movement of both and against their electrochemical gradients. The ATPase is responsible for maintaining low and high concentrations in the cell relative to the extracellular fluid (Fig. 11-39). For each molecule of ATP converted to ADP and , the transporter moves two ions inward and three ions outward across the plasma membrane. Cotransport is therefore electrogenic, creating a net separation of charge across the membrane; in animals, this produces the membrane potential of –50 to –70 mV (inside negative relative to outside) that is characteristic of most cells and is essential to the conduction of action potentials in neurons. The central role of the ATPase is reflected in the energy invested in this single reaction: about 25% of the total energy consumption of a human at rest.
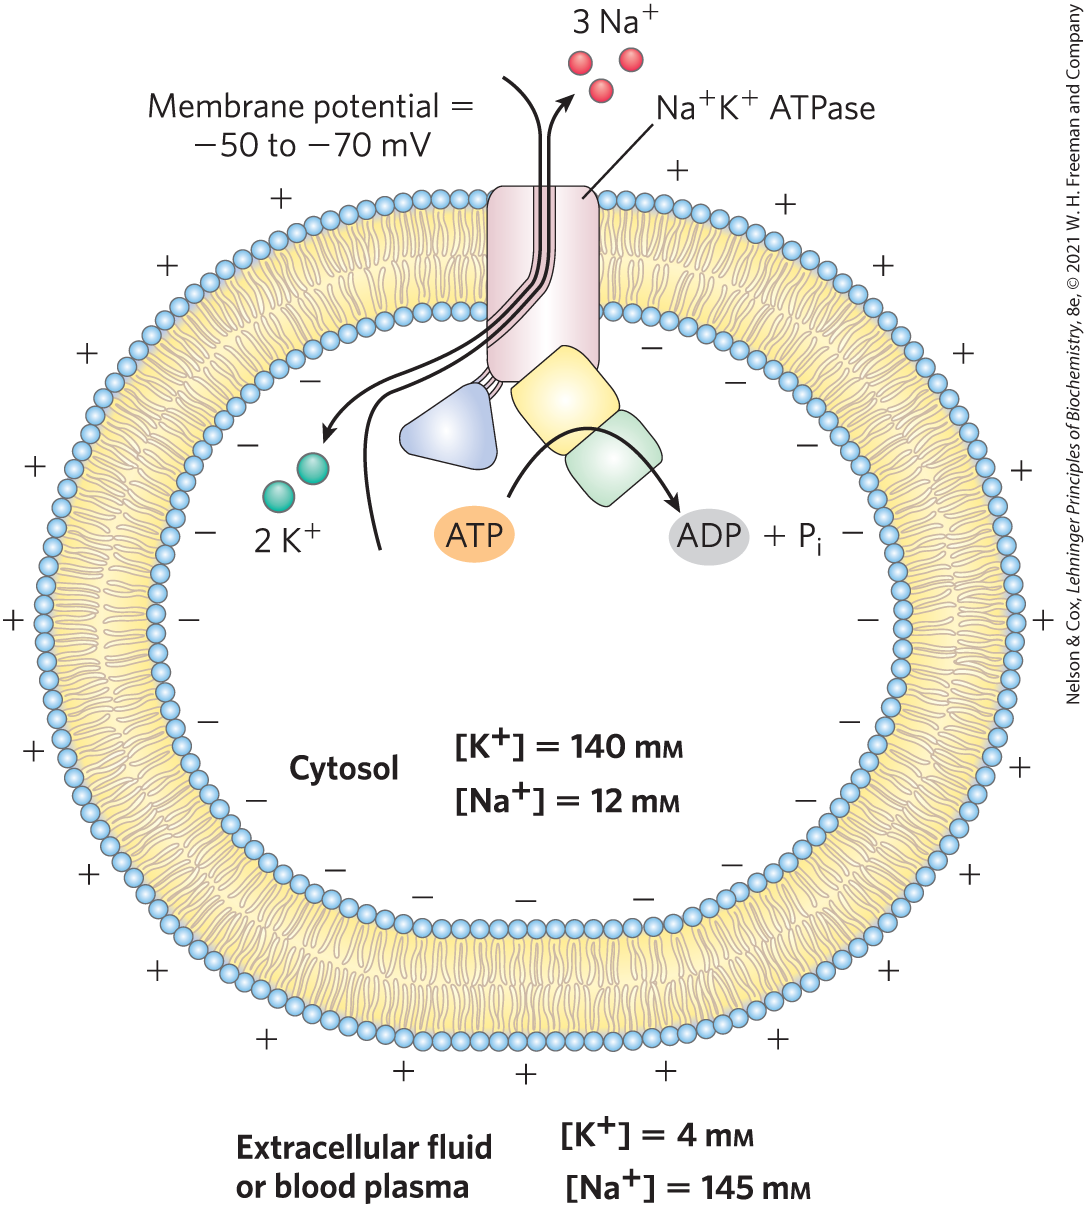
FIGURE 11-39 Role of the ATPase in animal cells. This active transport system is primarily responsible for setting and maintaining the intracellular concentrations of and in animal cells and for generating the membrane potential. It does this by moving three ions out of the cell for every two ions it moves in. The electrical potential across the plasma membrane is central to electrical signaling in neurons, and the gradient of is used to drive the uphill cotransport of solutes in many cell types.
V-Type and F-Type ATPases Are ATP-Driven Proton Pumps
V-type ATPases, a class of proton-transporting ATPases, are responsible for acidifying intracellular compartments in many organisms (thus, V for vacuolar). Proton pumps of this type maintain the vacuoles of fungi and higher plants at a pH between 3 and 6, well below that of the surrounding cytosol (pH 7.5). V-type ATPases are also responsible for the acidification of lysosomes, endosomes, the Golgi complex, and secretory vesicles in animal cells. All V-type ATPases have a similar complex structure, with an integral (transmembrane) domain that serves as a proton channel and a peripheral domain that contains the ATP-binding site and the ATPase activity (Fig. 11-40a). The structure is similar to that of the well-characterized F-type ATPases.
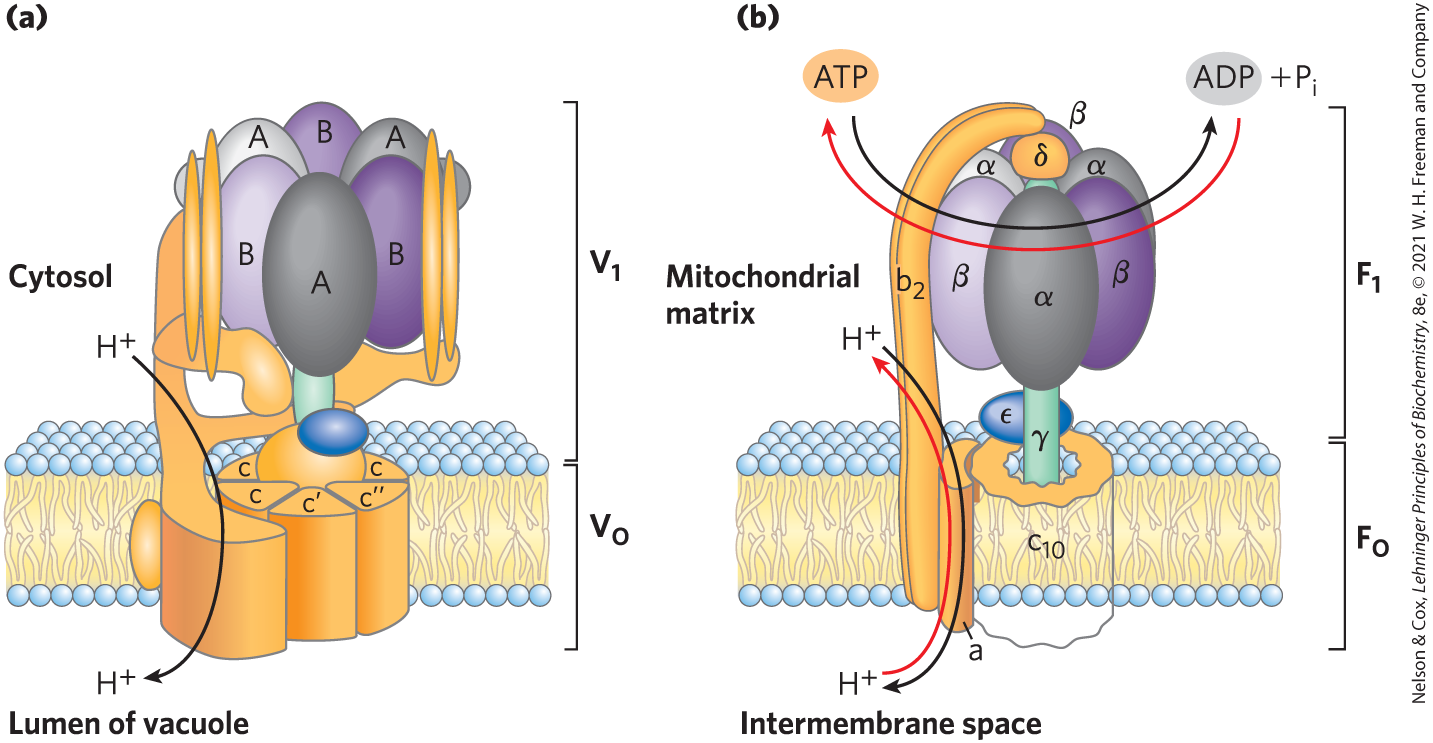
FIGURE 11-40 Two proton pumps with similar structures. (a) The ATPase uses ATP to pump protons into vacuoles and lysosomes, creating their low internal pH. It has an integral (membrane-embedded) domain, , that includes multiple identical c subunits, and a peripheral domain that projects into the cytosol and contains the ATP-hydrolyzing sites, on three identical B subunits (purple). (b) The ATPase/ATP synthase of mitochondria has an integral domain, , with multiple copies of the c subunit, and a peripheral domain, , consisting of three α subunits, three β subunits, and a central shaft joined to the integral domain. and provide transmembrane channels through which protons are pumped as ATP is hydrolyzed on the β subunits of (B subunits of ). An ATP-driven proton transporter also can catalyze ATP synthesis (red arrows) as protons flow down their electrochemical gradient. This is the central reaction in the processes of oxidative phosphorylation and photophosphorylation.
F-type ATPase transporters catalyze the uphill transmembrane passage of protons, driven by ATP hydrolysis. The “F-type” designation derives from the identification of these ATPases as energy-coupling factors. The integral membrane protein complex (Fig. 11-40b; subscript “o” denotes its inhibition by the drug oligomycin) provides a transmembrane pathway for protons, and the peripheral protein (subscript “1” indicating that this was the first of several factors isolated from mitochondria) uses the energy of ATP to drive protons uphill (into a region of higher concentration). The organization of proton-pumping transporters must have developed very early in evolution. Bacteria such as E. coli use an ATPase complex in their plasma membrane to pump protons outward, and archaea have a closely homologous proton pump, the ATPase.
Like all enzymes, F-type ATPases catalyze their reactions in both directions. Therefore, a sufficiently large proton gradient can supply the energy to drive the reverse reaction, ATP synthesis (Fig. 11-40b). When functioning in this direction, the F-type ATPases are more appropriately named ATP synthases. ATP synthases are central to ATP production in mitochondria during oxidative phosphorylation and in chloroplasts during photophosphorylation, as well as in bacteria and archaea. The proton gradient needed to drive ATP synthesis is produced by other types of proton pumps powered by substrate oxidation or sunlight. We provide a detailed description of these processes in Chapters 19 and 20.
ABC Transporters Use ATP to Drive the Active Transport of a Wide Variety of Substrates
ABC transporters constitute a large family of ATP-driven transporters that pump amino acids, peptides, proteins, metal ions, various lipids, bile salts, and many hydrophobic compounds, including drugs, across a membrane against a concentration gradient. Many ABC transporters are located in the plasma membrane, but some are also found in the ER and in the membranes of mitochondria and lysosomes. All members of this family have two ATP-binding domains (“cassettes”) that give the family its name — ATP-binding cassette transporters — and two transmembrane domains, each containing six transmembrane helices. In some cases, all these domains are in a single, long polypeptide; other ABC transporters have two subunits, each contributing a nucleotide-binding domain (NBD) and a domain with six transmembrane helices. The transport mechanism is believed to involve two forms of the transporter, one with its substrate-binding site facing the outside of the cell, the other open to substrate on the inside (Fig. 11-41). Substrates move across the membrane when the two forms interconvert, driven by ATP hydrolysis. The NBDs of all ABC proteins are similar in sequence and presumably in three-dimensional structure. They constitute the conserved molecular motor that can be coupled to a wide variety of transmembrane domains, each capable of pumping one specific substrate across a membrane. When coupled this way, the ATP-driven motor moves solutes against a concentration gradient, with a stoichiometry of about one ATP hydrolyzed per molecule of substrate transported.
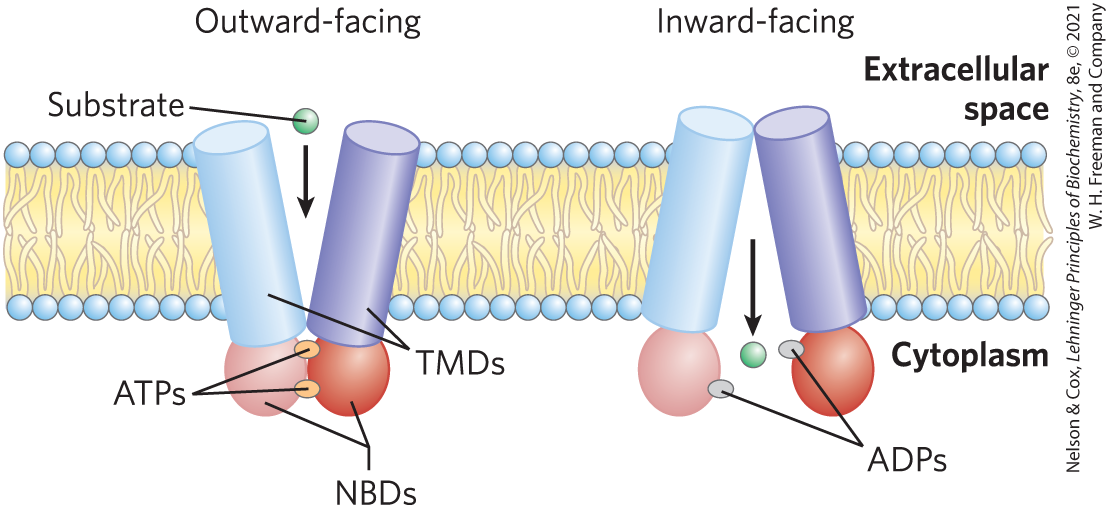
FIGURE 11-41 ABC transporters. The protein has two homologous halves, each with a six-helix transmembrane domain (TMD; blue), and a cytoplasmic nucleotide-binding domain (NBD; red). In the mechanism proposed for the coupling of ATP hydrolysis to transport, with ATP bound to the NBD sites, substrate binds to the transporter on the cytoplasmic side. Upon substrate binding and ATP hydrolysis to ADP, a conformational change exposes the substrate to the outside surface and lowers the transporter’s affinity for its substrate; substrate diffuses away from the transporter into the extracellular space. This mechanism for the coupling of ATP hydrolysis to transport is based on structures of a number of ABC transporters crystallized under different conditions. Compare this process with the model of glucose transport in Figure 11-33.
The human genome contains at least 48 genes that encode ABC transporters; a number of these are presented in Table 11-2. Some of these transporters have very high specificity for a single substrate; others are more promiscuous, able to transport drugs that cells presumably did not encounter during their evolution. Many ABC transporters are involved in maintaining the composition of the lipid bilayer, such as the floppases that move membrane lipids from one leaflet of the bilayer to the other. Many others are needed to move sterols, sterol derivatives, and fatty acids into the bloodstream for transport throughout the body. For example, the cellular machinery for exporting excess cholesterol includes an ABC transporter (see Fig. 21-47). Mutations in the genes that encode some of these proteins contribute to genetic diseases, including liver failure, retinal degeneration, and Tangier disease. The cystic fibrosis transmembrane conductance regulator protein (CFTR) of the plasma membrane is an interesting case of an ABC protein that is an ion channel (for ), regulated by ATP hydrolysis, but without the pumping function characteristic of an active transporter (Box 11-2).
| Gene(s) | Role/characteristics | Text reference |
|---|---|---|
| ABCA1 | Reverse cholesterol transport; defect causes Tangier disease | Fig. 21-47 |
| ABCA4 | Only in visual receptors, recycling of all-trans-retinal | Fig. 12-19 |
| ABCB1 | Multidrug resistance P-glycoprotein 1; transport across blood-brain barrier | — |
| ABCB4 | Multidrug resistance; transport of phosphatidylcholine in bile | — |
| ABCB11 | Transports bile salts out of hepatocytes | Fig. 17-1 |
| ABCC6 | Sulfonylurea receptor; targeted by the drug glipizide in type 2 diabetes | Fig. 23-27 |
| ABCG2 | Breast cancer resistance protein (BCRP); major exporter of anticancer drugs | p. 396 |
| ABCC7 | CFTR ( channel); defect causes cystic fibrosis | Box 11-2 |
One human ABC transporter with very broad substrate specificity is the multidrug transporter (MDR1), encoded by the ABCB1 gene. MDR1 in the placental membrane and in the blood-brain barrier ejects toxic compounds that would damage the fetus or the brain. But it is also responsible for the striking resistance of certain tumors to some generally effective antitumor drugs. For example, MDR1 pumps the chemotherapeutic drugs doxorubicin and vinblastine out of cells, thus preventing their accumulation within a tumor and blocking their therapeutic effects. Overexpression of MDR1 is often associated with treatment failure in cancers of the liver, kidney, and colon. A related ABC transporter, BCRP (breast cancer resistance protein, encoded by the ABCG2 gene), is overexpressed in breast cancer cells, also conferring resistance to anticancer drugs. Highly selective inhibitors of these multidrug transporters are expected to enhance the effectiveness of antitumor drugs and are the objects of current drug discovery and design.
ABC transporters are also present in simpler animals and in plants and microorganisms. Yeast has 31 genes that encode ABC transporters, Drosophila has 56, and E. coli has 80, representing 2% of its entire genome. ABC transporters that are used by E. coli and other bacteria to import essentials such as vitamin are the presumed evolutionary precursors of the MDRs of animal cells. The presence of ABC transporters that confer antibiotic resistance in pathogenic microbes (Pseudomonas aeruginosa, Staphylococcus aureus, Candida albicans, Neisseria gonorrhoeae, and Plasmodium falciparum) is a serious public health concern and makes these transporters attractive targets for drug design.
Ion Gradients Provide the Energy for Secondary Active Transport
The ion gradients formed by primary transport of or can, in turn, provide the driving force for cotransport of other solutes. Many cell types have transport systems that couple the spontaneous, downhill flow of these ions to the simultaneous uphill pumping of another ion, sugar, or amino acid.
In intestinal epithelial cells, glucose and certain amino acids are accumulated by symport with , down the gradient established by the ATPase of the plasma membrane (Fig. 11-42). The apical surface of the intestinal epithelial cell (the surface that faces the intestinal contents) is covered with microvilli — long, thin projections of the plasma membrane that greatly increase the surface area exposed to the intestinal contents. The -glucose symporter in the apical plasma membrane takes up glucose from the intestine in a process driven by the downhill flow of :
The energy required for this process comes from two sources: the greater concentration of outside than inside the cell (the chemical potential) and the membrane (electrical) potential, which is inside negative and therefore draws inward. The strong thermodynamic tendency for to move into the cell provides the energy needed for the transport of glucose into the cell, against its concentration gradient. An ion gradient created and sustained by energy-dependent ion pumping serves as the potential energy for cotransport of another species against its concentration gradient.
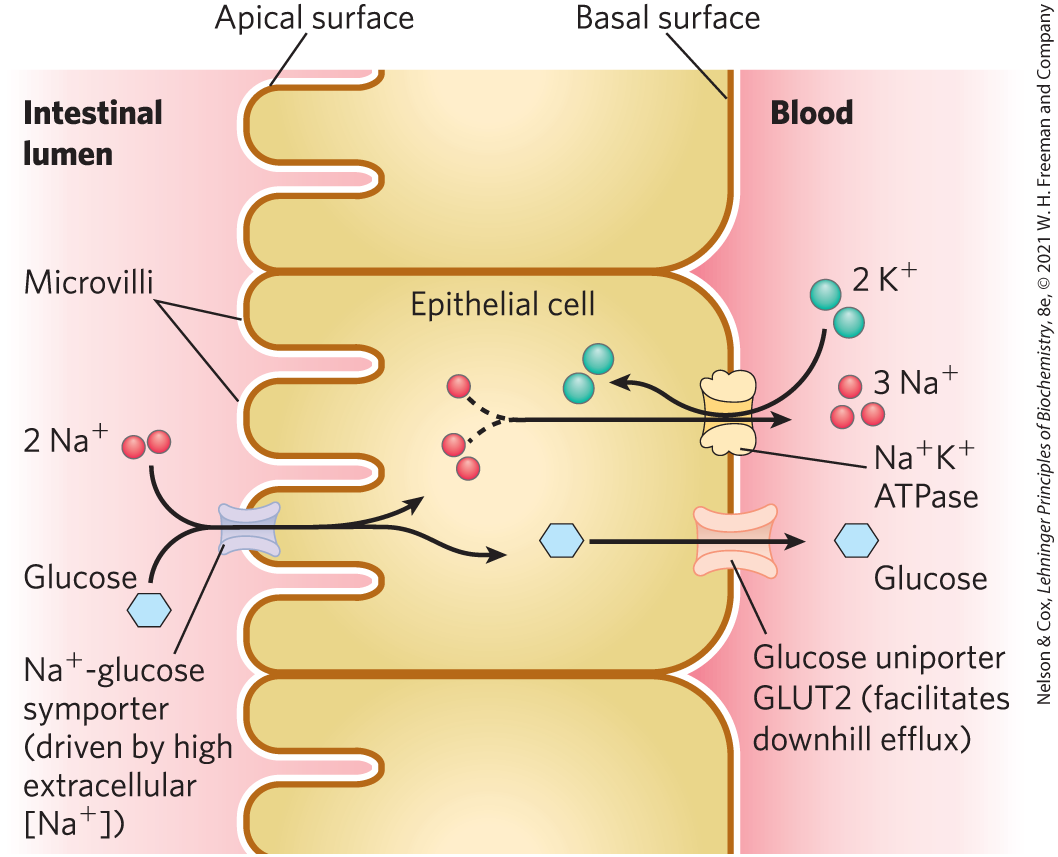
FIGURE 11-42 Glucose transport in intestinal epithelial cells. Glucose is cotransported with across the apical plasma membrane into the epithelial cell. It moves through the cell to the basal surface, where it passes into the blood via GLUT2, a passive glucose uniporter. The ATPase continues to pump outward to maintain the gradient that drives glucose uptake.
WORKED EXAMPLE 11-3 Energetics of Pumping by Symport
Calculate the maximum ratio that can be achieved by the plasma membrane -glucose symporter of an epithelial cell when is 12 mm, is 145 mm, the membrane potential is −50 mV (inside negative), and the temperature is 37 °C.
SOLUTION:
Using Equation 11-4 (p. 392), we can calculate the energy inherent in an electrochemical gradient — that is, the cost of moving one ion up this gradient:
We then substitute standard values for R, T, and F; the given values for [] (expressed as molar concentrations); +1 for Z (because has a positive charge); and 0.050 V for Δψ. Note that the membrane potential is −50 mV (inside negative), so the change in potential when an ion moves from inside to outside is 50 mV.
When reenters the cell, it releases the electrochemical potential created by pumping it out; ΔG for reentry is −11.2 kJ/mol of . This is the potential energy per mole of that is available to pump glucose. Given that two ions pass down their electrochemical gradient and into the cell for each glucose carried in by symport, the energy available to pump 1 mol of glucose is . We can now calculate the maximum concentration ratio of glucose that can be achieved by this pump (from Eqn 11-3, p. 392):
Rearranging, then substituting the values of , R, and T, gives
Thus, the cotransporter can pump glucose inward until its concentration inside the epithelial cell is about 6,000 times the concentration outside (in the intestine). (This is the maximum theoretical ratio, assuming a perfectly efficient coupling of reentry and glucose uptake.)
As glucose molecules are pumped from the intestine into the epithelial cell at the apical surface, glucose is simultaneously moved from the cell into the blood by passive transport through a glucose transporter (GLUT2) in the basal surface (Fig. 11-42). The crucial role of in symport and antiport systems such as this requires the continued outward pumping of to maintain the transmembrane gradient.
In the kidney, a different -glucose symporter (SGLT2) is the target of drugs used to treat type 2 diabetes. Gliflozins are specific inhibitors of this -glucose symporter. They lower blood glucose by inhibiting glucose reabsorption in the kidney, thus preventing the damaging effects of elevated blood glucose. Glucose not reabsorbed in the kidney is cleared in the urine. This class of drugs, taken orally in combination with diet and exercise, lowers blood glucose significantly in individuals with type 2 diabetes.
Because of the essential role of ion gradients in active transport and energy conservation, compounds that collapse ion gradients across cellular membranes are effective poisons, and those that are specific for infectious microorganisms can serve as antibiotics. One such substance is valinomycin, a small cyclic peptide that neutralizes the charge by surrounding the ion with six carbonyl oxygens (Fig. 11-43). The hydrophobic peptide then acts as a shuttle, carrying across the membrane down its concentration gradient and deflating that gradient. Compounds that shuttle ions across membranes in this way are called ionophores (“ion bearers”). Both valinomycin and monensin (a -carrying ionophore) are antibiotics; they kill microbial cells by disrupting secondary transport processes and energy-conserving reactions. Monensin is widely used as an antifungal and antiparasitic agent.
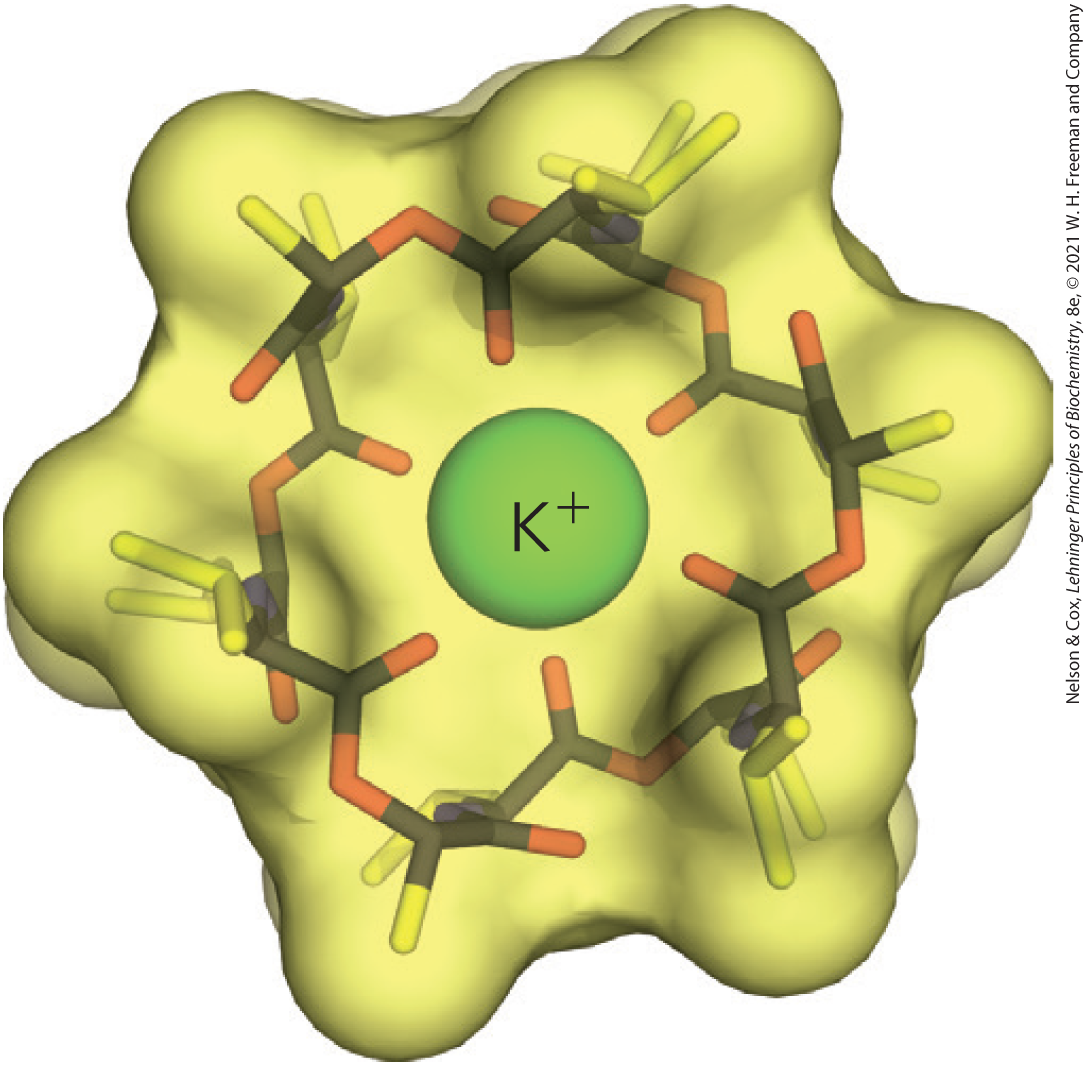
FIGURE 11-43 Valinomycin, a peptide ionophore that binds . The central ion is surrounded by inward-facing polar and charged amino acid side chains, and the outside surface is covered with nonpolar side chains that make the whole structure hydrophobic enough to diffuse through the lipid bilayer, carrying down its concentration gradient. The resulting dissipation of the transmembrane ion gradient kills microbial cells, making valinomycin a potent antibiotic. [Information from P. Barak and E. A. Nater, http://virtual-museum.soils.wisc.edu, and K. Neupert-Laves and M. Dobler, Helv. Chim. Acta 58:432, 1975.]
Aquaporins Form Hydrophilic Transmembrane Channels for the Passage of Water
A family of integral membrane proteins, the aquaporins (AQPs), provide channels for rapid movement of water molecules across all plasma membranes. Aquaporins are found in all organisms, and multiple aquaporin genes are generally present, encoding similar but not identical proteins. Eleven aquaporins are known in mammals, each with a specific location and role (Table 11-3). The exocrine glands that produce sweat, saliva, and tears secrete water through aquaporins. Erythrocytes, which swell or shrink rapidly in response to abrupt changes in extracellular osmolarity as blood travels through the renal medulla, have a high density of aquaporin in their plasma membrane ( copies of AQP1 per cell). Seven aquaporins play roles in urine production and water retention in the nephron (the functional unit of the kidney). Each renal AQP has a specific location in the nephron, and each has specific properties and regulatory features. For example, AQP2 in the epithelial cells of the renal collecting duct is regulated by vasopressin (also called antidiuretic hormone): more water is reabsorbed from the duct into the kidney tissues when the vasopressin level is high. Mutant mice with no AQP2 gene have greater urine output (polyuria) and more dilute urine, the result of the proximal tubule becoming less permeable to water. In humans, genetically defective AQPs are known to be responsible for a variety of diseases.
| Aquaporin | Permeant (permeability) | Tissue distribution | Primary subcellular distributiona |
|---|---|---|---|
| AQP0 | Water (low) | Lens | Plasma membrane |
| AQP1 | Water (high) | Erythrocyte, kidney, lung, vascular endothelium, brain, eye | Plasma membrane |
| AQP2 | Water (high) | Kidney, vas deferens | Apical plasma membrane, intracellular vesicles |
| AQP3 | Water (high), glycerol (high), urea (moderate) | Kidney, skin, lung, eye, colon | Basolateral plasma membrane |
| AQP4 | Water (high) | Brain, muscle, kidney, lung, stomach, small intestine | Basolateral plasma membrane |
| AQP5 | Water (high) | Salivary gland, lacrimal gland, sweat gland, lung, cornea | Apical plasma membrane |
| AQP6 | Water (low), anions | Kidney | Intracellular vesicles |
| AQP7 | Water (high), glycerol (high), urea (high) | Adipose tissue, kidney, testis | Plasma membrane |
| AQP8b | Water (high) | Testis, kidney, liver, pancreas, small intestine, colon | Plasma membrane, intracellular vesicles |
| AQP9 | Water (low), glycerol (high), urea (high) | Liver, leukocyte, brain, testis | Plasma membrane |
| AQP10 | Water (low), glycerol (high), urea (high) | Small intestine | Intracellular vesicles |
|
Information from L. S. King et al., Nat. Rev. Mol. Cell Biol. 5:688, 2004. aThe apical plasma membrane faces the lumen of the gland or tissue; the basolateral plasma membrane is along the sides and base of the cell, not facing the lumen of the gland or tissue. bAQP8 might also be permeated by urea. |
|||
Water molecules flow through an AQP1 channel at a rate of about . For comparison, the highest known turnover number for an enzyme is that for catalase, , and many enzymes have turnover numbers between 1 and (see Table 6-7). The low activation energy for passage of water through aquaporin channels suggests that water moves through the channels in a continuous stream, in the direction dictated by the osmotic gradient. (For a discussion of osmosis, see p. 52.) Aquaporins do not allow passage of protons (hydronium ions, ), which would collapse membrane electrochemical gradients.
Ion-Selective Channels Allow Rapid Movement of Ions across Membranes
Ion-selective channels — first recognized in neurons and now known to be present in the plasma membranes of all cells, as well as in the intracellular membranes of eukaryotes — provide another mechanism for moving inorganic ions across membranes. Ion channels, together with ion pumps such as the ATPase, determine a plasma membrane’s permeability to specific ions and regulate the cytosolic concentration of ions and the membrane potential. In neurons, very rapid changes in the activity of ion channels cause the changes in membrane potential (action potentials) that carry signals from one end of a neuron to the other. In myocytes, rapid opening of channels in the sarcoplasmic reticulum releases the that triggers muscle contraction. We discuss the signaling functions of ion channels in Chapter 12. Here we describe the structural basis for ion-channel function, using as our example a well-studied channel.
Ion channels are distinct from ion transporters in at least three ways. First, the rate of flux through channels can be orders of magnitude greater than the turnover number for a transporter — to ions/s for an ion channel, approaching the theoretical maximum for unrestricted diffusion. By contrast, the turnover rate of the ATPase is about 100 . Second, ion channels are not saturable: rates do not approach a maximum at high substrate concentration. Third, they are gated in response to some type of cellular event. In ligand-gated channels (which are generally oligomeric), binding of an extracellular or intracellular small molecule forces an allosteric transition in the protein, which opens or closes the channel. In voltage-gated ion channels, a change in transmembrane electrical potential causes a charged protein domain to move relative to the membrane, opening or closing the channel. Both types of gating can be very fast. A channel typically opens in a fraction of a millisecond and may remain open for only milliseconds, making these molecular devices effective for very fast signal transmission in the nervous system.
Because a single ion channel typically remains open for only a few milliseconds, monitoring this process is beyond the limit of most biochemical measurements. Ion fluxes must therefore be measured electrically, either as changes in (in the millivolt range) or as electric current I (in the microampere or picoampere range), using microelectrodes and appropriate amplifiers. In patch-clamping, very small currents are measured through a tiny region of the membrane surface containing only one or a few ion-channel molecules (Fig. 11-44). The researcher can measure the size and duration of the current that flows during one opening of an ion channel and can determine how often a channel opens and how that frequency is affected by membrane potential, regulatory ligands, toxins, and other agents. Patch-clamp studies have revealed that as many as ions can move through a single ion channel in 1 ms. Such an ion flux represents a huge amplification of the initial signal, which may be just one or two signaling molecules (neurotransmitters, for example).
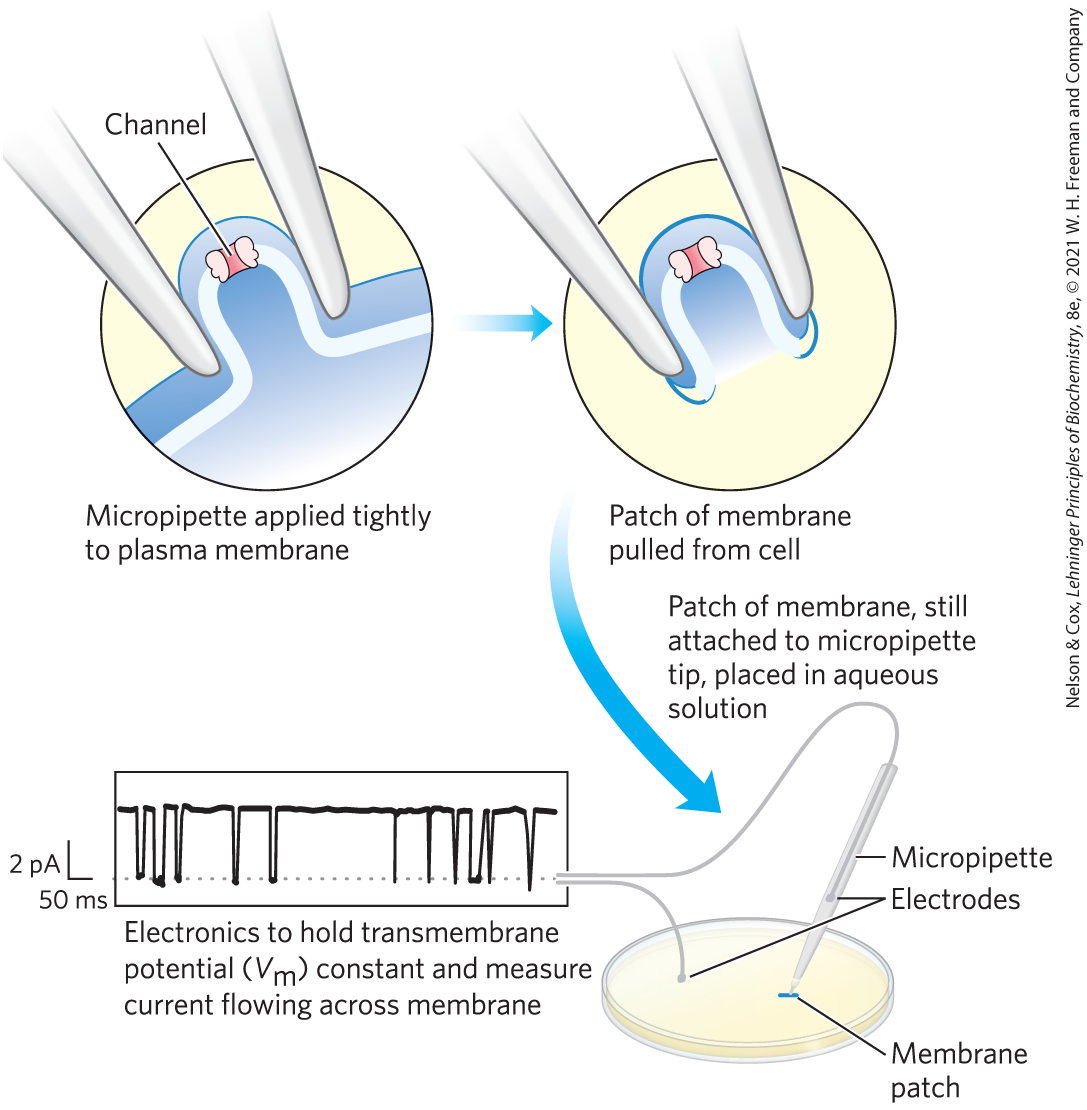
FIGURE 11-44 Electrical measurements of ion-channel function. The “activity” of an ion channel is estimated by measuring the flow of ions through it, using the patch-clamp technique. A finely drawn-out pipette (micropipette) is pressed against the cell surface, and negative pressure in the pipette forms a pressure seal between pipette and membrane. As the pipette is pulled away from the cell, it pulls off a tiny patch of membrane (which may contain one or a few ion channels). After placing the pipette and attached patch in an aqueous solution, the researcher can measure channel activity as the electric current that flows between the contents of the pipette and the aqueous solution. In practice, a circuit is set up that “clamps” the transmembrane potential at a given value and measures the current that must flow to maintain this voltage. With highly sensitive detectors, researchers can measure the current flowing through a single ion channel, typically a few picoamperes. The trace shows the current through a single acetylcholine receptor channel as a function of time (in milliseconds), revealing how fast the channel opens and closes, how frequently it opens, and how long it stays open. Downward deflection represents channel opening. Clamping the at different values permits determination of the effect of membrane potential on these parameters of channel function. [Information from V. Witzemann et al., Proc. Natl. Acad. Sci. USA 93:13,286, 1996.]
The Structure of a Channel Reveals the Basis for Its Specificity
The structure of a potassium channel from the bacterium Streptomyces lividans provides important insight into the way ion channels work. This bacterial ion channel is related in sequence to all other known channels and serves as the prototype for such channels, including the voltage-gated channel of neurons. Among the members of this protein family, the similarities in sequence are greatest in the “pore region,” which contains the ion selectivity filter that allows (radius 1.33 Å) to pass times more readily than (radius 0.95 Å) — at a rate (about ions/s) approaching the theoretical limit for unrestricted diffusion.
The channel consists of four identical subunits that span the membrane and form a cone within a cone surrounding the ion channel, with the wide end of the double cone facing the extracellular space (Fig. 11-45a). Each subunit has two transmembrane α helices and a third, shorter helix that contributes to the pore region. The outer cone is formed by one of the transmembrane helices of each subunit. The inner cone, formed by the other four transmembrane helices, surrounds the ion channel and cradles the ion selectivity filter. Viewed perpendicular to the plane of the membrane, the central channel is seen to be just wide enough to accommodate an unhydrated metal ion such as potassium (Fig. 11-45b).
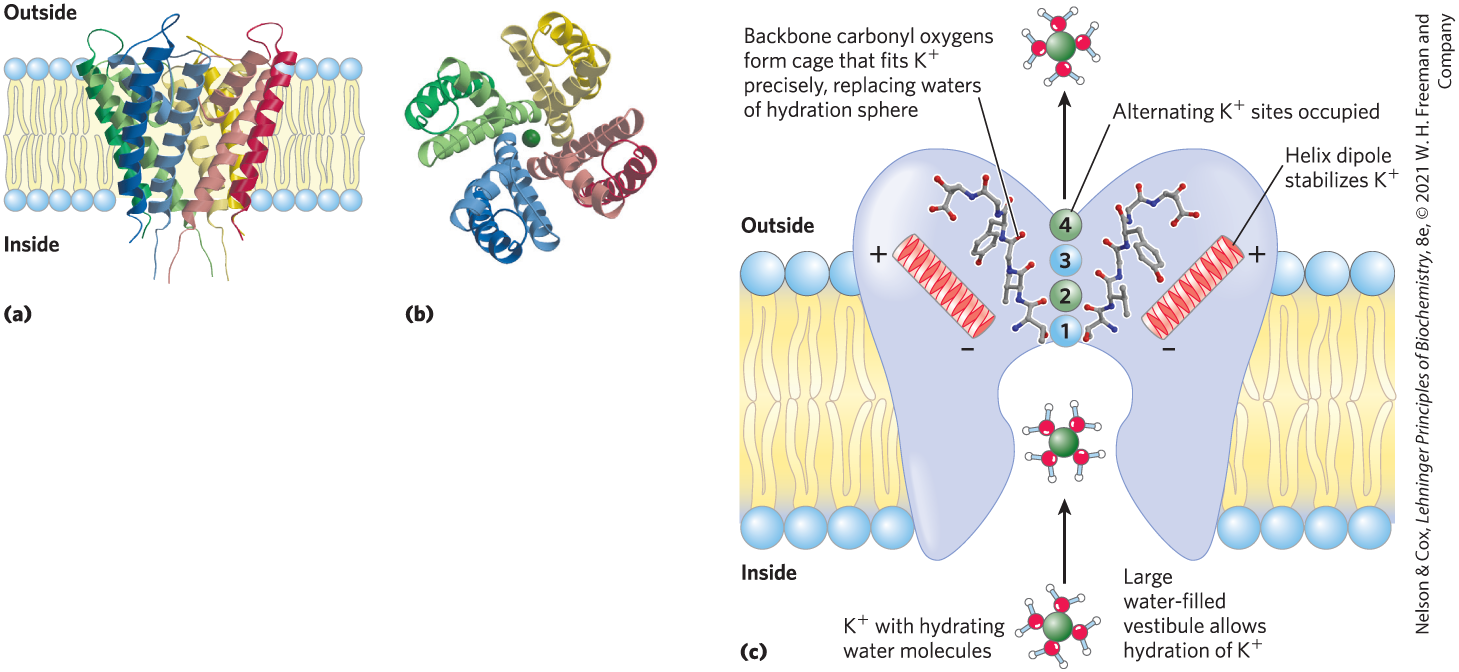
FIGURE 11-45 The channel of Streptomyces lividans. (a) Viewed in the plane of the membrane, the channel consists of eight transmembrane helices (two from each of four identical subunits), forming a cone with its wide end toward the extracellular space. The inner helices of the cone (lighter colored) line the transmembrane channel, and the outer helices interact with the lipid bilayer. Short segments of each subunit converge in the open end of the cone to make a selectivity filter. (b) This view, perpendicular to the plane of the membrane, shows the four subunits arranged around a central channel just wide enough for a single ion to pass. (c) Diagram of a channel in cross section, showing the structural features critical to function. ions go through the channel in pairs, first in sites 1 and 3, then in sites 2 and 4. Carbonyl oxygens (red) of the peptide backbone in the selectivity filter protrude into the channel, interacting with and stabilizing the ions that are passing through. [Data from (a, b) PDB ID 1BL8, D. A. Doyle et al., Science 280:69, 1998; (c) G. Yellen, Nature 419:35, 2002, and PDB ID 1J95, M. Zhou et al., Nature 411:657, 2001.]
Both the ion specificity and the high flux through the channel are understandable from what we know of the channel’s structure (Fig. 11-45c). At the inner and outer plasma membrane surfaces, the entryways to the channel have several negatively charged amino acid residues, which presumably increase the local concentration of cations such as and . The ion path through the membrane begins (on the inner surface) as a wide, water-filled channel in which the ion can retain its hydration sphere. Further stabilization is provided by the short helices in the pore region of each subunit, with the partial negative charges of their electric dipoles pointed at in the channel. About two-thirds of the way through the membrane, this channel narrows in the region of the selectivity filter, forcing the ion to give up its hydrating water molecules. Carbonyl oxygen atoms in the backbone of the selectivity filter replace the water molecules in the hydration sphere, forming a series of perfect coordination shells through which the moves. This favorable interaction with the filter is not possible for , which is too small to make contact with all the potential oxygen ligands. The preferential stabilization of is the basis for the ion selectivity of the filter, and mutations that change residues in this part of the protein eliminate the channel’s ion selectivity. The -binding sites of the filter are flexible enough to collapse to fit any that enters the channel, and this conformational change closes the channel.
There are four potential -binding sites along the selectivity filter, each composed of an oxygen “cage” that provides ligands for the ions (Fig. 11-45c). In the crystal structure, two ions are visible within the selectivity filter, about 7.5 Å apart, and two water molecules occupy the unfilled positions. ions pass through the filter in single file; their mutual electrostatic repulsion probably just balances the interaction of each ion with the selectivity filter and keeps them moving. Movement of the two ions is concerted: first they occupy positions 1 and 3, then they hop to positions 2 and 4. The energetic difference between these two configurations (1, 3 and 2, 4) is very small; energetically, the selectivity pore is not a series of hills and valleys but a flat surface, which is ideal for rapid ion movement through the channel. The structure of the channel seems to have been optimized during evolution to give maximal flow rates and high specificity.
SUMMARY 11.3 Solute Transport across Membranes
- Some transporters simply facilitate passive diffusion of a solute across the membrane, from a higher concentration to a lower concentration. Others transport solutes against an electrochemical gradient; this requires a source of metabolic energy.
- Transporters move solutes across a membrane one or a few at a time, providing a binding site on each side of the membrane. The binding sites alternate between being accessible from the outside and from the inside. Ion channels provide a path across the membrane, which is either open or closed. When open, the channel allows the movement of large numbers of solute ion across the membrane at nearly the speed of unhindered diffusion.
- A family of glucose transporters in humans includes the passive transporter GLUT1, which is saturated at normal levels of glucose in the blood. GLUT1 facilitates movement of glucose from blood into erythrocytes.
- The chloride-bicarbonate exchanger of erythrocytes exchanges one ion for one ion across the erythrocyte plasma membrane, mediating the uptake of in the tissues and its release in the lungs.
- Active transporters use energy to pump solutes against an electrochemical gradient.
- P-type ATPases, including the ATPase of the plasma membrane and the transporters of the sarcoplasmic/endoplasmic reticulum, couple phosphorylation and dephosphorylation of the transporter to alternate exposure of solute binding sites on the inside and the outside of the membrane. In animal cells, the ATPase maintains the differences in cytosolic and extracellular concentrations of and , and the resulting gradient is used as the energy source for a variety of secondary active transport processes.
- V-type and F-type ATPases are active transporters that couple ATP cleavage to the uphill transport of ions. The same mechanism, working in reverse, allows the synthesis of ATP, driven by movement of protons down their electrochemical gradient.
- ABC transporters carry a variety of substrates (including many drugs) out of cells, using ATP as the energy source. The ATP-using domain is conserved in many ABC transporters, and it is coupled with various transmembrane domains that give substrate specificity.
- Some active cotransporters use the energy in an ion gradient generated catabolically to move a solute uphill. The -glucose cotransporter of the kidney and intestine is such a transporter.
- Water moves across membranes through aquaporins. Some aquaporins are regulated; some also transport glycerol or urea.
- Ion channels provide hydrophilic pores through which select ions can diffuse, moving down their electrical or chemical concentration gradients. Ion channels are unsaturable, have very high flux rates, and are highly specific for one ion.
- Structural studies of channels reveal the mechanism that allows great discrimination between and other ions like . The polar transmembrane passage precisely fits the ion, but allows neither larger ions nor smaller ions to pass.
 Some transporters simply facilitate passive diffusion of a solute across the membrane, from a higher concentration to a lower concentration. Others transport solutes against an electrochemical gradient; this requires a source of metabolic energy.