5.1 Reversible Binding of a Protein to a Ligand: Oxygen-Binding Proteins
Myoglobin and hemoglobin may be the most-studied and best-understood proteins. They were the first proteins for which three-dimensional structures were determined, and these two molecules illustrate almost every aspect of that critical biochemical process: the reversible binding of a ligand to a protein. This classic model of protein function tells us a great deal about how proteins work.
Oxygen Can Bind to a Heme Prosthetic Group
Oxygen is poorly soluble in aqueous solutions (see Table 2-2) and cannot be carried to tissues in sufficient quantity if it is simply dissolved in blood serum. Also, diffusion of oxygen through tissues is ineffective over distances greater than a few millimeters. The evolution of larger, multicellular animals depended on the evolution of proteins that could transport and store oxygen. However, none of the amino acid side chains in proteins are suited for the reversible binding of oxygen molecules. This role is filled by certain transition metals, among them iron and copper, that have a strong tendency to bind oxygen. Multicellular organisms exploit the properties of metals, most commonly iron, for oxygen transport. However, free iron promotes the formation of highly reactive oxygen species such as hydroxyl radicals that can damage DNA and other macromolecules. Iron used in cells is therefore bound in forms that sequester it and/or make it less reactive. In multicellular organisms, iron is often incorporated into a protein-bound prosthetic group called heme (or haem). (Recall from Chapter 3 that a prosthetic group is a compound permanently associated with a protein that contributes to the protein’s function.) Heme is found in many oxygen-transporting proteins, as well as in some proteins, such as the cytochromes, that participate in oxidation-reduction (electron-transfer) reactions (Chapter 19).
Heme consists of a complex organic ring structure, protoporphyrin, to which is bound a single iron atom in its ferrous () state (Fig. 5-1). The iron atom has six coordination bonds: four to nitrogen atoms that are part of the flat porphyrin ring system, and two perpendicular to the porphyrin.
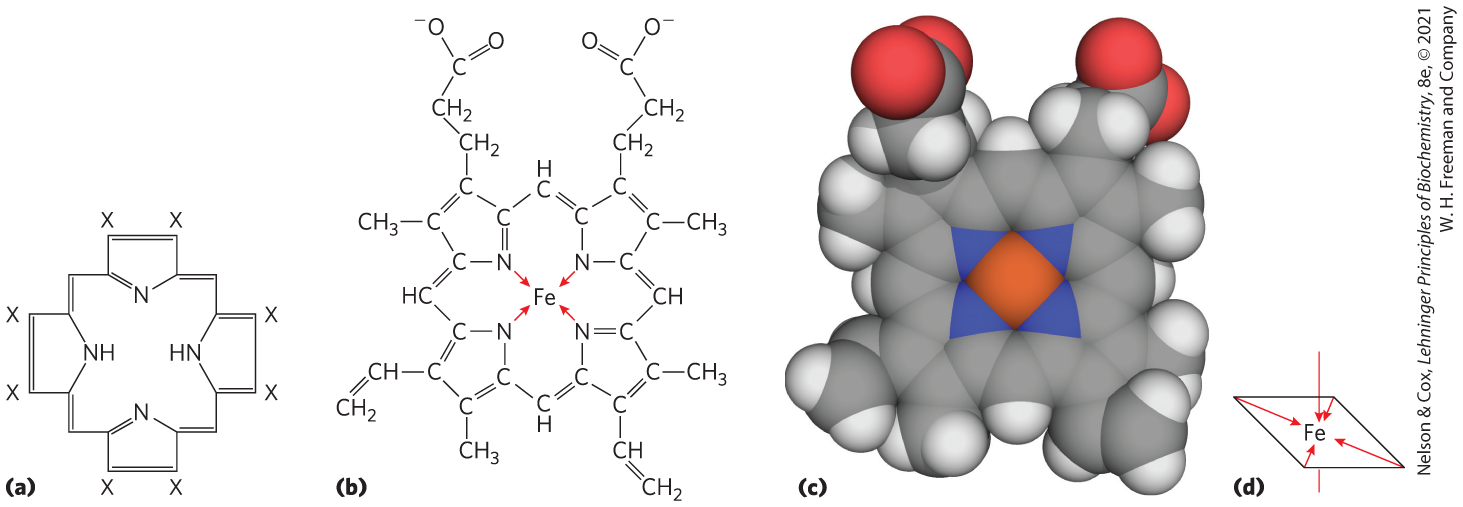
FIGURE 5-1 Heme. The heme group is present in myoglobin, hemoglobin, and many other proteins, designated heme proteins. Heme consists of a complex organic ring structure, protoporphyrin IX, with a bound iron atom in its ferrous () state. (a) Porphyrins, of which protoporphyrin IX is just one example, consist of four pyrrole rings linked by methene bridges, with substitutions at one or more of the positions denoted X. (b, c) Two representations of heme. The iron atom of heme has six coordination bonds: four in the plane of, and bonded to, the flat porphyrin ring system, and (d) two perpendicular to it. [(c) Data from PDB ID 1CCR, H. Ochi et al., J. Mol. Biol. 166:407, 1983.]
Iron in the state binds oxygen reversibly; in the state it does not bind oxygen. The structure of heme and the globins to which it is bound represents an evolutionary adaptation to prevent oxidation. Free heme molecules (heme not bound to protein) leave with two “open” coordination bonds. Simultaneous reaction of one molecule with two free heme molecules (or two free ) can result in irreversible conversion of to . The coordinated nitrogen atoms (which have an electron-donating character) help prevent conversion of the heme iron to the ferric state. In heme-containing proteins, this reaction is further prevented by sequestering each heme deep within the protein structure. Thus, access to the two open coordination bonds is restricted. In the globins that will shortly become the focus of our narrative, one of these two coordination bonds is occupied by a side-chain nitrogen of a highly conserved His residue referred to as the proximal His. The other is the binding site for molecular oxygen (Fig. 5-2). When oxygen binds, the electronic properties of heme iron change; this accounts for the change in color from the dark purple of oxygen-depleted venous blood to the bright red of oxygen-rich arterial blood. Some small molecules, such as carbon monoxide (CO) and nitric oxide (NO), coordinate to heme iron with greater affinity than does . When a molecule of CO is bound to heme, is excluded, which is why CO is highly toxic to aerobic organisms (a topic explored in Box 5-1). By surrounding and sequestering heme, oxygen-binding proteins regulate the access of small molecules to the heme iron.
 Iron in the state binds oxygen reversibly; in the state it does not bind oxygen. The structure of heme and the globins to which it is bound represents an evolutionary adaptation to prevent oxidation. Free heme molecules (heme not bound to protein) leave with two “open” coordination bonds. Simultaneous reaction of one molecule with two free heme molecules (or two free ) can result in irreversible conversion of to . The coordinated nitrogen atoms (which have an electron-donating character) help prevent conversion of the heme iron to the ferric state. In heme-containing proteins, this reaction is further prevented by sequestering each heme deep within the protein structure. Thus, access to the two open coordination bonds is restricted. In the globins that will shortly become the focus of our narrative, one of these two coordination bonds is occupied by a side-chain nitrogen of a highly conserved His residue referred to as the proximal His.
  The other is the binding site for molecular oxygen (
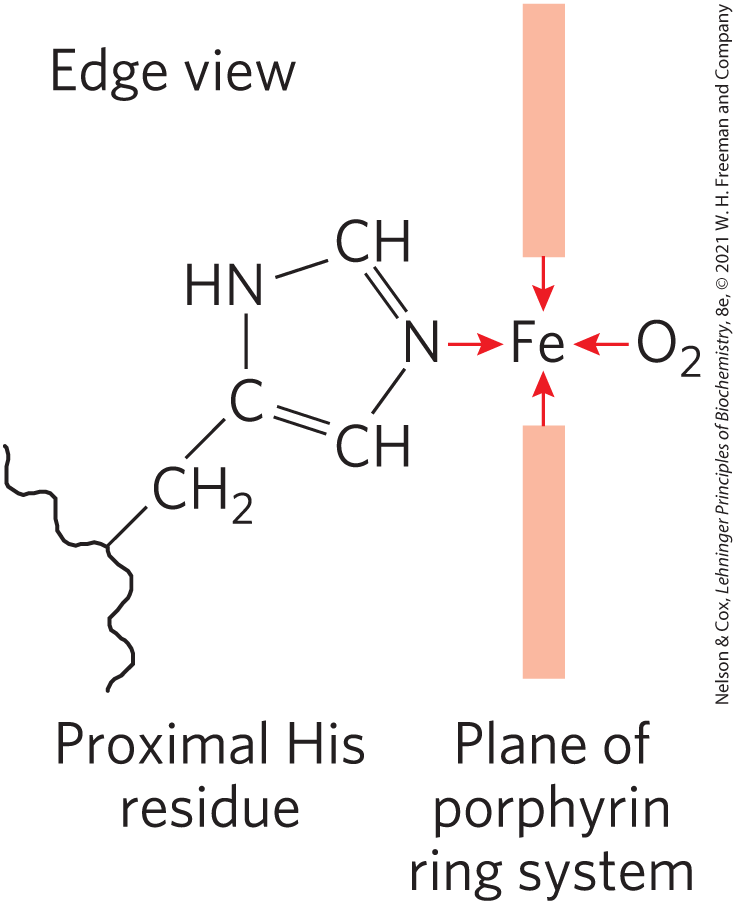
FIGURE 5-2 The heme group viewed from the side. This view shows the two coordination bonds to that are perpendicular to the porphyrin ring system. One is occupied by a His residue called the proximal His, in myoglobin, also designated His F8 (the eighth residue in α helix F; see Fig. 5-3); the other is the binding site for oxygen. The remaining four coordination bonds are in the plane of, and bonded to, the flat porphyrin ring system.
Globins Are a Family of Oxygen-Binding Proteins
The globins are a widespread family of proteins. Globins are commonly found in eukaryotes of all classes, as well as in archaea and bacteria. All evolved from a common ancestral protein. Their tertiary structure is highly conserved, made up of eight α-helical segments connected by bends. This folding pattern, illustrated by myoglobin (Fig. 5-3), constitutes a structural motif known as the globin fold. The primary amino acid sequence of globins is less conserved, well reflecting both the ancient origins of this protein family and the evolutionary relatedness of species from which globin comparisons might be made.
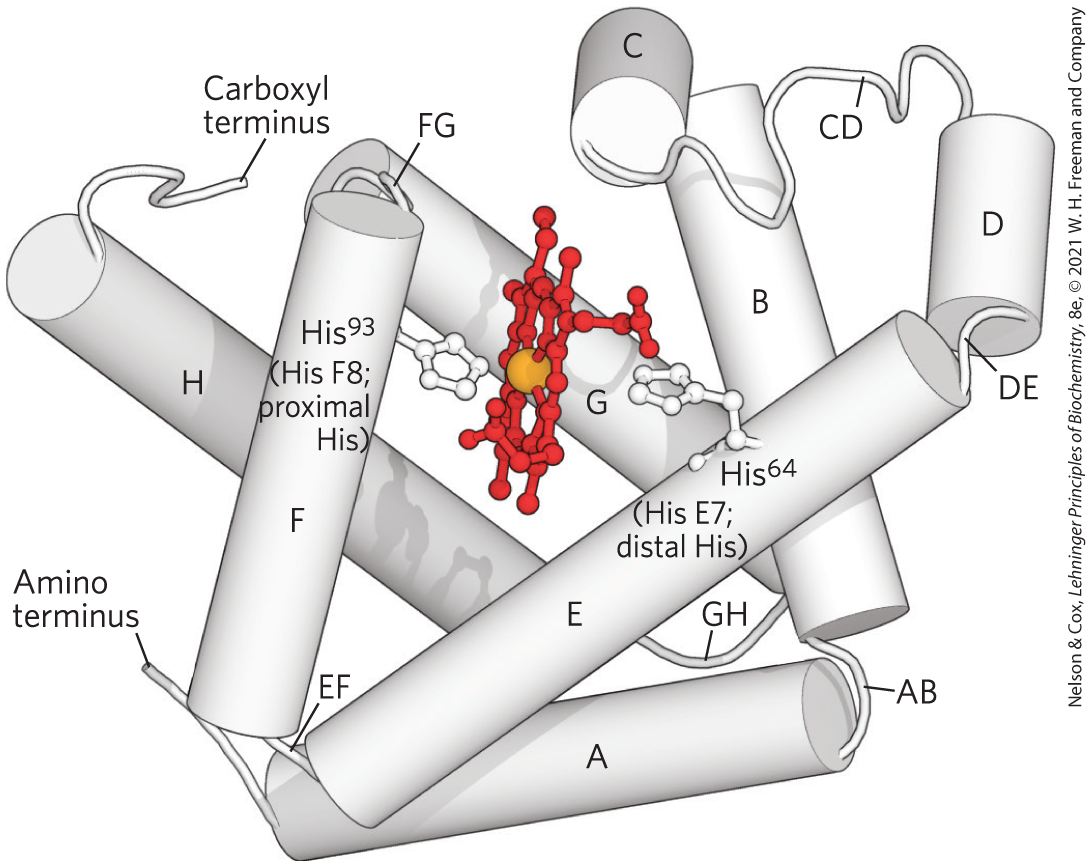
FIGURE 5-3 Myoglobin. The eight α-helical segments (shown here as cylinders) are labeled A through H. Nonhelical residues in the bends that connect them are labeled AB, CD, EF, and so forth, indicating the segments they interconnect. A few bends, including BC and DE, are abrupt and do not contain any residues; these are sometimes not labeled. The heme is bound in a pocket made up largely of the E and F helices, although amino acid residues from other segments of the protein also participate. [Data from PDB ID 1MBO, S. E. Phillips, J. Mol. Biol. 142:531, 1980.]
Most globins function in oxygen transport or storage, although some play a role in the sensing of oxygen, nitric oxide, or carbon monoxide. The simple nematode worm Caenorhabditis elegans has genes encoding 33 different globins. In humans and other mammals, there are at least four kinds of globins. The monomeric myoglobin facilitates oxygen diffusion in muscle tissue. Myoglobin is particularly abundant in the muscles of diving marine mammals such as seals and whales, where it also has an oxygen-storage function for prolonged excursions undersea. The tetrameric hemoglobin is responsible for oxygen transport in the bloodstream. The monomeric neuroglobin is expressed largely in neurons and helps to protect the brain from hypoxia (low oxygen) or ischemia (restricted blood supply). Cytoglobin, another monomeric globin, is found at high concentrations in the walls of blood vessels, where it functions to regulate levels of nitric oxide, a localized signal for muscle relaxation (see Box 12-2).
Myoglobin Has a Single Binding Site for Oxygen
Any detailed discussion of protein function inevitably involves protein structure. Myoglobin ( 16,700; abbreviated Mb) is a single polypeptide of 153 amino acid residues with one molecule of heme (Fig. 5-3). About 78% of the amino acid residues in the protein are found in the eight α helices typical of the globin fold, named A through H.
An individual amino acid residue is designated either by its position in the amino acid sequence or by its location in the sequence of a particular α-helical segment. For example, the His residue coordinated to the heme in myoglobin — the proximal His — is (the ninety-third residue from the amino-terminal end of the myoglobin polypeptide sequence) and is also called His F8 (the eighth residue in α helix F). The bends in the structure are designated AB, CD, EF, FG, and GH, reflecting the α-helical segments they connect.
Protein-Ligand Interactions Can Be Described Quantitatively
The function of myoglobin depends on the protein’s ability not only to bind oxygen but also to release it when and where it is needed. Function in biochemistry often revolves around a reversible protein-ligand interaction of this type. A quantitative description of this interaction is a central part of many biochemical investigations.
In general, the reversible binding of a protein (P) to a ligand (L) can be described by a simple equilibrium expression:
(5-1)
The reaction is characterized by an equilibrium constant, , such that
(5-2)
where and are rate constants (more on these below). The term is an association constant (not to be confused with the that denotes an acid dissociation constant; p. 57) that describes the equilibrium between the complex and the unbound components of the complex. The association constant provides a measure of the affinity of the ligand L for the protein. has units of ; a higher value of corresponds to a higher affinity of the ligand for the protein.
The equilibrium term is also equivalent to the ratio of the rates of the forward (association) and reverse (dissociation) reactions that form the PL complex. The association rate is described by the rate constant , and dissociation is described by the rate constant . As discussed further in the next chapter, rate constants are proportionality constants, describing the fraction of a pool of reactant that reacts in a given amount of time. When the reaction involves one molecule, such as the dissociation reaction PL → P + L, the reaction is first order and the rate constant has units of reciprocal time . When the reaction involves two molecules, such as the association reaction P + L → PL, it is called second order, and its rate constant has units of .
Key convention
Equilibrium constants are denoted with a capital K and rate constants are denoted with a lowercase k.

A rearrangement of the first part of Equation 5-2 shows that the ratio of bound to free protein is directly proportional to the concentration of free ligand:
(5-3)
When the concentration of the ligand is much greater than the concentration of ligand-binding sites, the binding of the ligand by the protein does not appreciably change the concentration of free (unbound) ligand — that is, [L] remains constant. This condition is broadly applicable to most ligands that bind to proteins in cells, and it simplifies our description of the binding equilibrium.
We can now consider the binding equilibrium from the standpoint of the fraction, Y, of ligand-binding sites on the protein that are occupied by ligand:
(5-4)
Substituting [L][P] for [PL] (see Eqn 5-3) and rearranging terms gives
(5-5)
The value of can be determined from a plot of Y versus the concentration of free ligand, [L] (Fig. 5-4a). Any equation of the form x = y/(y + z) describes a hyperbola, and Y is thus found to be a hyperbolic function of [L]. The fraction of ligand-binding sites occupied approaches saturation asymptotically as [L] increases. The [L] at which half of the available ligand-binding sites are occupied (that is, Y = 0.5) corresponds to .
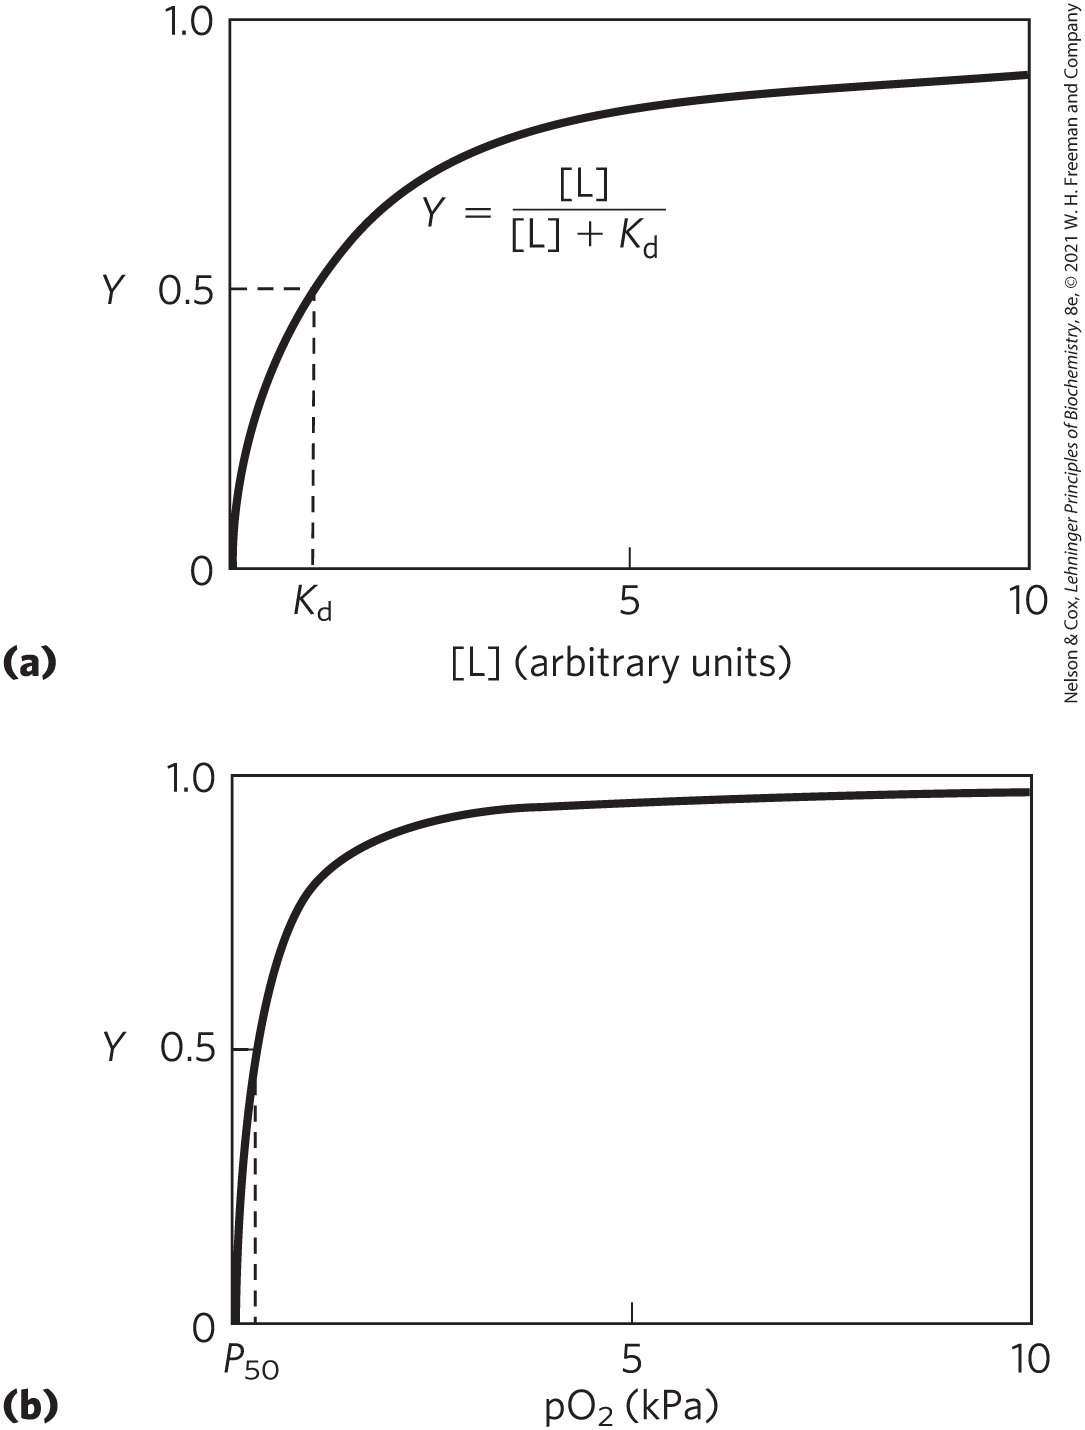
FIGURE 5-4 Graphical representations of ligand binding. The fraction of ligand-binding sites occupied, Y, is plotted against the concentration of free ligand. Both curves are rectangular hyperbolas. (a) A hypothetical binding curve for a ligand L. The [L] at which half of the available ligand-binding sites are occupied is equivalent to , or . The curve has a horizontal asymptote at Y = 1 and a vertical asymptote (not shown) at . (b) A curve describing the binding of oxygen to myoglobin. The partial pressure of in the air above the solution is expressed in kilopascals (kPa). Oxygen binds tightly to myoglobin, with a of only 0.26 kPa.
It is more common (and intuitively simpler), however, to consider the dissociation constant, , which is the reciprocal of and has units of molar concentration (m). is the equilibrium constant for the release of ligand. The relevant expressions change to
(5-6)
(5-7)
(5-8)
When [L] equals , half of the ligand-binding sites are occupied. As [L] falls below , progressively less of the protein has ligand bound to it. For 90% of the available ligand-binding sites to be occupied, [L] must be nine times greater than .
In practice, is used much more often than to express the affinity of a protein for a ligand. Note that a lower value of corresponds to a higher affinity of ligand for the protein. The mathematics can be reduced to simple statements: is equivalent to the molar concentration of ligand at which half of the available ligand-binding sites are occupied. At this point, the protein is said to have reached half-saturation with respect to ligand binding. The more tightly a protein binds a ligand, the lower the concentration of ligand required for half the binding sites to be occupied, and thus the lower the value of . Some representative dissociation constants are given in Table 5-1; the scale shows typical ranges for dissociation constants found in biological systems.
| Protein | Ligand | (M)a |
|---|---|---|
Avidin (egg white) |
Biotin |
|
Insulin receptor (human) |
Insulin |
|
Anti-HIV immunoglobulin (human)b |
gp41 (HIV-1 surface protein) |
|
Nickel-binding protein (E. coli) |
||
Calmodulin (rat)c |
||
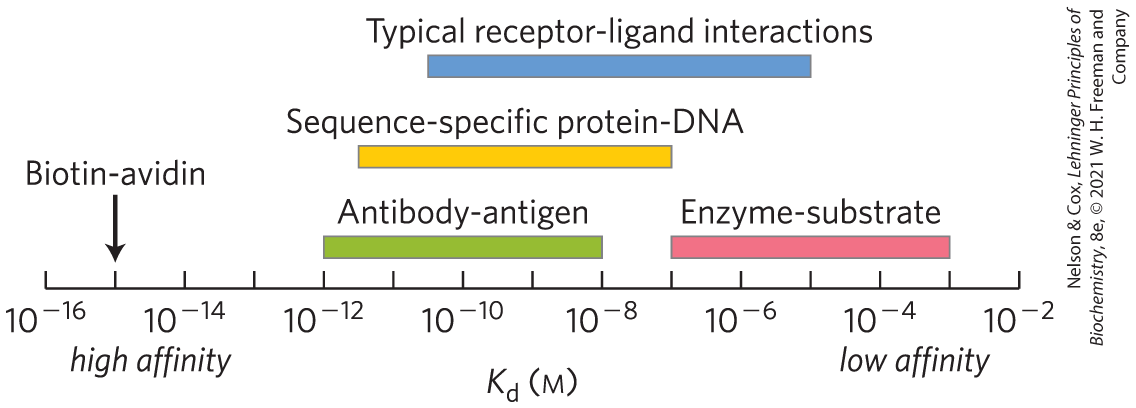
Color bars indicate the range of dissociation constants typical of various classes of interactions in biological systems. A few interactions, such as that between the protein avidin and the enzyme cofactor biotin, fall outside the normal ranges. The avidin-biotin interaction is so tight it may be considered irreversible. Sequence-specific protein-DNA interactions reflect proteins that bind to a particular sequence of nucleotides in DNA, as opposed to general binding to any DNA site. |
||
|
aA reported dissociation constant is valid only for the particular solution conditions under which it was measured. values for a protein-ligand interaction can be altered, sometimes by several orders of magnitude, by changes in the solution’s salt concentration, pH, or other variables. bThis immunoglobulin was isolated as part of an effort to develop a vaccine against HIV. Immunoglobulins (described later in the chapter) are highly variable, and the reported here should not be considered characteristic of all immunoglobulins. cCalmodulin has four binding sites for calcium. The values shown reflect the highest- and lowest-affinity binding sites observed in one set of measurements. |
||
WORKED EXAMPLE 5-1 Receptor-Ligand Dissociation Constants
Two proteins, A and B, bind to the same ligand, L, with the binding curves shown below. What is the dissociation constant, , for each protein? Which protein (A or B) has a greater affinity for ligand L?
![A graph plotting Y against [L] compares the binding curves of two proteins with the same ligand.](../images/8e_05_un01_288604.png)
SOLUTION:
We can determine the dissociation constants by inspecting the graph. Because Y represents the fraction of binding sites occupied by ligand, the concentration of ligand at which half the binding sites are occupied — that is, the point where the binding curve crosses the line where Y = 0.5 — is the dissociation constant. For A, ; for B, . Because A is half-saturated at a lower [L], it has a higher affinity for the ligand.
WORKED EXAMPLE 5-2 Protein-Ligand Binding
A protein has a of 2.0 μm. What is the [L] where Y = 0.6?
SOLUTION:
Solving Equation 5-8 for [L], first we obtain
Distributing Y on the right side gives
Subtracting Y[L] from both sides
then factoring out [L]
and dividing both sides by 1 − Y gives the final expression
Substituting the values for Y and given in the problem gives
The binding of oxygen to myoglobin follows the patterns discussed above. However, because oxygen is a gas, we must make some minor adjustments to the equations so that laboratory experiments can be carried out more conveniently. We first substitute the concentration of dissolved oxygen for [L] in Equation 5-8 to give
(5-9)
As for any ligand, equals the at which half of the available ligand-binding sites are occupied, or . Equation 5-9 thus becomes
(5-10)
In experiments using oxygen as a ligand, it is the partial pressure of oxygen in the gas phase above the solution that is varied, because this is easier to measure than the concentration of oxygen dissolved in the solution. The concentration of a volatile substance in solution is always proportional to the local partial pressure of the gas. So, if we define the partial pressure of oxygen at as , substitution in Equation 5-10 gives
(5-11)
A binding curve for myoglobin that relates Y to is shown in Figure 5-4b.
Protein Structure Affects How Ligands Bind
The binding of a ligand to a protein is rarely as simple as the above equations would suggest. The interaction is greatly affected by protein structure and is often accompanied by conformational changes. For example, the specificity with which heme binds its various ligands is altered when the heme is a component of myoglobin. For free heme molecules, carbon monoxide binds more than 20,000 times better than does (that is, the or for CO binding to free heme is more than 20,000 times lower than that for ), but it binds only about 40 times better than when the heme is bound in myoglobin. For free heme, the tighter binding by CO reflects differences in the way the orbital structures of CO and interact with . Those same orbital structures lead to different binding geometries for CO and when they are bound to heme (Fig. 5-5a, b). The change in relative affinity of CO and for heme when the heme is bound to a globin is mediated by the globin structure.
 The binding of a ligand to a protein is rarely as simple as the above equations would suggest. The interaction is greatly affected by protein structure and is often accompanied by conformational changes. For example, the specificity with which heme binds its various ligands is altered when the heme is a component of myoglobin. For free heme molecules, carbon monoxide binds more than 20,000 times better than does (that is, the or for CO binding to free heme is more than 20,000 times lower than that for ), but it binds only about 40 times better than when the heme is bound in myoglobin. For free heme, the tighter binding by CO reflects differences in the way the orbital structures of CO and interact with . Those same orbital structures lead to different binding geometries for CO and when they are bound to heme (
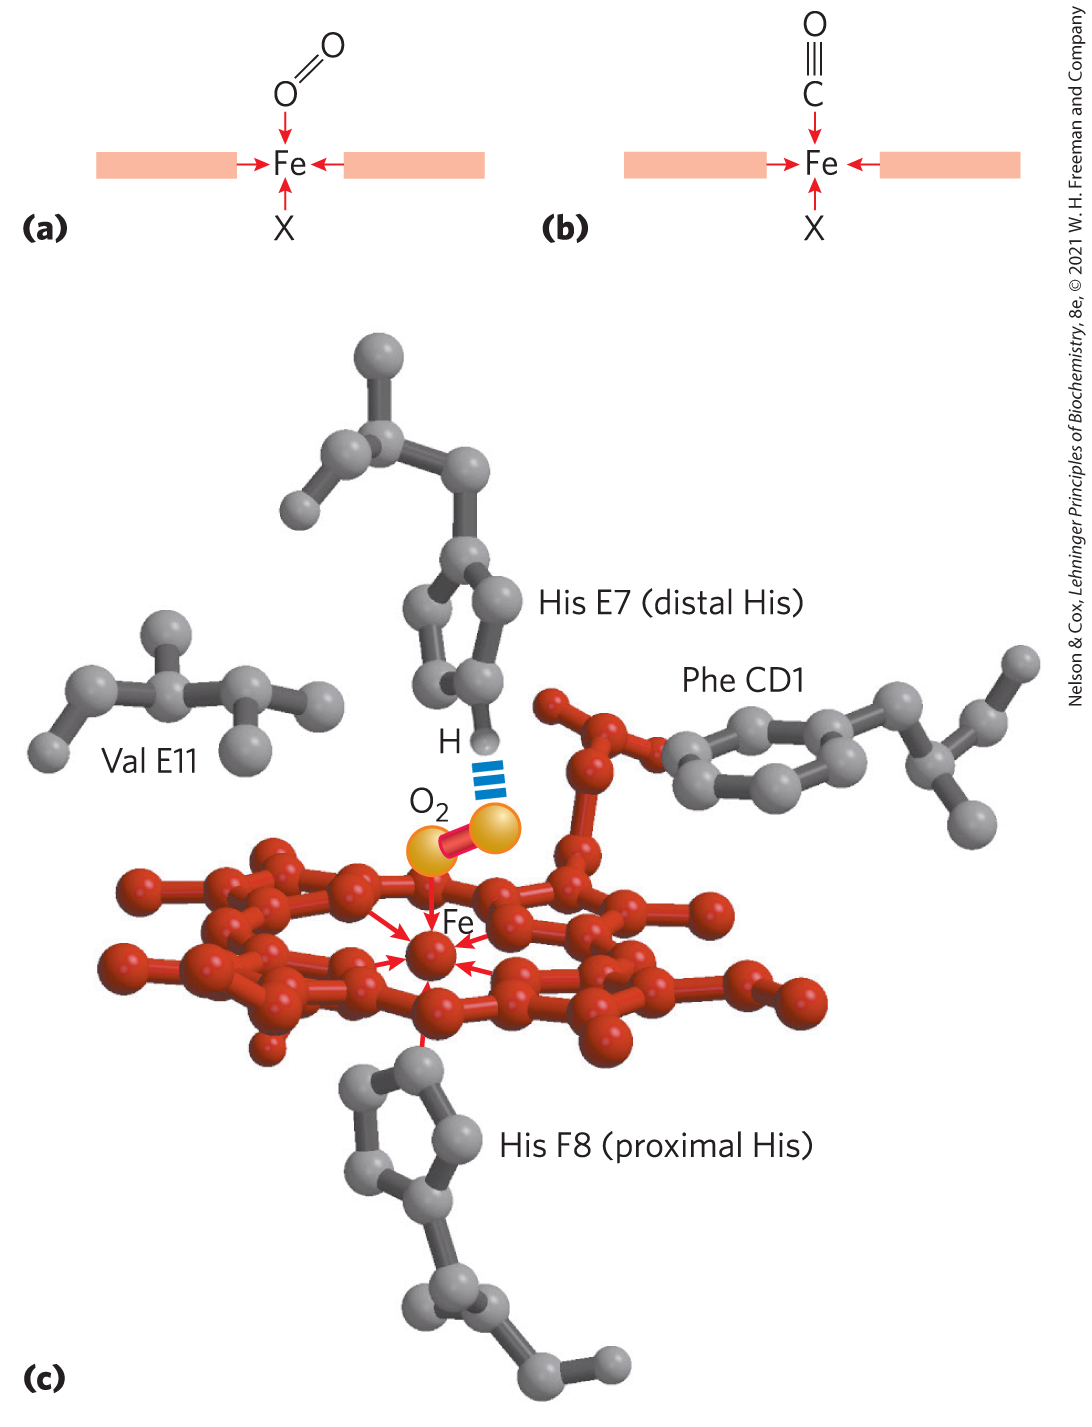
FIGURE 5-5 Steric effects caused by ligand binding to the heme of myoglobin. (a) Oxygen binds to heme with the axis at an angle, a binding conformation readily accommodated by myoglobin. (b) Carbon monoxide binds to free heme with the CO axis perpendicular to the plane of the porphyrin ring. (c) Another view of the heme of myoglobin, showing the arrangement of key amino acid residues around the heme. The bound is hydrogen-bonded to the distal His, His E7 (), facilitating the binding of compared with its binding to free heme. [(c) Data from PDB ID 1MBO, S. E. Phillips, J. Mol. Biol. 142:531, 1980.]
When heme is bound to myoglobin, its affinity for is selectively increased by the presence of the distal His (, or His E7 in myoglobin). The Fe- complex is much more polar than the Fe-CO complex. A partial negative charge is distributed across the oxygen atoms in the bound due to partial oxidation of the interacting iron atom. A hydrogen bond between the imidazole side chain of His E7 and the bound stabilizes this polar complex electrostatically (Fig. 5-5c). The affinity of myoglobin for is thus selectively increased by a factor of about 500; there is no such effect for Fe-CO binding in myoglobin. Consequently, the 20,000-fold stronger binding affinity of free heme for CO compared with declines to approximately 40-fold for heme embedded in myoglobin. This favorable electrostatic effect on binding is even more dramatic in some invertebrate hemoglobins, where two groups in the binding pocket can form strong hydrogen bonds with , causing the heme group to bind with greater affinity than CO. This selective enhancement of affinity in globins is physiologically important: it helps prevent poisoning by the CO that is generated in small amounts from metabolism and that is sometimes generated in larger amounts by our industrial-age environment.
The binding of to the heme in myoglobin also depends on molecular motions, or “breathing,” in the protein structure. The heme molecule is deeply buried in the folded polypeptide, with limited direct paths for oxygen to move from the surrounding solution to the ligand-binding site. If the protein were rigid, could not readily enter or leave the heme pocket. However, rapid molecular flexing of the amino acid side chains produces transient cavities in the protein structure, and makes its way in and out by moving through these cavities. Computer simulations of rapid structural fluctuations in myoglobin suggest that there are many such pathways. The distal His acts as a gate to control access to one major pocket near the heme iron. Rotation of that His residue to open and close the pocket occurs on a nanosecond () time scale.
Thus, subtle conformational changes can be critical for protein activity. Structural changes take on more complexity in the multisubunit hemoglobin, which we consider next.
Hemoglobin Transports Oxygen in Blood
Nearly all the oxygen carried by whole blood in animals is bound and transported by hemoglobin in erythrocytes (red blood cells). Normal human erythrocytes are small (6 to 9 μm in diameter), biconcave disks. They are formed from precursor stem cells called hemocytoblasts. In the maturation process, the stem cell produces daughter cells that form large amounts of hemoglobin and then lose their organelles — nucleus, mitochondria, and endoplasmic reticulum. Erythrocytes are thus incomplete, vestigial cells, unable to reproduce and, in humans, destined to survive for only about 120 days. Their main function is to carry hemoglobin, which is dissolved in the cytosol at a very high concentration (~34% by weight).
In arterial blood passing from the lungs through the heart to the peripheral tissues, hemoglobin is about 96% saturated with oxygen. In the venous blood returning to the heart, hemoglobin is only about 64% saturated. Thus, each 100 mL of blood passing through a tissue releases about one-third of the oxygen it carries, or 6.5 mL of gas at atmospheric pressure and body temperature.
Myoglobin, with its hyperbolic binding curve for oxygen (Fig. 5-4b), is relatively insensitive to small changes in the concentration of dissolved oxygen, so it functions well as an oxygen-storage protein. Hemoglobin, with its multiple subunits and -binding sites, is better suited to oxygen transport. As we shall see, interactions between the subunits of a multimeric protein can permit a highly sensitive response to small changes in ligand concentration. Interactions among the subunits in hemoglobin cause conformational changes that alter the affinity of the protein for oxygen. The modulation of oxygen binding allows the -transport protein to respond to changes in oxygen demand by tissues.
 Interactions among the subunits in hemoglobin cause conformational changes that alter the affinity of the protein for oxygen. The modulation of oxygen binding allows the -transport protein to respond to changes in oxygen demand by tissues.
Hemoglobin Subunits Are Structurally Similar to Myoglobin
Hemoglobin ( 64,500; abbreviated Hb) is roughly spherical, with a diameter of nearly 5.5 nm. It is a tetrameric protein containing four heme prosthetic groups, one associated with each polypeptide chain. Adult hemoglobin contains two types of globin: two α chains (141 residues each) and two β chains (146 residues each). The three-dimensional structures of the two types of subunits are very similar to each other and to myoglobin (Fig. 5-6), reflecting their evolution within the larger globin superfamily. However, fewer than half of the amino acid residues are identical in the polypeptide sequences of the α and β subunits, and only 27 are identical in the three polypeptides (Fig. 5-7). The helix-naming convention described for myoglobin is also applied to the hemoglobin polypeptides, except that the α subunit lacks the short D helix. The heme-binding pocket is made up largely of the E and F helices in each of the subunits.
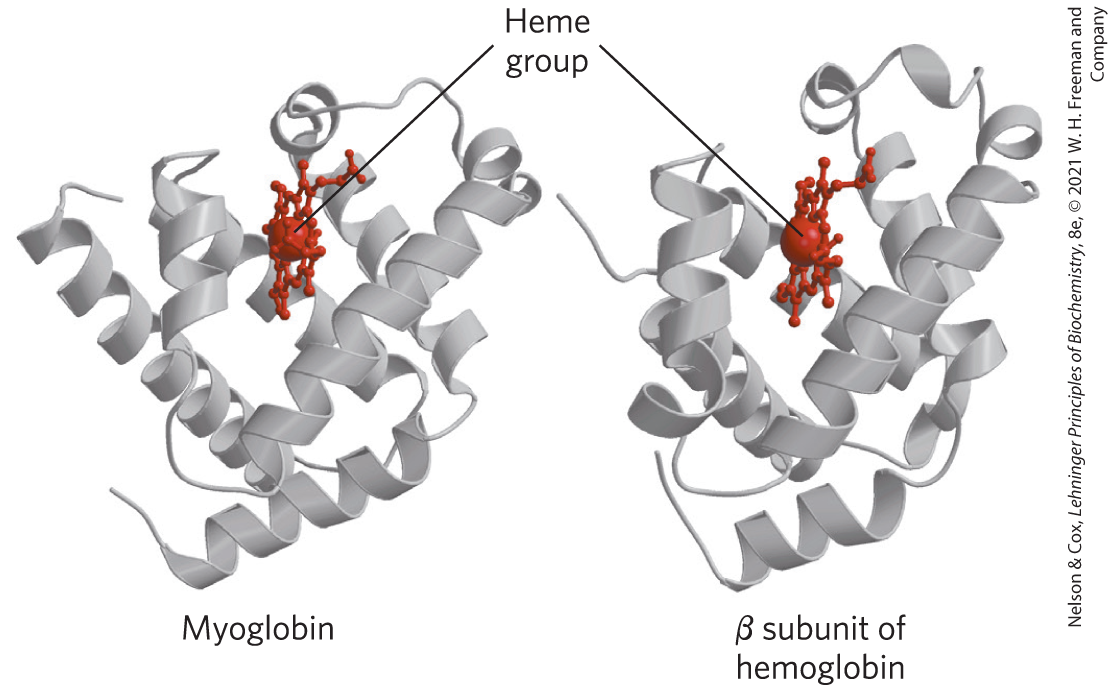
FIGURE 5-6 Comparison of the structures of myoglobin and the β subunit of hemoglobin. [Data from (left) PDB ID 1MBO, S. E. Phillips, J. Mol. Biol. 142:531, 1980; (right) PDB ID 1HGA, R. Liddington et al., J. Mol. Biol. 228:551, 1992.]
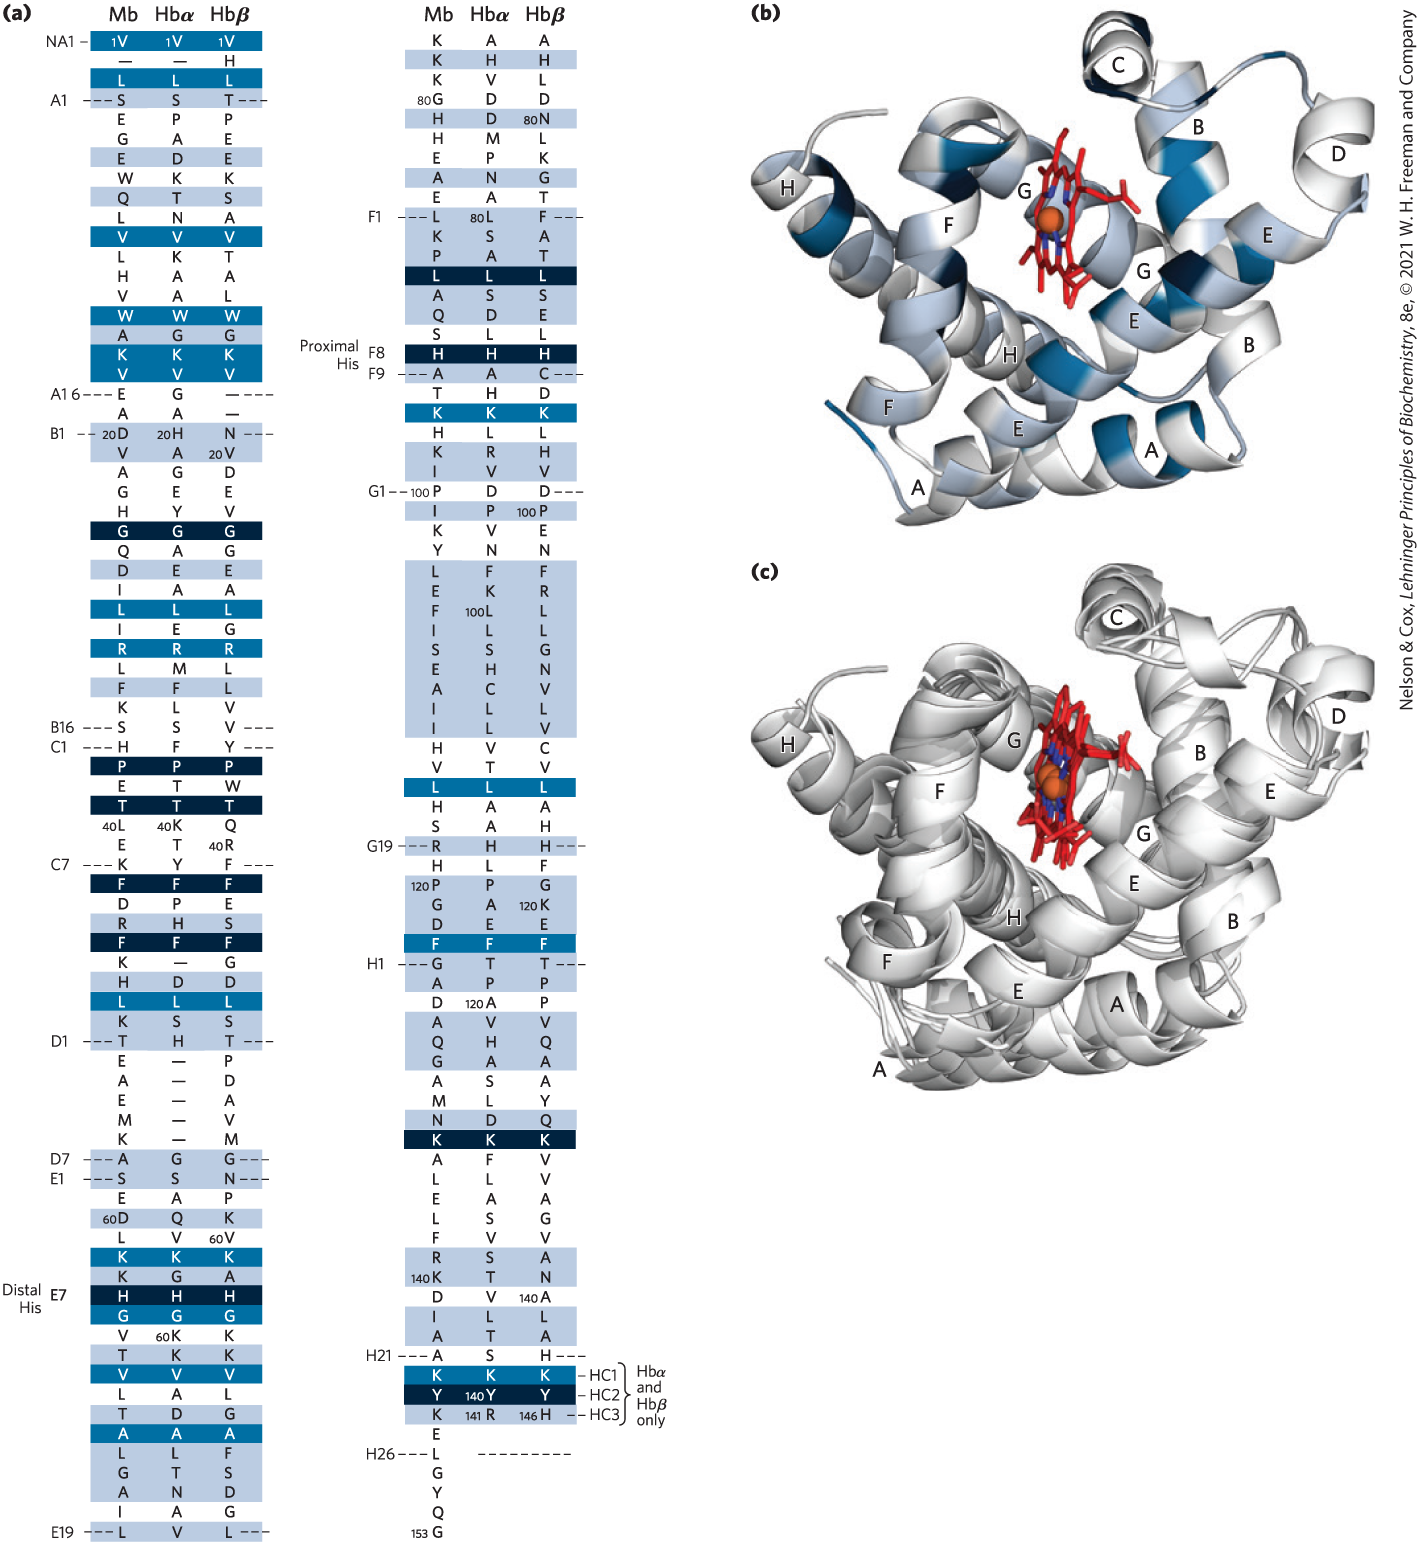
FIGURE 5-7 Comparison of whale myoglobin with the α and β chains of human hemoglobin. (a) Sequence alignment with dashed lines marking helix boundaries. For optimal alignment, short gaps are introduced into both Hb sequences where a few amino acids are present in the other sequences. With the exception of the missing D helix in the Hb α chain (Hbα), this alignment permits the use of the helix lettering convention that emphasizes the common positioning of amino acid residues. Residues conserved in all known globins are shaded black. Residues conserved in the three globins shown here are shaded dark blue. Positions where the amino acid class (hydrophobic, charged, etc.) is conserved are shaded light blue. The common helix-letter-and-number designation for amino acids does not necessarily correspond to a common position in the linear sequence. For example, the distal His residue is His E7 in all three structures, but corresponds to , , and in the linear sequences of Mb, Hbα, and Hbβ, respectively. Nonhelical residues at the amino and carboxyl termini are labeled NA and HC, respectively. (b) The location of shaded residues is shown in a ribbon representation of myoglobin structure. (c) Ribbon representations of the three globin structures are overlaid to show structural conservation. [Data from PDB ID 1MBO, S. E. Phillips, J. Mol. Biol. 142:531, 1980; PDB ID 1HGA, R. Liddington et al., J. Mol. Biol. 228:551, 1992.]
The quaternary structure of hemoglobin features strong interactions between unlike subunits. The interface (and its counterpart) involves more than 30 residues, and its interaction is sufficiently strong that although mild treatment of hemoglobin with urea tends to disassemble the tetramer into αβ dimers, these dimers remain intact. The (and ) interface involves 19 residues (Fig. 5-8). The hydrophobic effect plays the major role in stabilizing these interfaces, but there are also many hydrogen bonds and a few ion pairs (or salt bridges), whose importance is discussed below.
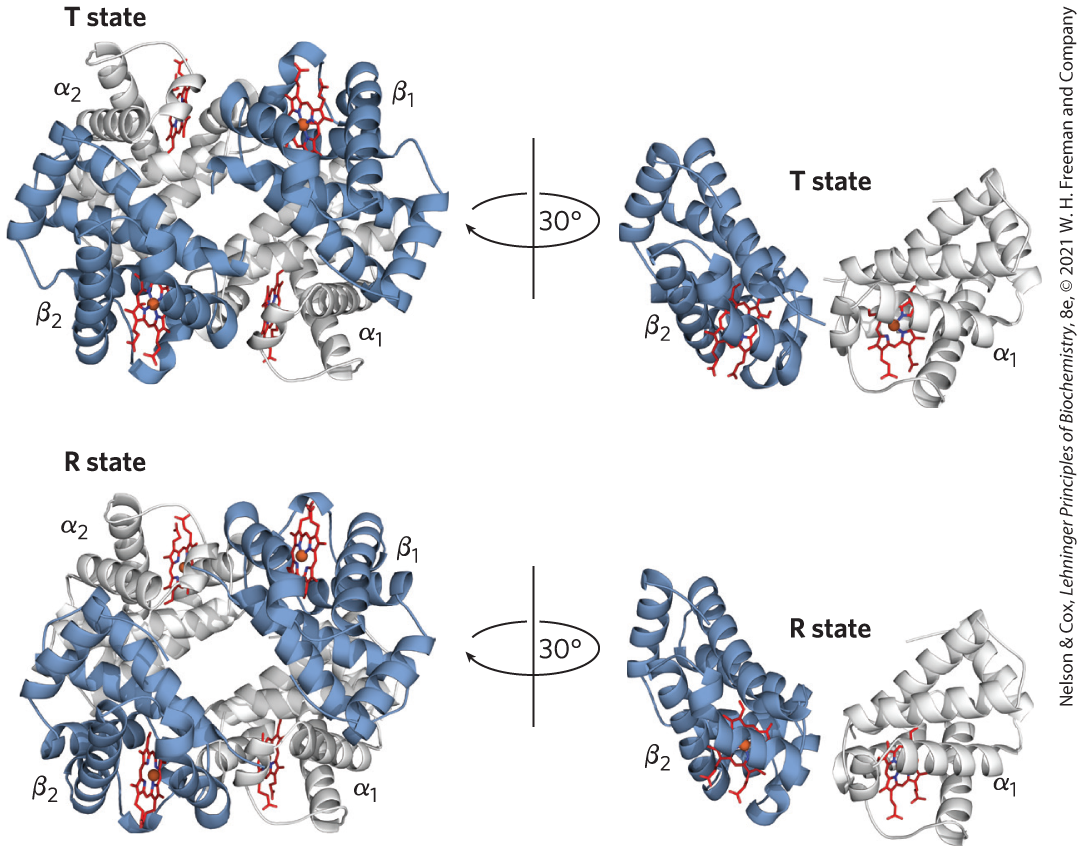
FIGURE 5-8 Dominant interactions between hemoglobin subunits. In this representation, α subunits are light and β subunits are dark. The strongest subunit interactions (highlighted) occur between unlike subunits. When oxygen binds, the contact changes little, but there is a large change at the contact, with several ion pairs broken. [Data from PDB ID 1HGA, R. Liddington et al., J. Mol. Biol. 228:551, 1992.]
Hemoglobin Undergoes a Structural Change on Binding Oxygen
X-ray analysis has revealed two major conformations of hemoglobin: the R state and the T state. Although oxygen binds to hemoglobin in either state, it has a significantly higher affinity for hemoglobin in the R state. Oxygen binding stabilizes the R state. When oxygen is absent experimentally, the T state is more stable and is thus the predominant conformation of deoxyhemoglobin. T and R originally denoted “tense” and “relaxed,” respectively, because the T state is stabilized by a greater number of ion pairs, many of which lie at the (and ) interface (Fig. 5-9). The binding of to a hemoglobin subunit in the T state triggers a change in conformation to the R state. When the entire protein undergoes this transition, the structures of the individual subunits change little, but the αβ subunit pairs slide past each other and rotate, narrowing the pocket between the β subunits (Fig. 5-10). In this process, some of the ion pairs that stabilize the T state are broken and some new ones are formed.
 X-ray analysis has revealed two major conformations of hemoglobin: the R state and the T state. Although oxygen binds to hemoglobin in either state, it has a significantly higher affinity for hemoglobin in the R state. Oxygen binding stabilizes the R state. When oxygen is absent experimentally, the T state is more stable and is thus the predominant conformation of deoxyhemoglobin. T and R originally denoted “tense” and “relaxed,” respectively, because the T state is stabilized by a greater number of ion pairs, many of which lie at the (and ) interface (
FIGURE 5-9 Some ion pairs that stabilize the T state of deoxyhemoglobin. Many of the ion pairs stabilizing the T state lie at the (and ) interface. Close-up view of a portion of a deoxyhemoglobin molecule in the T state. Interactions between the ion pairs His HC3 and Asp FG1 of the β subunit (blue) and between Lys C5 of the α subunit (gray) and His HC3 (its α-carboxyl group) of the β subunit are shown with dashed lines. (Recall that HC3 is the carboxyl-terminal residue of the β subunit.) These examples do not represent the entire network of ion pairs that stabilize the structure. [Data from PDB ID 1HGA, R. Liddington et al., J. Mol. Biol. 228:551, 1992.]
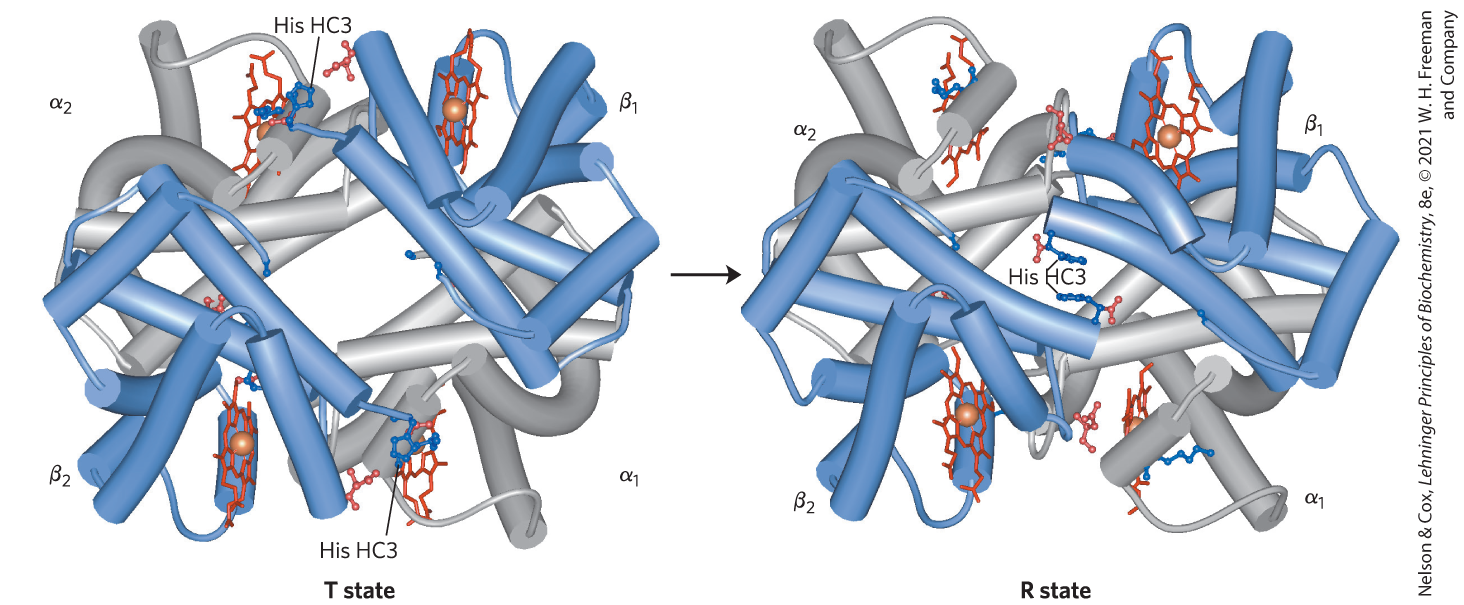
FIGURE 5-10 The T → R transition. In these depictions of deoxyhemoglobin, as in Figure 5-9, the β subunits are blue and the α subunits are gray. Positively charged side chains and chain termini involved in ion pairs are shown in blue, and their negatively charged partners are shown in red. The Lys C5 of each α subunit and the Asp FG1 of each β subunit are visible but are not labeled (compare Fig. 5-9). Note that the molecule is oriented slightly differently than in Figure 5-9. The transition from the T state to the R state shifts the subunit pairs substantially, affecting certain ion pairs. Most noticeably, the His HC3 residues at the carboxyl termini of the β subunits, which are involved in ion pairs in the T state, rotate in the R state toward the center of the molecule, where they are no longer in ion pairs. Another dramatic result of the T → R transition is a narrowing of the pocket between the β subunits. [T state: Data from PDB ID 1HGA, R. Liddington et al., J. Mol. Biol. 228:551, 1992. R state: Data from PDB ID 1BBB, M. M. Silva et al., J. Biol. Chem. 267:17,248, 1992.]
Max Perutz proposed that the T → R transition is triggered by changes in the positions of key amino acid side chains surrounding the heme. In the T state, the porphyrin is slightly puckered, causing the heme iron to protrude somewhat on the proximal His (His F8) side. The binding of causes the heme to assume a more planar conformation, shifting the position of the proximal His and the attached F helix (Fig. 5-11). These changes lead to adjustments in the ion pairs at the interface.
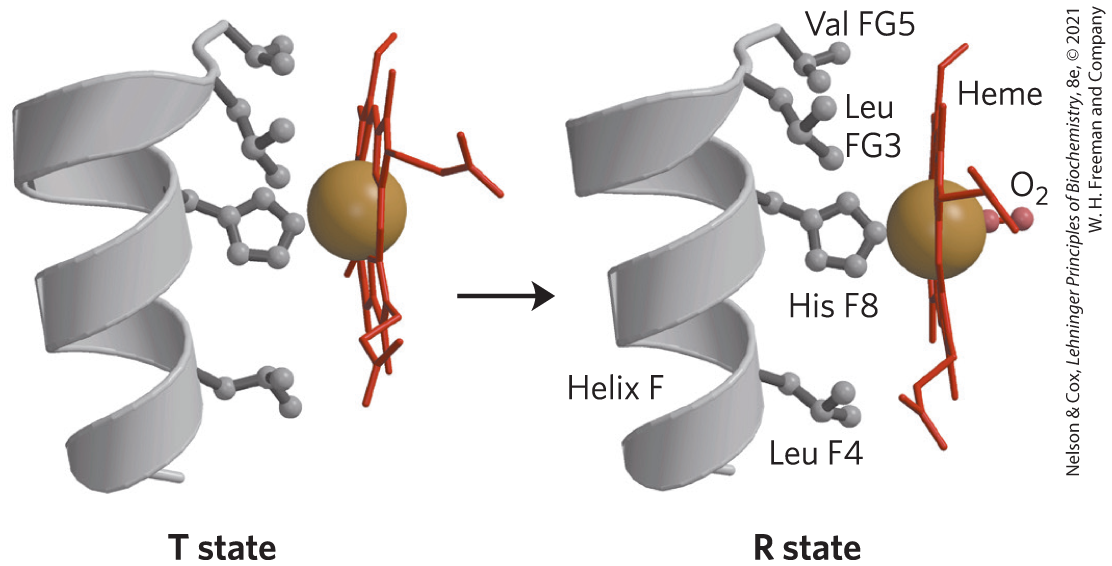
FIGURE 5-11 Changes in conformation near heme on binding to deoxyhemoglobin. The shift in the position of helix F when heme binds is thought to be one of the adjustments that triggers the T → R transition. [T state: Data from PDB ID 1HGA, R. Liddington et al., J. Mol. Biol. 228:551, 1992. R state: Data from PDB ID 1BBB, M. M. Silva et al., J. Biol. Chem. 267:17,248, 1992; R state modified to represent instead of CO.]
Hemoglobin Binds Oxygen Cooperatively
Hemoglobin must bind oxygen efficiently in the lungs, where the is about 13.3 kPa, and it must release oxygen in the tissues, where the is about 4 kPa. Myoglobin, or any protein that binds oxygen with a hyperbolic binding curve, would be ill-suited to this function, for the reason illustrated in Figure 5-12. A protein that bound with high affinity would bind it efficiently in the lungs but would not release much of it in the tissues. If the protein bound oxygen with a sufficiently low affinity to release it in the tissues, it would not pick up much oxygen in the lungs.
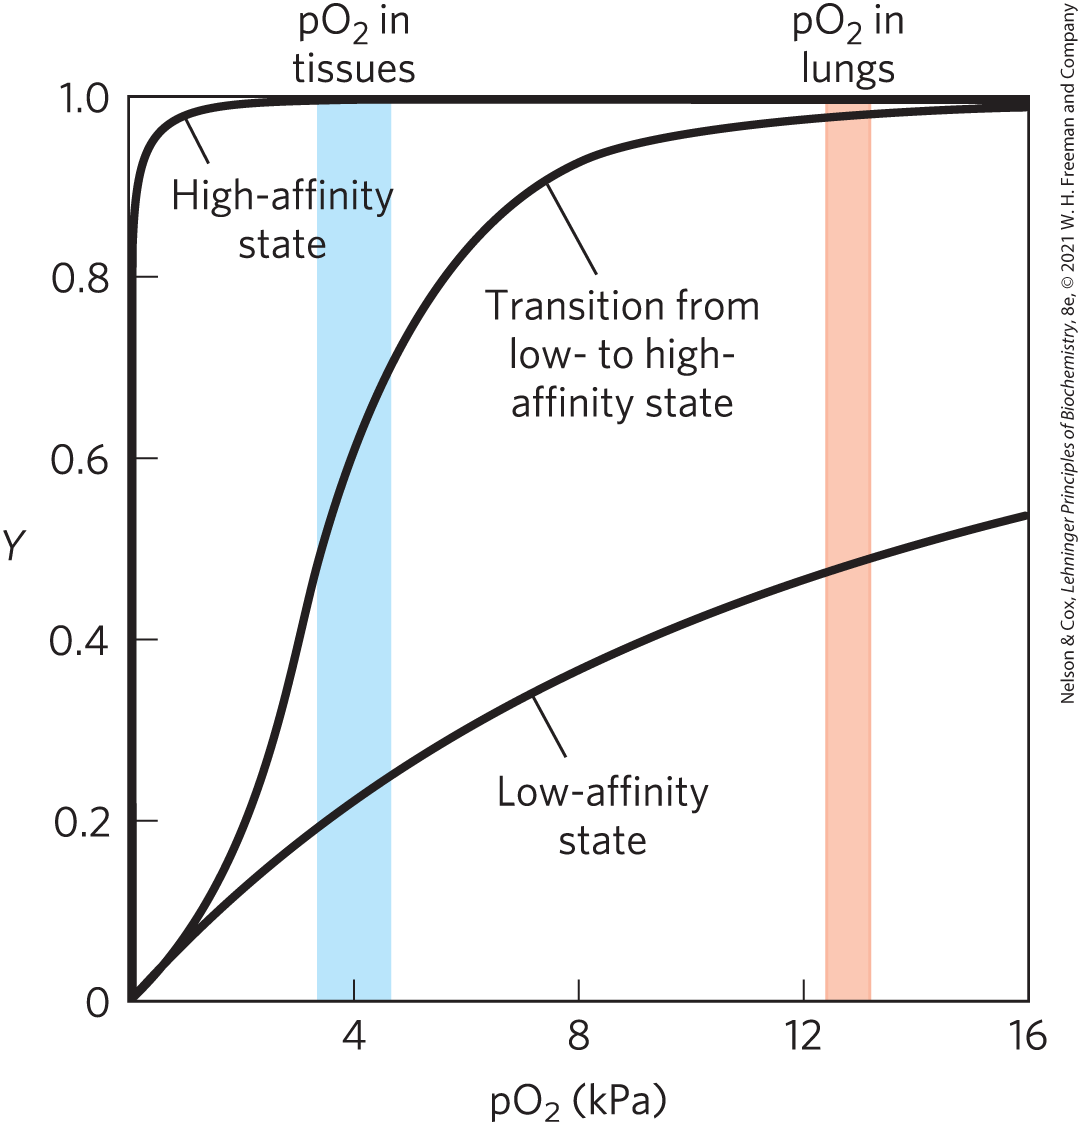
FIGURE 5-12 A sigmoid (cooperative) binding curve. A sigmoid binding curve can be viewed as a hybrid curve reflecting a transition from a low-affinity state to a high-affinity state. Because of its cooperative binding, as manifested by a sigmoid binding curve, hemoglobin is more sensitive to the small differences in concentration between the tissues and the lungs, allowing it to bind oxygen in the lungs (where is high) and release it in the tissues (where is low).
Hemoglobin solves the problem by undergoing a transition from a low-affinity state (the T state) to a high-affinity state (the R state) as more molecules are bound. As a result, hemoglobin has a hybrid S-shaped, or sigmoid, binding curve for oxygen (Fig. 5-12). A single-subunit protein with a single ligand-binding site cannot produce a sigmoid binding curve — even if binding elicits a conformational change — because each molecule of ligand binds independently and cannot affect ligand binding to another molecule. In contrast, binding to individual subunits of hemoglobin can alter the affinity for in adjacent subunits. The first molecule of that interacts with deoxyhemoglobin binds weakly, because it binds to a subunit in the T state. Its binding, however, leads to conformational changes that are communicated to adjacent subunits, making it easier for additional molecules of to bind. In effect, the T → R transition occurs more readily in the second subunit once is bound to the first subunit. The last (fourth) molecule binds to a heme in a subunit that is already in the R state, and hence it binds with much higher affinity than the first molecule.
An allosteric protein is one in which the binding of a ligand to one site affects the binding properties of another site on the same protein. The term “allosteric” derives from the Greek allos, “other,” and stereos, “solid” or “shape.” Allosteric proteins are those having “other shapes,” or conformations, induced by the binding of ligands referred to as modulators. The conformational changes induced by the modulator(s) interconvert more-active and less-active forms of the protein. The modulators for allosteric proteins may be either inhibitors or activators. When the normal ligand and modulator are identical, the interaction is termed homotropic. When the modulator is a molecule other than the normal ligand, the interaction is heterotropic. Some proteins have two or more modulators and therefore can have both homotropic and heterotropic interactions.
 Allosteric
Cooperative binding of a ligand to a multimeric protein, such as we observe with the binding of to hemoglobin, is a form of allosteric binding. The binding of one ligand affects the affinities of any remaining unfilled binding sites, and can be considered as both a ligand and an activating homotropic modulator. There is only one binding site for on each subunit, so the allosteric effects giving rise to cooperativity are mediated by conformational changes transmitted from one subunit to another by subunit-subunit interactions. A sigmoid binding curve is diagnostic of cooperative binding. It permits a much more sensitive response to ligand concentration and is important to the function of many multisubunit proteins. The principle of allostery extends readily to regulatory enzymes, as we shall see in Chapter 6.
As is the case with myoglobin, ligands other than oxygen can bind to hemoglobin. An important example is carbon monoxide, which binds to hemoglobin about 250 times better than does oxygen (the critical hydrogen bond between and the distal His is not quite as strong in human hemoglobin as it is in most mammalian myoglobins, so the binding of relative to CO is not augmented quite as much). Human exposure to CO can have tragic consequences (Box 5-1).
Cooperative Ligand Binding Can Be Described Quantitatively
Cooperative binding of oxygen by hemoglobin was first analyzed by Archibald Hill in 1910. From this work came a general approach to the study of cooperative ligand binding to multisubunit proteins.
For a protein with n binding sites, the equilibrium of Equation 5-1 becomes
(5-12)
and the expression for the association constant becomes
(5-13)
The expression for Y (see Eqn 5-8) is
(5-14)
Rearranging, then taking the log of both sides, yields
(5-15)
(5-16)
where
Equation 5-16 is the Hill equation, and a plot of log [Y/(1 − Y)] versus log [L] is called a Hill plot. Based on the equation, the Hill plot should have a slope of n. However, the experimentally determined slope actually reflects not the number of binding sites but the degree of interaction between them. The slope of a Hill plot is therefore denoted by , the Hill coefficient, which is a measure of the degree of cooperativity. If equals 1, ligand binding is not cooperative, a situation that can arise even in a multisubunit protein if the subunits do not communicate. An of greater than 1 indicates positive cooperativity in ligand binding. This is the situation observed in hemoglobin, in which the binding of one molecule of ligand facilitates the binding of others. The theoretical upper limit for is reached when . In this case the binding would be completely cooperative: all binding sites on the protein would bind ligand simultaneously, and no protein molecules partially saturated with ligand would be present under any conditions. This limit is never reached in practice, and the measured value of is always less than the actual number of ligand-binding sites in the protein.
An of less than 1 indicates negative cooperativity, in which the binding of one molecule of ligand impedes the binding of others. Well-documented cases of negative cooperativity are rare.
To adapt the Hill equation to the binding of oxygen to hemoglobin, we must again substitute for [L] and for :
(5-17)
Hill plots for myoglobin and hemoglobin are given in Figure 5-13.
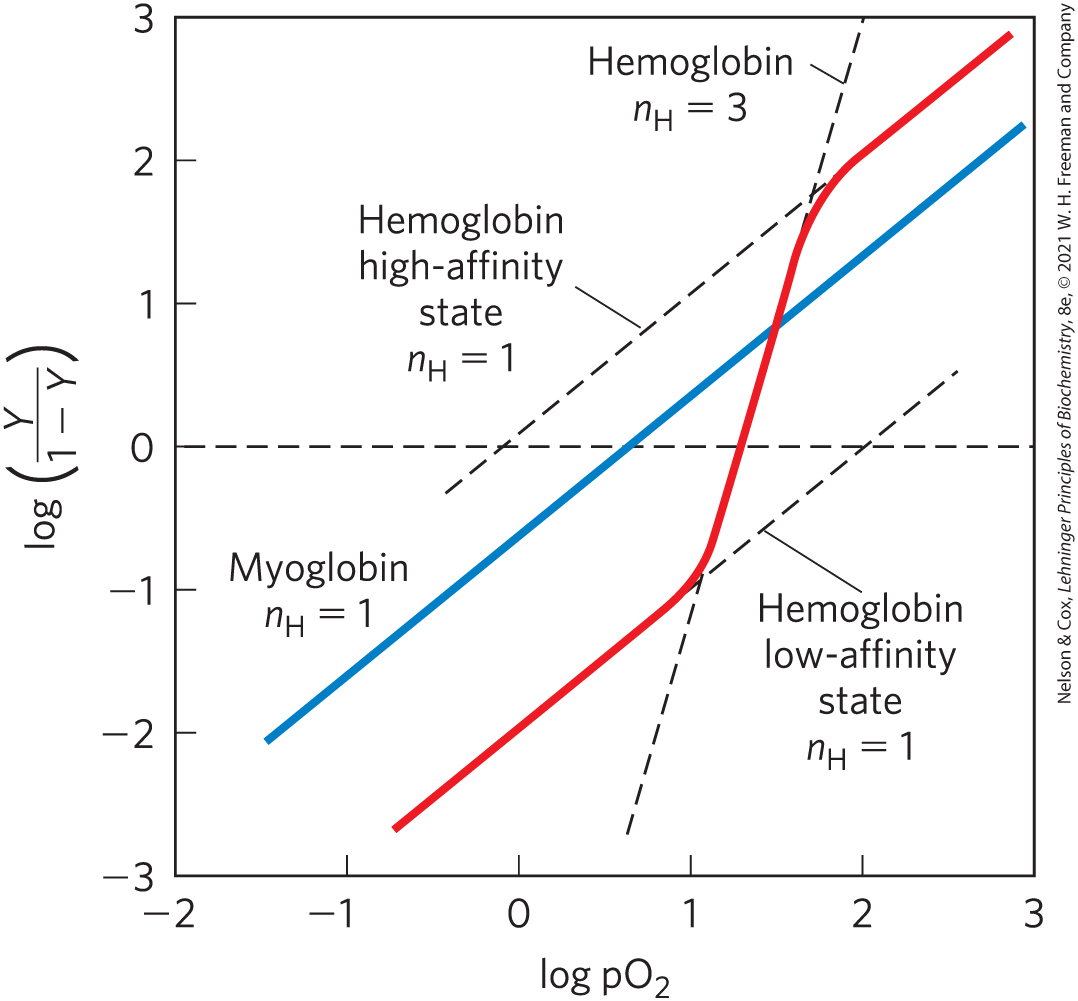
FIGURE 5-13 Hill plots for oxygen binding to myoglobin and hemoglobin. When , there is no evident cooperativity. The maximum degree of cooperativity observed for hemoglobin corresponds approximately to . Note that while this indicates a high level of cooperativity, is less than n, the number of -binding sites in hemoglobin. This is normal for a protein that exhibits allosteric binding behavior.
Two Models Suggest Mechanisms for Cooperative Binding
In a multisubunit ligand-binding protein like hemoglobin, how does the T → R transition occur? Two models for the cooperative binding of ligands to proteins with multiple binding sites have greatly influenced thinking about this problem, defining the two major possibilities.
The first model was proposed by Jacques Monod, Jeffries Wyman, and Jean-Pierre Changeux in 1965, and is called the MWC model or the concerted model (Fig. 5-14a). The concerted model assumes that the subunits of a cooperatively binding protein are functionally identical, that each subunit can exist in (at least) two conformations, and that all subunits undergo the transition from one conformation to the other simultaneously. In this model, no protein has individual subunits in different conformations. The two conformations are in equilibrium. The ligand can bind to either conformation, but it binds much more tightly to the R state. Successive binding of ligand molecules to the low-affinity T state (which is more stable in the absence of ligand) gradually shifts the equilibrium to favor the R state.
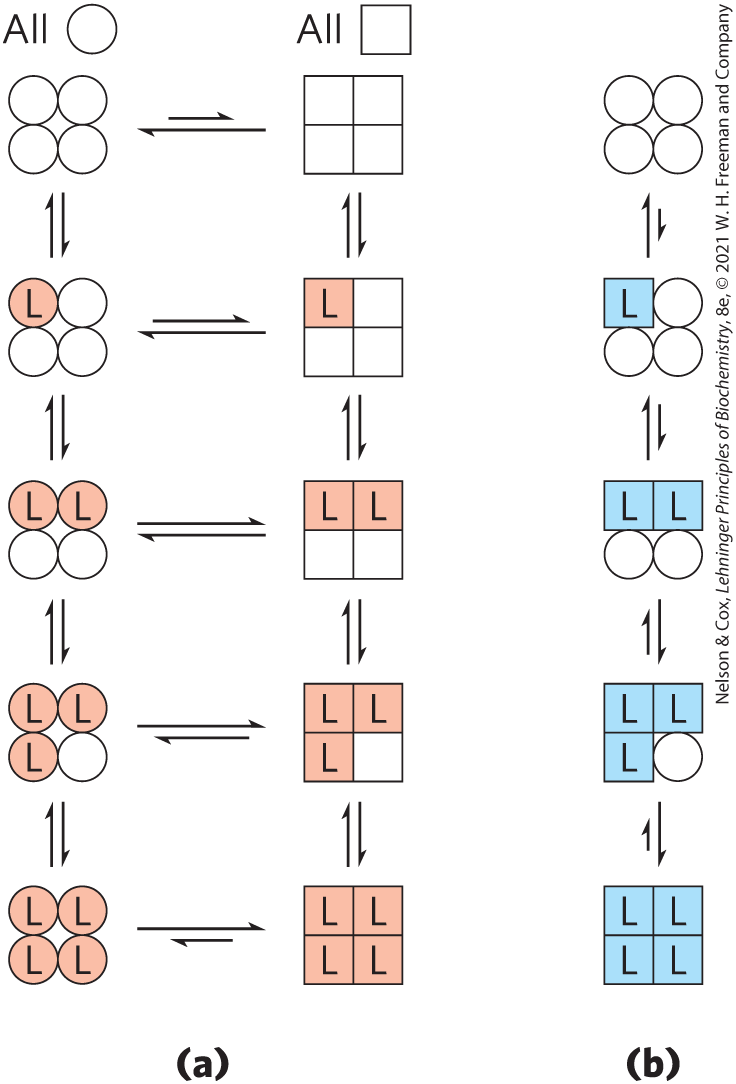
FIGURE 5-14 Two general models for the interconversion of inactive and active forms of a protein during cooperative ligand binding. Although the models may be applied to any protein — including any enzyme (Chapter 6) — that exhibits cooperative binding, here we show four subunits because the model was originally proposed for hemoglobin. (a) In the concerted, or all-or-none, model (MWC model), all subunits are postulated to be in the same conformation, either all ◯ (low affinity or inactive) or all ◻ (high affinity or active). Depending on the equilibrium, , between ◯ and ◻ forms, the binding of one or more ligand molecules (L) will pull the equilibrium toward the ◻ form. Subunits with bound L are shaded. (b) In the sequential model, each individual subunit can be in either the ◯ form or the ◻ form. The equilibrium is altered as additional ligands are bound, progressively favoring the R state.
In the second model, the sequential model (Fig. 5-14b), proposed in 1966 by Daniel Koshland and colleagues, ligand binding can induce a change of conformation in an individual subunit. A conformational change in one subunit makes a similar change in an adjacent subunit more likely, and makes the binding of a second ligand molecule more likely as well. There are more potential intermediate states in this model than in the concerted model. The two models are not mutually exclusive; the concerted model may be viewed as the “all-or-none” limiting case of the sequential model. Unfortunately, the two models have proven very difficult to distinguish experimentally. In Chapter 6 we use these models to investigate allosteric enzymes.
Hemoglobin Also Transports and
In addition to carrying nearly all the oxygen required by cells from the lungs to the tissues, hemoglobin carries two end products of cellular respiration — and — from the tissues to the lungs and the kidneys, where they are excreted. The , produced by oxidation of organic fuels in mitochondria, is hydrated to form bicarbonate:
This reaction is catalyzed by carbonic anhydrase, an enzyme particularly abundant in erythrocytes. Carbon dioxide is not very soluble in aqueous solution, and bubbles of would form in the tissues and blood if it were not converted to bicarbonate. As you can see from the reaction catalyzed by carbonic anhydrase, the hydration of results in an increase in the concentration (a decrease in pH) in the tissues. The binding of oxygen by hemoglobin is profoundly influenced by pH and concentration, so the interconversion of and bicarbonate is of great importance to the regulation of oxygen binding and release in the blood.
Hemoglobin transports about 40% of the total and 15% to 20% of the formed in the tissues to the lungs and kidneys. (The remainder of the is absorbed by the plasma’s bicarbonate buffer; the remainder of the is transported as dissolved and .) The structural effects of and binding to hemoglobin favor the T state. Thus, the binding of and is inversely related to the binding of oxygen. At the relatively low pH and high concentration of peripheral tissues, the affinity of hemoglobin for oxygen decreases as and are bound, and is released to the tissues. Conversely, in the capillaries of the lung, as is excreted and the blood pH consequently rises, the affinity of hemoglobin for oxygen increases and the protein binds more for transport to the peripheral tissues. This effect of pH and concentration on the binding and release of oxygen by hemoglobin is called the Bohr effect, after Christian Bohr, the Danish physiologist (and father of physicist Niels Bohr) who discovered it in 1904.
A complete statement of the binding equilibrium for hemoglobin and one molecule of oxygen can be designated by the reaction
where denotes a protonated form of hemoglobin. This equation tells us that the -saturation curve of hemoglobin is influenced by the concentration (Fig. 5-15). Both and are bound by hemoglobin, but with inverse affinity. When the oxygen concentration is high, as in the lungs, hemoglobin binds and releases protons. When the oxygen concentration is low, as in the peripheral tissues, is bound and is released.
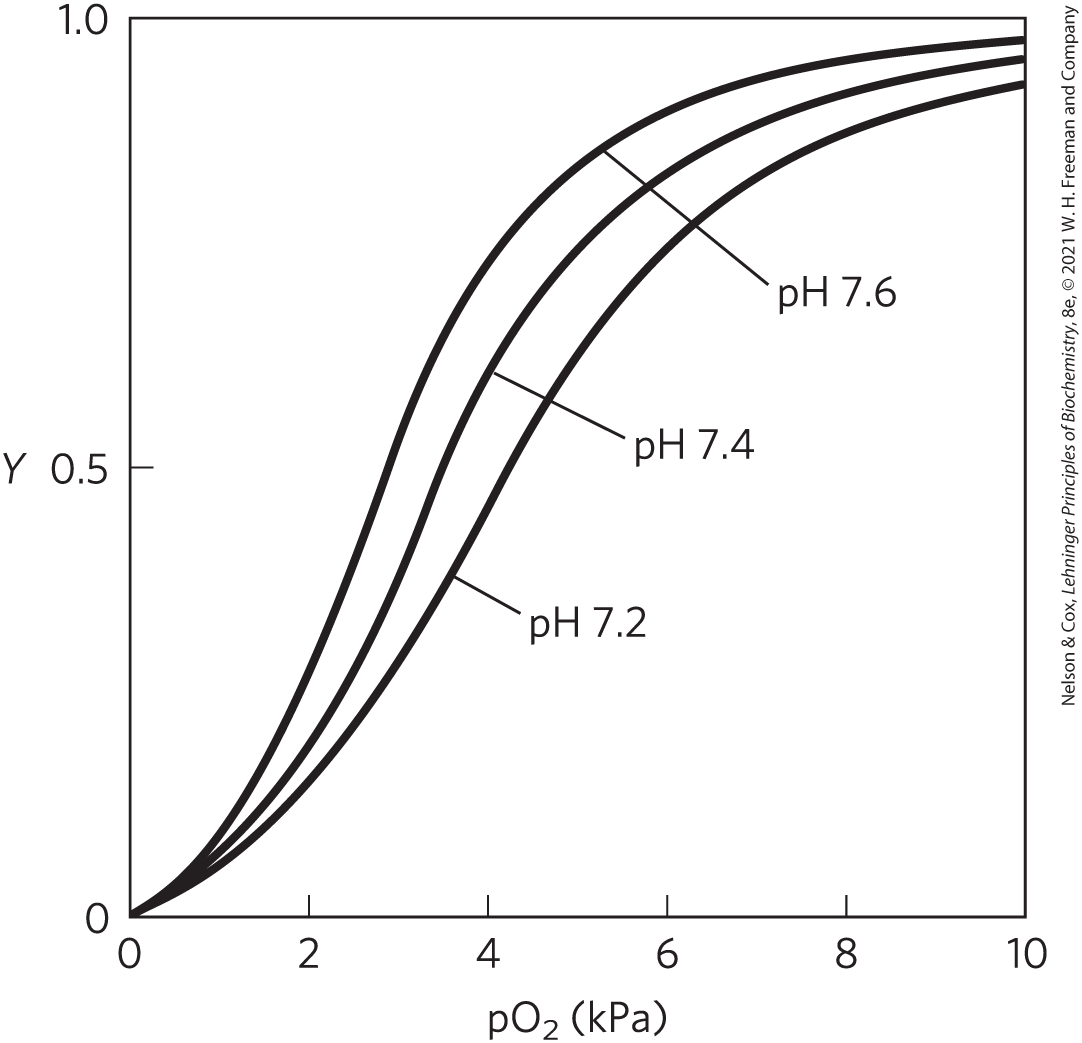
FIGURE 5-15 Effect of pH on oxygen binding to hemoglobin. The pH of blood is 7.6 in the lungs and 7.2 in the tissues. Experimental measurements on hemoglobin binding are often performed at pH 7.4.
Oxygen and are not bound at the same sites in hemoglobin. Oxygen binds to the iron atoms of the hemes, whereas binds to any of several amino acid residues in the protein. A major contribution to the Bohr effect is made by (His HC3) of the β subunits. When protonated, this residue forms one of the ion pairs — to (Asp FG1) — that helps stabilize deoxyhemoglobin in the T state (Fig. 5-9). Protonation of the amino-terminal residues of the α subunits, certain other His residues, and perhaps other groups has a similar effect.
Hemoglobin also binds , again in a manner inversely related to the binding of oxygen. Carbon dioxide binds as a carbamate group to the α-amino group at the amino-terminal end of each globin chain, forming carbaminohemoglobin:
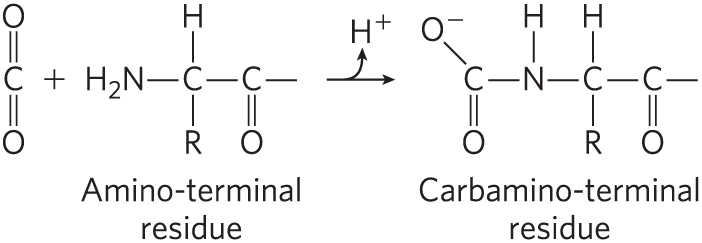
This reaction produces , contributing to the Bohr effect. The bound carbamates also form additional salt bridges (not shown in Fig. 5-9) that help to stabilize the T state and promote the release of oxygen.
When the concentration of carbon dioxide is high, as in peripheral tissues, some binds to hemoglobin and the affinity for decreases, causing its release. Conversely, when hemoglobin reaches the lungs, the high oxygen concentration promotes binding of and release of . It is the capacity to communicate ligand-binding information from one polypeptide subunit to the others that makes the hemoglobin molecule so beautifully adapted to integrating the transport of , , and by erythrocytes.
Oxygen Binding to Hemoglobin Is Regulated by 2,3-Bisphosphoglycerate
The interaction of 2,3-bisphosphoglycerate (BPG) with hemoglobin molecules further refines the function of hemoglobin, and provides an example of heterotropic allosteric modulation.
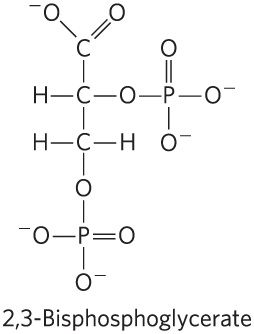
BPG binds at a site distant from the oxygen-binding site and regulates the -binding affinity of hemoglobin in relation to the in the lungs. BPG is present in relatively high concentrations in erythrocytes. When hemoglobin is isolated, it contains substantial amounts of bound BPG, which can be difficult to remove completely. In fact, the -binding curves for hemoglobin that we have examined up to this point were obtained in the presence of bound BPG. 2,3-Bisphosphoglycerate greatly reduces the affinity of hemoglobin for oxygen — there is an inverse relationship between the binding of and the binding of BPG. We can therefore describe another binding process for hemoglobin:
BPG is important in the physiological adaptation to the lower at high altitudes. For a healthy human at sea level, the binding of to hemoglobin is regulated such that the amount of delivered to the tissues is nearly 40% of the maximum that could be carried by the blood (Fig. 5-16). Imagine that this person is suddenly transported from sea level to an altitude of 4,500 meters, where the is considerably lower. The delivery of to the tissues is now reduced. However, after just a few hours at the higher altitude, the BPG concentration in the blood has begun to rise, leading to a decrease in the affinity of hemoglobin for oxygen. This adjustment in the BPG level has only a small effect on the binding of in the lungs, but it has a considerable effect on the release of in the tissues. As a result, the delivery of oxygen to the tissues is restored to nearly 40% of the that can be transported by the blood. The situation is reversed when the person returns to sea level. The BPG concentration in erythrocytes also increases in people suffering from hypoxia, lowered oxygenation of peripheral tissues due to inadequate functioning of the lungs or circulatory system.
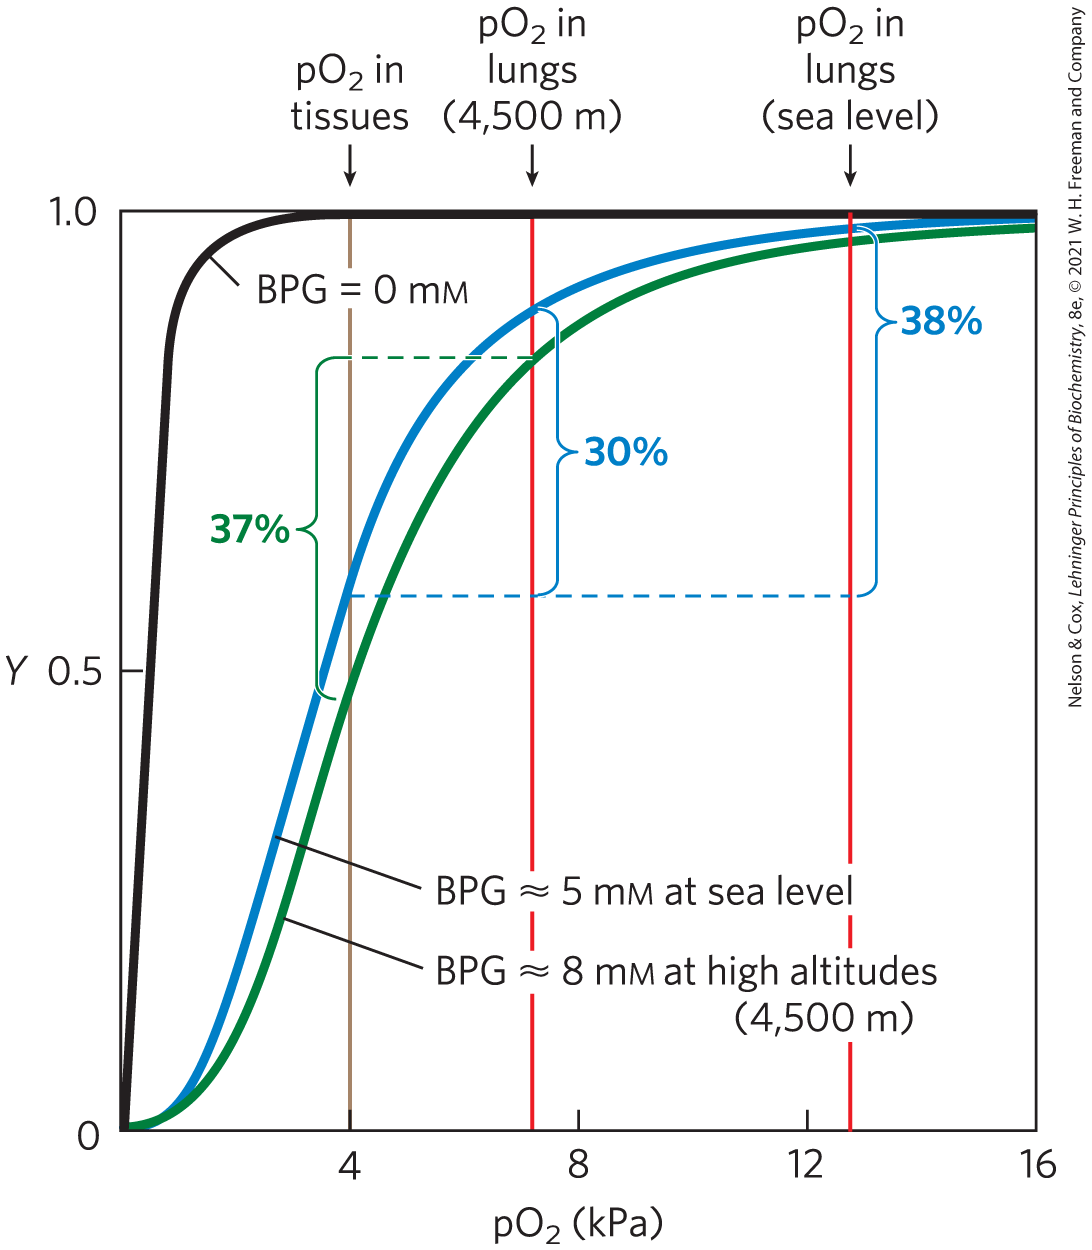
FIGURE 5-16 Effect of 2,3-bisphosphoglycerate on oxygen binding to hemoglobin. The BPG concentration in normal human blood is about 5 mm at sea level and about 8 mm at high altitudes. Note that hemoglobin binds to oxygen quite tightly when BPG is entirely absent, and the binding curve seems to be hyperbolic. In reality, the measured Hill coefficient for -binding cooperativity decreases only slightly (from 3 to about 2.5) when BPG is removed from hemoglobin, but the rising part of the sigmoid binding curve is confined to a very small region close to the origin. At sea level, hemoglobin is nearly saturated with in the lungs, but is just over 60% saturated in the tissues, so the amount of released in the tissues is about 38% of the maximum that can be carried in the blood. At high altitudes, delivery declines by about one-fourth, to 30% of maximum. An increase in BPG concentration, however, decreases the affinity of hemoglobin for , so approximately 37% of what can be carried is again delivered to the tissues.
The site of BPG binding to hemoglobin is the cavity between the β subunits in the T state (Fig. 5-17). This cavity is lined with positively charged amino acid residues that interact with the negatively charged groups of BPG. Unlike , only one molecule of BPG is bound to each hemoglobin tetramer. BPG lowers hemoglobin’s affinity for oxygen by stabilizing the T state. In the absence of BPG, hemoglobin is primarily present in the R state, where it binds efficiently in the lungs but fails to release it in the tissues.
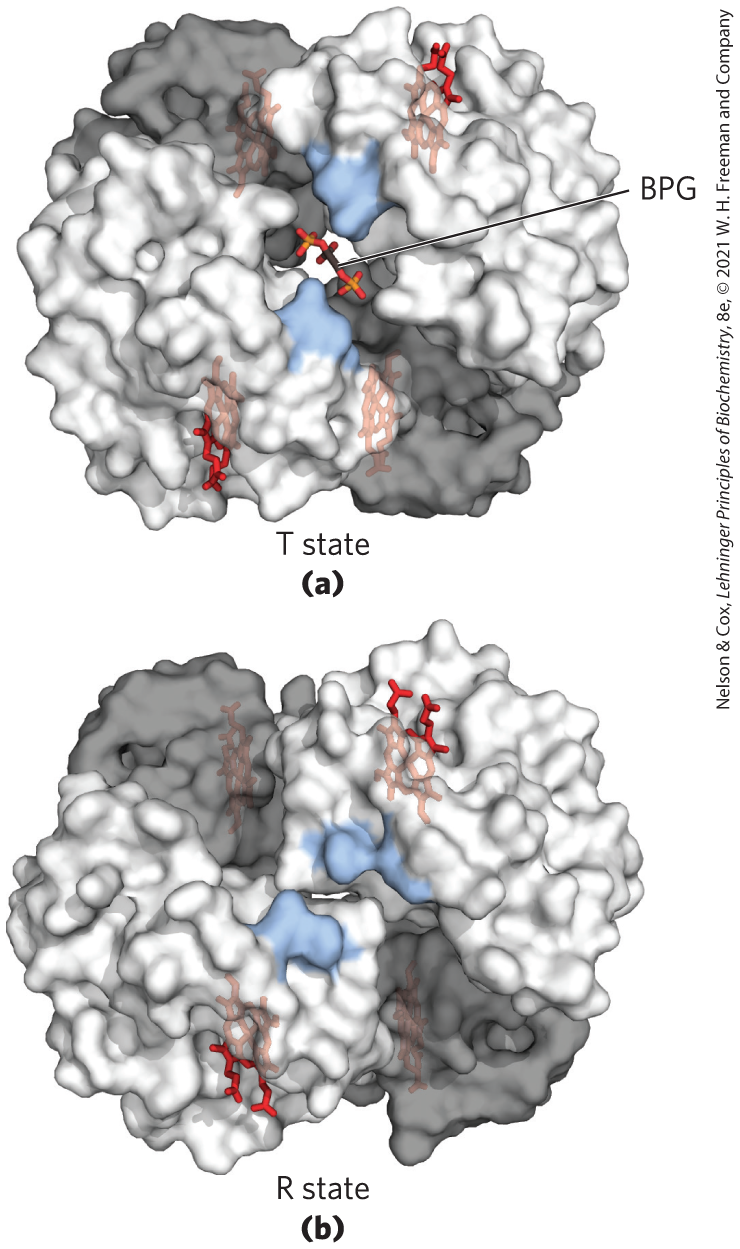
FIGURE 5-17 Binding of 2,3-bisphosphoglycerate to deoxyhemoglobin. (a) BPG binding stabilizes the T state of deoxyhemoglobin. The negative charges of BPG interact with several positively charged groups (shown in blue in this surface contour image) that surround the pocket between the β subunits on the surface of deoxyhemoglobin in the T state. (b) The binding pocket for BPG disappears on oxygenation, following transition to the R state. (Compare with Fig. 5-10.) [Data from (a) PDB ID 1B86, V. Richard et al., J. Mol. Biol. 233:270, 1993; (b) PDB ID 1BBB, M. M. Silva et al., J. Biol. Chem. 267:17,248, 1992.]
Regulation of oxygen binding to hemoglobin by BPG has an important role in fetal development. Because a fetus must extract oxygen from its mother’s blood, fetal hemoglobin must have greater affinity than the maternal hemoglobin for . The fetus synthesizes γ subunits rather than β subunits, forming hemoglobin. This tetramer has a much lower affinity for BPG than normal adult hemoglobin, and a correspondingly higher affinity for .
Sickle Cell Anemia Is a Molecular Disease of Hemoglobin
The hereditary human disease sickle cell anemia demonstrates strikingly the importance of amino acid sequence in determining the secondary, tertiary, and quaternary structures of globular proteins, and thus their biological functions. Almost 500 genetic variants of hemoglobin are known to occur in the human population; all but a few are quite rare. Most variations consist of differences in a single amino acid residue. The effects on hemoglobin structure and function are often minor but can sometimes be extraordinary. Each hemoglobin variation is the product of an altered gene. Variant genes are called alleles. Because humans generally have two copies of each gene, an individual may have two copies of one allele (thus being homozygous for that gene) or one copy of each of two different alleles (thus heterozygous).
 The hereditary human disease sickle cell anemia demonstrates strikingly the importance of amino acid sequence in determining the secondary, tertiary, and quaternary structures of globular proteins, and thus their biological functions. Almost 500 genetic variants of hemoglobin are known to occur in the human population; all but a few are quite rare. Most variations consist of differences in a single amino acid residue. The effects on hemoglobin structure and function are often minor but can sometimes be extraordinary. Each hemoglobin variation is the product of an altered gene. Variant genes are called alleles. Because humans generally have two copies of each gene, an individual may have two copies of one allele (thus being homozygous for that gene) or one copy of each of two different alleles (thus heterozygous).
Sickle cell anemia occurs in individuals who inherit the allele for sickle cell hemoglobin from both parents. The erythrocytes of these individuals are fewer and also abnormal. In addition to an unusually large number of immature cells, the blood contains many long, thin, sickle-shaped erythrocytes (Fig. 5-18). When hemoglobin from sickle cells (called hemoglobin S, or HbS) is deoxygenated, it becomes insoluble and forms polymers that aggregate into tubular fibers (Fig. 5-19). Normal hemoglobin (hemoglobin A, or HbA) remains soluble upon deoxygenation. The insoluble fibers of deoxygenated HbS cause the deformed, sickle shape of the erythrocytes, and the proportion of sickled cells increases greatly as blood is deoxygenated.

FIGURE 5-18 A comparison of (a) uniform, cup-shaped, normal erythrocytes and (b) the variably shaped erythrocytes seen in sickle cell anemia, which range from normal to spiny or sickle-shaped.
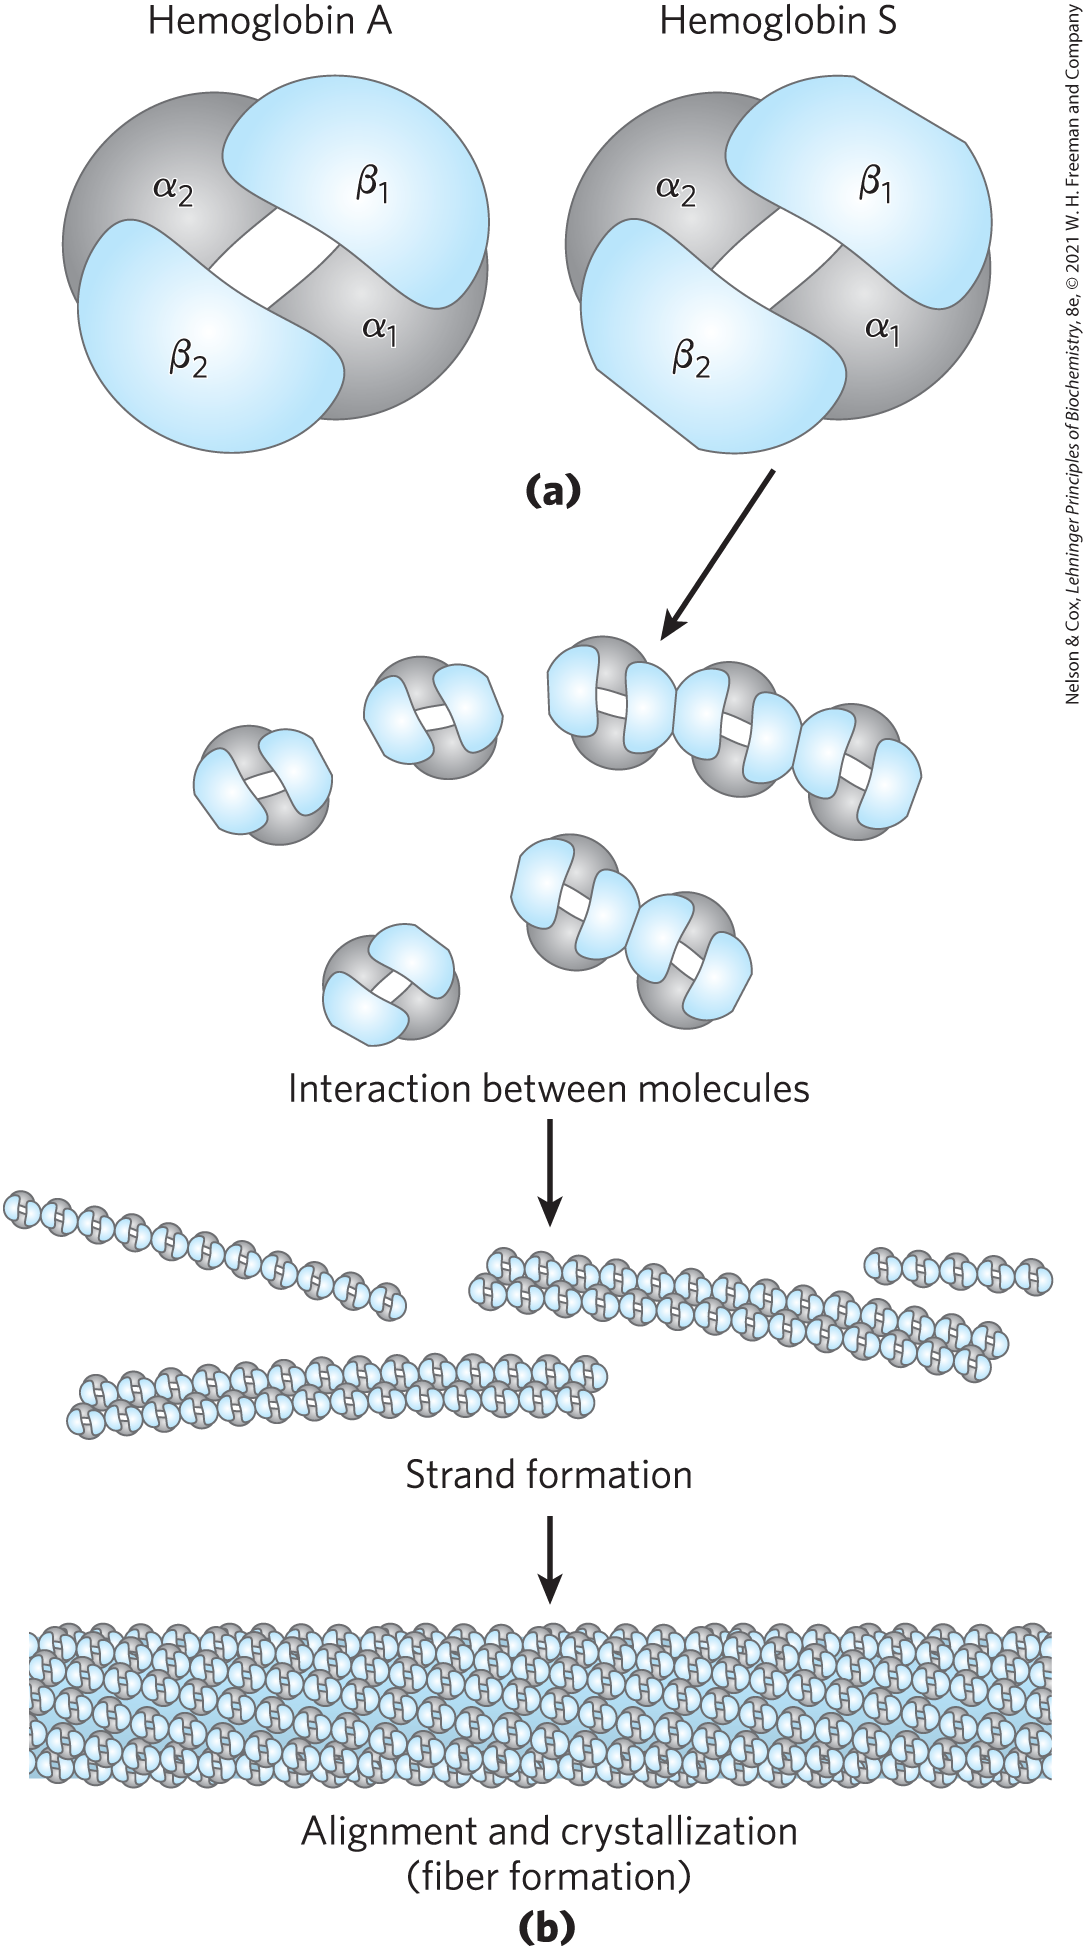
FIGURE 5-19 Normal and sickle cell hemoglobin. (a) Subtle differences between the conformations of HbA and HbS result from a single amino acid change in the β chains. (b) As a result of this change, deoxyHbS has a hydrophobic patch on its surface, which causes the molecules to aggregate into strands that align into insoluble fibers.
The altered properties of HbS result from a single amino acid substitution, a Val instead of a Glu residue at position 6 in the two β chains. Replacement of the Glu residue by Val creates a “sticky” hydrophobic contact point at position 6 of the β chain, which is on the outer surface of the molecule. These sticky spots cause deoxyHbS molecules to associate abnormally with each other, forming the long, fibrous aggregates characteristic of this disorder.
Sickle cell anemia is life-threatening and painful. People with this disease suffer repeated crises brought on by physical exertion. They become weak, dizzy, and short of breath, and they also experience heart murmurs and an increased pulse rate. The hemoglobin content of their blood is only about half the normal value of 15 to 16 g/100 mL, because sickled cells are very fragile and rupture easily; this results in anemia (“lack of blood”). An even more serious consequence is that capillaries become blocked by the long, abnormally shaped cells, causing severe pain and interfering with normal organ function — a major factor in the early death of many people with the disease.
Without medical treatment, people with sickle cell anemia usually die in childhood. Curiously, the frequency of the sickle cell allele in populations is unusually high in certain parts of Africa. Investigation into this matter led to the finding that when heterozygous, the allele confers a small but significant resistance to lethal forms of malaria. The heterozygous individuals experience a milder condition called sickle cell trait; only about 1% of their erythrocytes become sickled on deoxygenation. These individuals may live completely normal lives if they avoid vigorous exercise and other stresses on the circulatory system. Natural selection has resulted in an allele population that balances the deleterious effects of the homozygous condition against the resistance to malaria afforded by the heterozygous condition.

SUMMARY 5.1 Reversible Binding of a Protein to a Ligand: Oxygen-Binding Proteins
- Protein function often entails interactions with other molecules. A protein binds a molecule, known as a ligand, at its binding site.
- Myoglobin contains a heme prosthetic group, which binds oxygen. Heme consists of a single atom of coordinated within a porphyrin.
- Globins are a specialized family of transport proteins containing heme; most globins store oxygen.
- Oxygen binds to myoglobin reversibly.
- Reversible binding of a ligand to a protein can be described quantitatively by a dissociation constant . For a monomeric protein such as myoglobin, the fraction of binding sites occupied by a ligand is a hyperbolic function of ligand concentration.
- Proteins may undergo conformational changes when a ligand binds, a process called induced fit. In a multisubunit protein, the binding of a ligand to one subunit may affect ligand binding to other subunits. Ligand binding can be regulated.
- Hemoglobin transports oxygen in blood.
- Normal adult hemoglobin has four heme-containing subunits, two α and two β, similar in structure to each other and to myoglobin.
- Hemoglobin exists in two interchangeable structural states, T and R. The T state is most stable when oxygen is not bound. Oxygen binding promotes transition to the R state.
- Oxygen binding to hemoglobin is both allosteric and cooperative. As binds to one binding site, the hemoglobin undergoes conformational changes that affect the other binding sites — an example of allosteric behavior.
- Conformational changes between the T and R states, mediated by subunit-subunit interactions, result in cooperative binding; this is described by a sigmoid binding curve and can be analyzed by a Hill plot.
- Two major models have been proposed to explain the cooperative binding of ligands to multisubunit proteins: the concerted model and the sequential model.
- Hemoglobin also binds and , resulting in the formation of ion pairs that stabilize the T state and lessen the protein’s affinity for (the Bohr effect).
- Oxygen binding to hemoglobin is also modulated by 2,3-bisphosphoglycerate, which binds to and stabilizes the T state.
- Sickle cell anemia is a genetic disease caused by a single amino acid substitution ( to ) in each β chain of hemoglobin. The change produces a hydrophobic patch on the surface of the hemoglobin that causes the molecules to aggregate into bundles of fibers. This homozygous condition results in serious medical complications.
 Protein function often entails interactions with other molecules. A protein binds a molecule, known as a ligand, at its binding site.