12.4 Receptor Tyrosine Kinases
The receptor tyrosine kinases (RTKs), a family of plasma membrane receptors with protein kinase activity, transduce extracellular signals by a mechanism fundamentally different from that of GPCRs. RTKs have a ligand-binding domain on the extracellular face of the plasma membrane and an enzyme active site on the cytoplasmic face, connected by a single transmembrane segment, as seen for insulin in Figure 12-21a. The cytoplasmic domain is a Tyr kinase, a protein kinase that phosphorylates specific Tyr residues in target proteins. The receptors for insulin and epidermal growth factor are prototypes for the 58 RTKs in humans (see Fig. 12-26).
 The
The 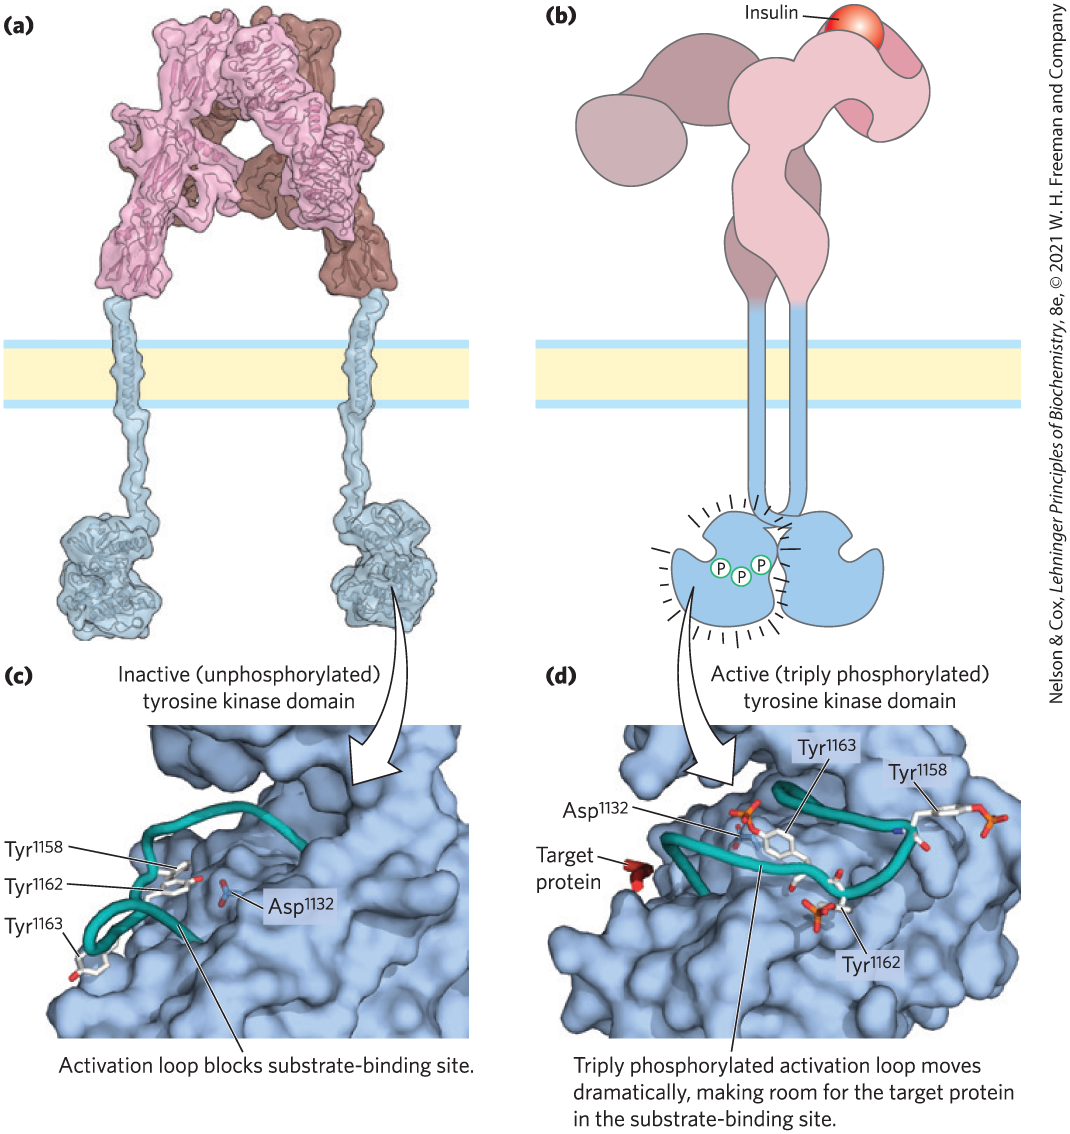
FIGURE 12-21 Activation of the insulin-receptor tyrosine kinase by autophosphorylation. (a) A structural model assembled from crystal structures of the extracellular and tyrosine kinase domains and NMR solution structure of the transmembrane domain. The insulin-binding region of the insulin receptor lies outside the cell and comprises two intertwined α subunits. (b) The binding of a single molecule of insulin is communicated through the single transmembrane helix of each β subunit to the paired Tyr kinase domains inside the cell, moving them toward each other and activating them to phosphorylate each other on three Tyr residues. (c) In the inactive form of the Tyr kinase domain, the activation loop (backbone shown in teal) sits in the active site, and none of the critical Tyr residues (stick structures) are phosphorylated. This conformation is stabilized by hydrogen bonding between and . (d) Activation of the Tyr kinase allows each β subunit to phosphorylate three Tyr residues (,, ) on the other β subunit. (Phosphoryl groups are depicted in red and orange.) The introduction of three highly charged –Tyr residues forces a 30 Å change in the position of the activation loop, away from the substrate-binding site, which thus becomes available to bind and phosphorylate a target protein. [(a) Data and information from T. Gutmann et al., J. Cell Biol. 21:1643, 2018, Fig. 1. Data from (c) PDB ID 1IRK, S. R. Hubbard et al., Nature 372:746, 1994; (d) PDB ID 1IR3, S. R. Hubbard, EMBO J. 16:5572, 1997.]
 –Tyr residues forces a 30 Å change in the position of the activation loop, away from the substrate-binding site, which thus becomes available to bind and phosphorylate a target protein. [(a) Data and information from T. Gutmann et al., J. Cell Biol. 21:1643, 2018, Fig. 1. Data from (c) PDB ID 1IRK, S. R. Hubbard et al., Nature 372:746, 1994; (d) PDB ID 1IR3, S. R. Hubbard, EMBO J. 16:5572, 1997.]
Stimulation of the Insulin Receptor Initiates a Cascade of Protein Phosphorylation Reactions
Insulin regulates both metabolic enzymes and gene expression. It initiates a signal that travels divergent pathways from the plasma membrane receptor to insulin-sensitive enzymes in the cytosol, and to enzymes that act in the nucleus by stimulating the transcription of specific genes. The active insulin receptor protein (INSR) consists of two identical α subunits protruding from the outer face of the plasma membrane and two transmembrane β subunits with their carboxyl termini protruding into the cytosol — a dimer of αβ monomers (Fig. 12-21). The α subunits contain the insulin-binding domain, and the intracellular domains of the β subunits contain the protein kinase activity that transfers a phosphoryl group from ATP to the hydroxyl group of Tyr residues in specific target proteins.
Signaling through INSR begins with the binding of one insulin molecule between the two subunits of the receptor on the extracellular side, causing movement of the Tyr kinase domains together and stimulating their activity. Each β subunit phosphorylates three essential Tyr residues near the carboxyl terminus of the other β subunit. This autophosphorylation opens the active site so that the enzyme can phosphorylate Tyr residues of other target proteins. The mechanism of activation of the INSR protein kinase is similar to that described for PKA and PKC: a region of the cytoplasmic domain called the activation loop that usually occludes the active site moves out of the active site after being phosphorylated, opening the site for the binding of target proteins (Fig. 12-21c, d).
When INSR is autophosphorylated (Fig. 12-22, step ) and becomes an active Tyr kinase, one of its targets is the protein insulin receptor substrate 1 (IRS1; step ). Once phosphorylated on several of its Tyr residues, IRS1 becomes the point of nucleation for a complex of proteins (step ) that carry the message from the insulin receptor to end targets in the cytosol and nucleus, through a long series of intermediate proteins. First, a –Tyr residue of IRS1 binds to the SH2 domain of the protein Grb2. Many signaling proteins contain SH2 (Src homology 2) domains, all of which bind –Tyr residues in a protein partner. Grb2 (growth factor receptor-bound protein 2) is an adaptor protein, with no intrinsic enzymatic activity. Its function is to bring together two proteins (in this case, IRS1 and the protein Sos) that must interact to enable signal transduction. In addition to its SH2 (–Tyr-binding) domain, Grb2 contains a second protein-binding domain, SH3, that binds to a proline-rich region of Sos (son of sevenless), recruiting Sos to the growing receptor complex. When bound to Grb2, Sos acts as a guanosine nucleotide–exchange factor (GEF), catalyzing the replacement of bound GDP with GTP on the small G protein Ras.
 ) and becomes an active Tyr kinase, one of its targets is the protein insulin receptor substrate 1 (IRS1; step
  ). Once phosphorylated on several of its Tyr residues, IRS1 becomes the point of nucleation for a complex of proteins (step
  ) that carry the message from the insulin receptor to end targets in the cytosol and nucleus, through a long series of intermediate proteins. First, a
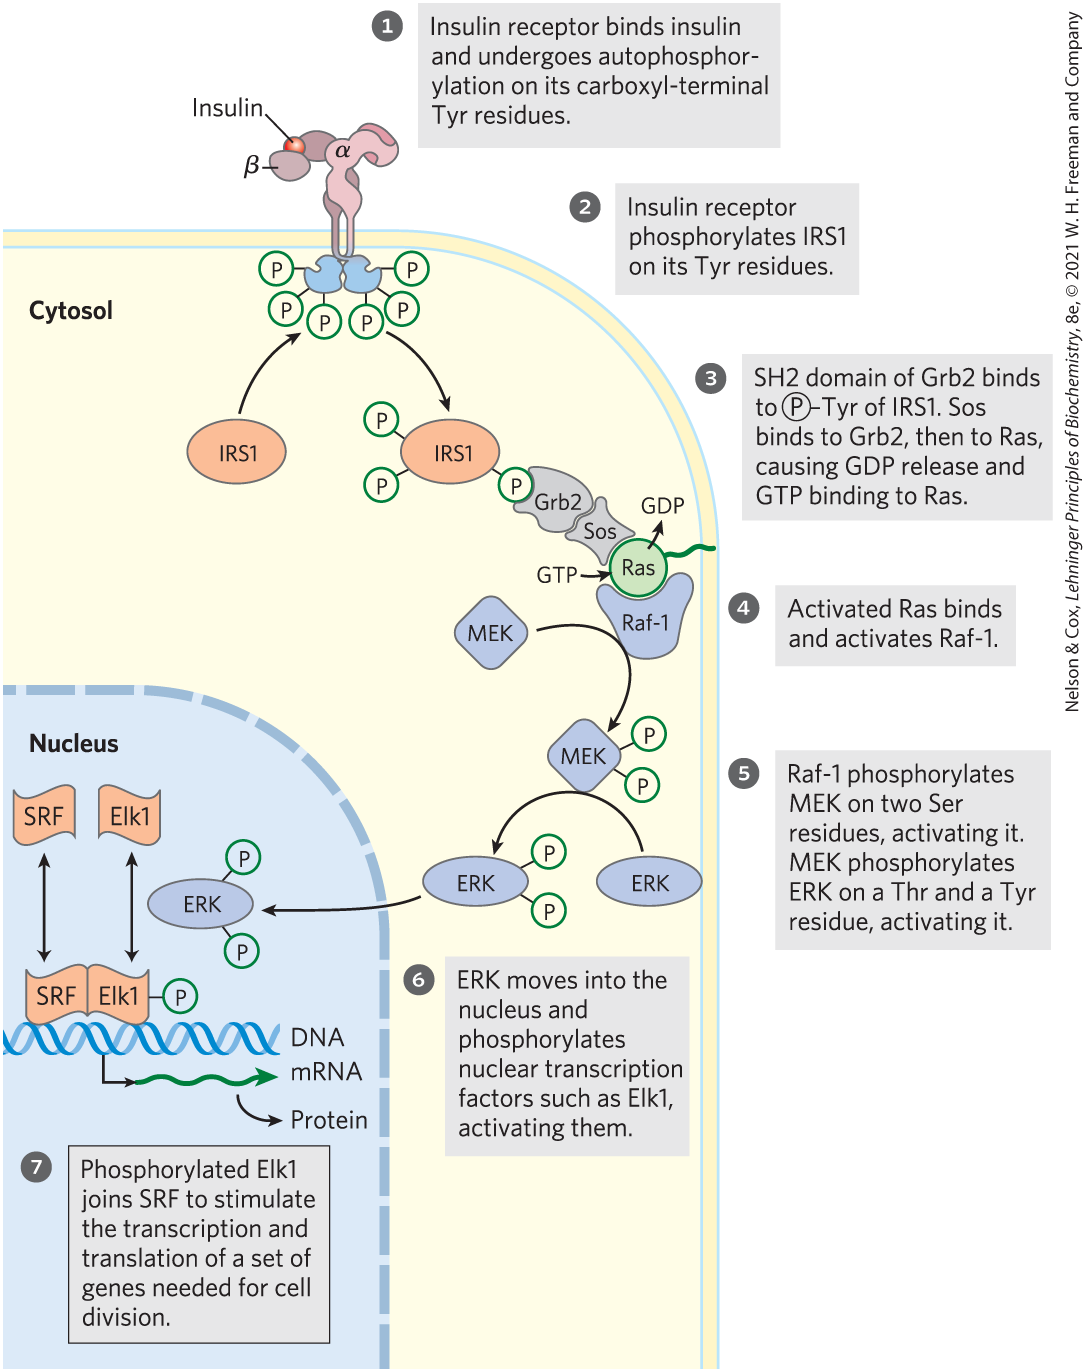
FIGURE 12-22 Regulation of gene expression by insulin through a MAP kinase cascade. The signaling pathway by which insulin regulates the expression of specific genes consists of a cascade of protein kinases, each of which activates the next. The insulin receptor is a Tyr-specific kinase; the other kinases (all shown in blue) phosphorylate Ser or Thr residues. MEK is a dual-specificity kinase that phosphorylates both a Thr residue and a Tyr residue in ERK (extracellular regulated kinase). MEK is mitogen-activated, ERK-activating kinase; SRF is serum response factor.
In its GTP-bound active form, Ras can activate a protein kinase, Raf-1 (Fig. 12-22, step ), the first of three protein kinases — Raf-1, MEK, and ERK — that form a cascade in which each kinase activates the next by phosphorylation (step ). The protein kinases MEK and ERK are activated by phosphorylation of both a Thr residue and a Tyr residue. When activated, ERK mediates some of the biological effects of insulin by entering the nucleus and phosphorylating transcription factors, including Elk1 (step ), that modulate the transcription of about 100 insulin-regulated genes (step ), some of which encode proteins essential for cell division. Thus, insulin acts as a growth factor.
 ), the first of three protein kinases — Raf-1, MEK, and ERK — that form a cascade in which each kinase activates the next by phosphorylation (step
  ). The protein kinases MEK and ERK are activated by phosphorylation of both a Thr residue and a Tyr residue. When activated, ERK mediates some of the biological effects of insulin by entering the nucleus and phosphorylating transcription factors, including Elk1 (step
  ), that modulate the transcription of about 100 insulin-regulated genes (step
  ), some of which encode proteins essential for cell division. Thus, insulin acts as a growth factor.
The proteins Raf-1, MEK, and ERK are members of three larger families, for which several nomenclatures are used. ERK is in the MAPK family (mitogen-activated protein kinases; mitogens are extracellular signals that induce mitosis and cell division). Soon after discovery of the first MAPK enzyme, that enzyme was found to be activated by another protein kinase, which was named MAP kinase kinase (MEK belongs to this family), and when a third kinase that activated MAP kinase kinase was discovered, it was given the slightly ludicrous family name MAP kinase kinase kinase (Raf-1 is in this family). Somewhat less cumbersome are the abbreviations for these three families: MAPK, MAPKK, and MAPKKK. Kinases in the MAPK and MAPKKK families are specific for Ser residues or Thr residues, and MAPKKs (here, MEK) phosphorylate both a Ser residue and a Tyr residue in their substrate, a MAPK (here, ERK).
This insulin pathway is but one instance of a more general scheme in which hormone signals, via pathways similar to that shown in Figure 12-22, result in a change in the phosphorylation of target enzymes by protein kinases or phosphoprotein phosphatases. The target of phosphorylation is often another protein kinase, which then phosphorylates a third protein kinase, and so on. The result is a cascade of reactions that amplifies the initial signal by many orders of magnitude (see Fig. 12-7). MAPK cascades (such as the Raf-MEK-ERK sequence in Fig. 12-22) mediate signaling initiated by a variety of growth factors, such as platelet-derived growth factor (PDGF) and epidermal growth factor (EGF), both of which are receptor tyrosine kinases like the insulin receptor. Another general scheme exemplified by the insulin receptor pathway is the use of nonenzymatic adaptor proteins, often with intrinsically disordered regions, to bring together the components of divergent signaling pathways, to which we now turn.
The Membrane Phospholipid Functions at a Branch in Insulin Signaling
The signaling pathway from insulin branches at IRS1 (step in Fig. 12-22 and Fig. 12-23). Grb2 is not the only protein that associates with phosphorylated IRS1. The enzyme phosphoinositide 3-kinase (PI3K) binds IRS1 through PI3K’s SH2 domain. Thus activated, PI3K converts the membrane lipid phosphatidylinositol 4,5-bisphosphate to phosphatidylinositol 3,4,5-trisphosphate () by the transfer of a phosphoryl group from ATP (Fig. 12-24). The multiply (negatively) charged head group of , protruding on the cytoplasmic side of the plasma membrane, is the starting point for a second signaling branch involving another cascade of protein kinases. When bound to , protein kinase B (PKB; also called Akt) is phosphorylated and activated by yet another protein kinase, PDK1 (not shown in Fig. 12-23). The activated PKB then phosphorylates Ser or Thr residues in its target proteins, one of which is glycogen synthase kinase 3 (GSK3). In its active, nonphosphorylated form, GSK3 phosphorylates glycogen synthase, inactivating it and thereby contributing to the slowing of glycogen synthesis. (This mechanism is only part of the explanation for the effects of insulin on glycogen metabolism; see Fig. 15-16.) When phosphorylated by PKB, GSK3 is inactivated. By thus preventing inactivation of glycogen synthase in liver and muscle, the cascade of protein phosphorylations initiated by insulin ultimately stimulates glycogen synthesis (Fig. 12-23).

FIGURE 12-23 Insulin action on glycogen synthesis and GLUT4 movement to the plasma membrane. The activation of PI3 kinase (PI3K) by phosphorylated IRS1 initiates (through protein kinase B, PKB) movement of the glucose transporter GLUT4 to the plasma membrane, and the activation of glycogen synthase.
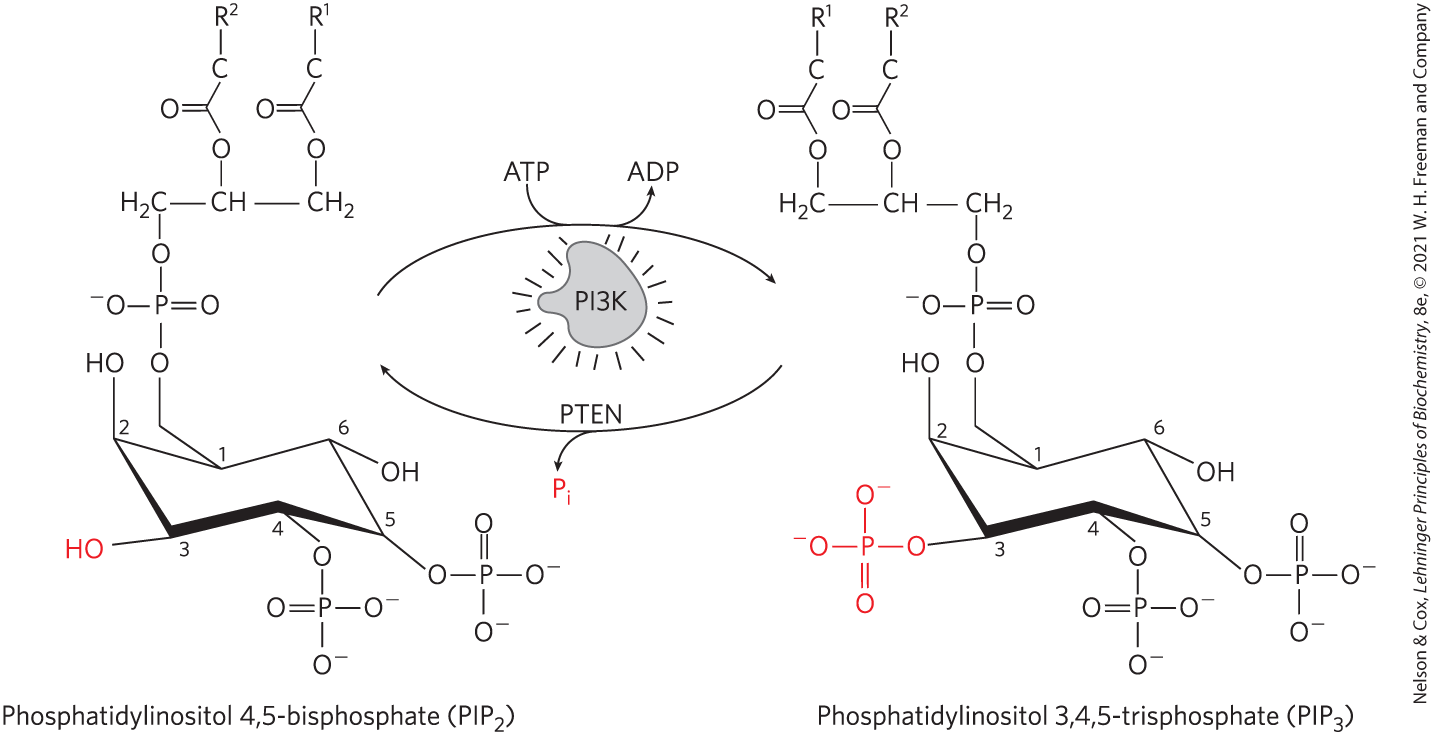
FIGURE 12-24 Regulation of formation and breakdown. Phosphoinositide 3-kinase (PI3K) responds to the insulin signal by catalyzing the transfer of a phosphoryl group from ATP to C-3 of the inositol ring of phosphatidylinositol 4,5-bisphosphate to form phosphatidylinositol 3,4,5-trisphosphate , which serves as a nucleation point for proteins involved in the MAPK cascade. The enzyme PTEN (phosphatase and tensin homolog) ends the response by catalyzing removal of the same phosphoryl group, which is released as .
In a third signaling branch important in muscle and fat tissue, PKB, acting through two small G proteins (RAC1 and Rab) triggers the clathrin-aided movement of glucose transporters (GLUT4) from intracellular vesicles to the plasma membrane, stimulating glucose uptake from the blood (Fig. 12-23, step ; see also Box 11-1). This increase in glucose uptake triggered by insulin has profound metabolic and medical consequences, as we shall see in Chapter 23.
How fast is the response to insulin? Phosphoproteomics uses high-resolution, high-throughput mass spectrometry to determine, for thousands of proteins in a cell type, which residues in which proteins are phosphorylated in response to a stimulus such as insulin in the living animal (Fig. 12-25). Autophosphorylation of the insulin receptor and IRS1 occurs within a few seconds of insulin addition; protein kinase is phosphorylated slightly later (within 15 s), and Sos and Gab are phosphorylated within 0.5 and 1 min. ERK1, the end target in this signaling pathway (Fig. 12-22), is maximally phosphorylated within 3 min. The movement of glucose transporter GLUT4 into the plasma membrane takes about 15 min; and the many changes in gene expression in response to insulin occur over several hours. A recently discovered action of insulin has a different mechanism and a slower time course. In some cases, insulin enters the cell and the nucleus, where, with the help of several other nuclear proteins, it regulates gene expression by binding to promoter regions on the DNA.
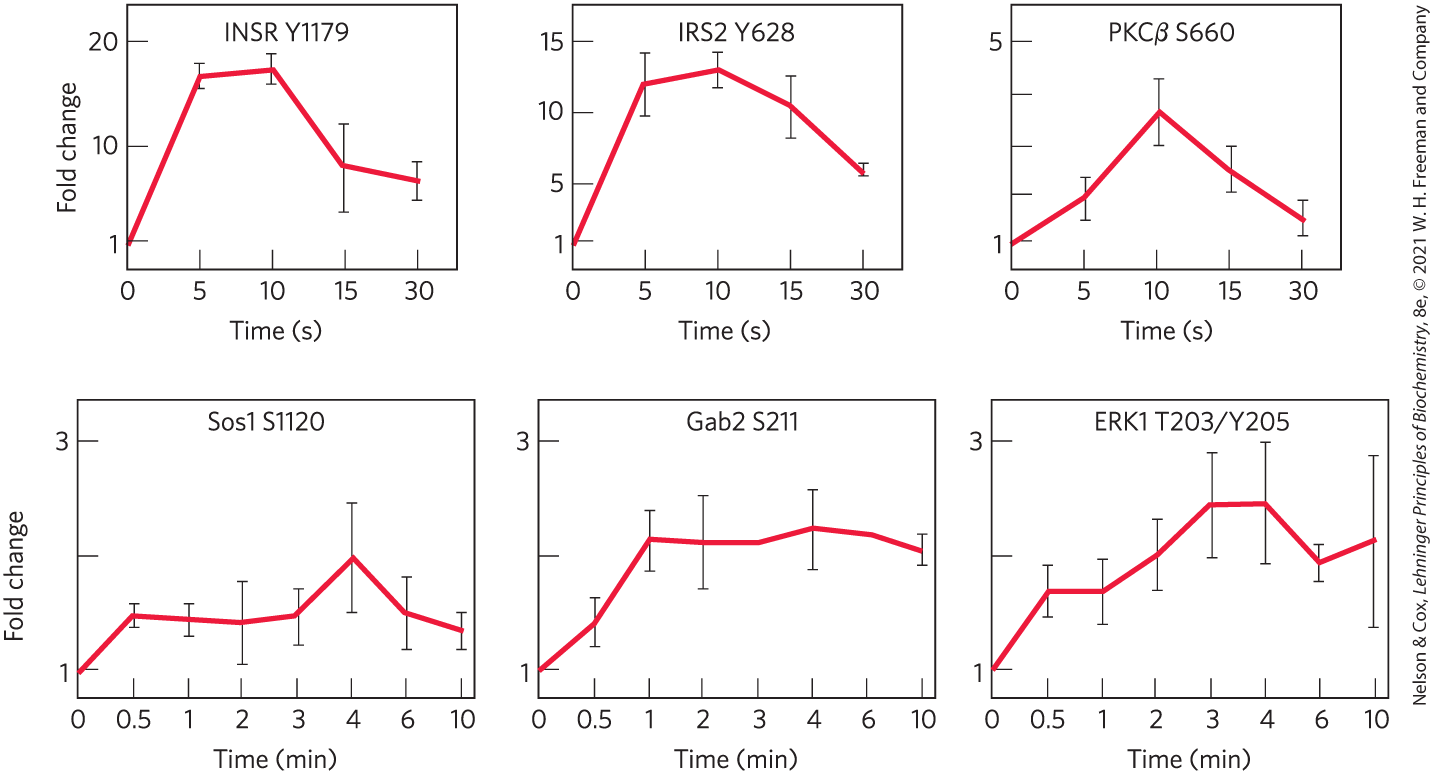
FIGURE 12-25 Time course of phosphorylations triggered by insulin. Mouse liver proteins were examined by mass spectrometry at intervals after injection of insulin to determine quantitatively for each protein which amino acid residues became phosphorylated and when phosphorylation occurred. Each graph represents the phosphorylation of a single residue in the protein, designated by its one-letter abbreviation and position in the primary sequence. Proteins are INSR, insulin receptor; IRS2, insulin receptor substrate 2; PKCβ, protein kinase ; Sos and ERK, as in Fig. 12-22. Gab2 is an adaptor protein involved in the MAPK and PI3K signaling pathways. [Data from S. J. Humphrey et al., Nature Biotechnol. 33:990, 2015, Fig. 4.]
As in all signaling pathways, there is a mechanism for terminating the activity of the PI3K-PKB pathway. A -specific phosphatase (in humans, PTEN) removes the phosphoryl group at the 3 position of to produce (see Fig. 12-24), which no longer serves as a binding site for PKB, and the signaling chain is broken. In several types of cancer, the PTEN gene has often undergone mutation, resulting in a defective regulatory circuit and abnormally high levels of activity. The result is a continuing signal for cell division and thus tumor growth. The unmutated PTEN gene is a tumor suppressor, the subject of Section 12.9.
 As in all signaling pathways, there is a mechanism for terminating the activity of the PI3K-PKB pathway. A -specific phosphatase (in humans, PTEN) removes the phosphoryl group at the 3 position of to produce (see
The insulin receptor is the prototype for several receptor enzymes with a similar structure and RTK activity (Fig. 12-26). The receptors for EGF and PDGF, for example, have structural and sequence similarities to INSR, and both have a protein Tyr kinase activity that phosphorylates IRS1. Many of these receptors dimerize after binding ligand and before autophosphorylation. INSR is the exception, as it is already an dimer before insulin binds. (The protomer of the insulin receptor is one αβ unit.) The binding of adaptor proteins such as Grb2 to –Tyr residues is a common mechanism for promoting protein-protein interactions initiated by RTKs, a subject to which we return in Section 12.5.
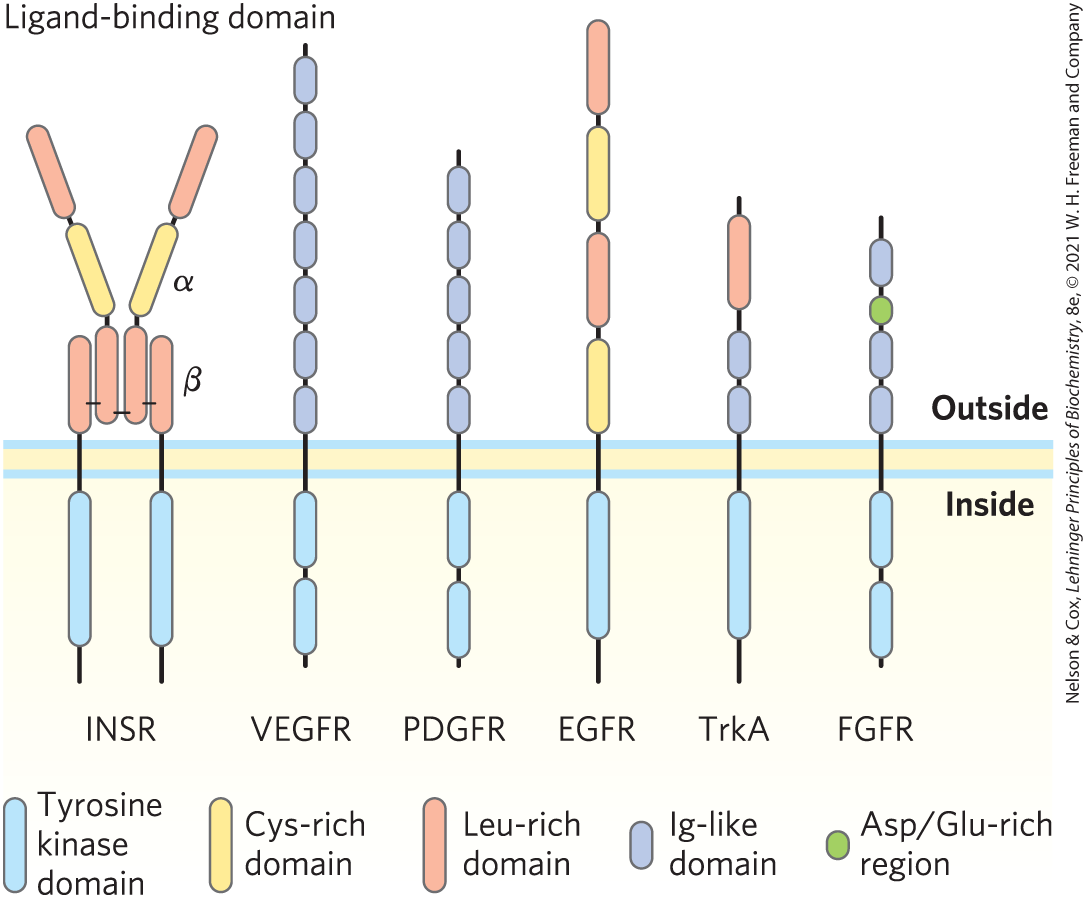
FIGURE 12-26 Receptor tyrosine kinases. Growth factor receptors that initiate signals through Tyr kinase activity include those for insulin (INSR), vascular endothelial growth factor (VEGFR), platelet-derived growth factor (PDGFR), epidermal growth factor (EGFR), high-affinity nerve growth factor (TrkA), and fibroblast growth factor (FGFR). All these receptors have a Tyr kinase domain (blue) on the cytoplasmic side of the plasma membrane. The extracellular domain is unique to each type of receptor, reflecting the different growth factor specificities. These extracellular domains are typically combinations of structural motifs such as Cys- or Leu-rich segments and segments containing one of several motifs common to immunoglobulins (Ig). Many other Tyr kinase receptors are encoded in the human genome, each with a different extracellular domain and ligand specificity. All of the receptors except INSR are monomeric and their Tyr kinase activity is silent until ligand binding triggers receptor dimerization and Tyr kinase activation. Only INSR is always dimeric, but its Tyr kinase is active only when insulin is bound.
What spurred the evolution of such complicated regulatory machinery? This system allows one activated receptor to activate several IRS1 molecules, amplifying the insulin signal, and it provides for the integration of signals from different receptors such as EGFR and PDGFR, each of which can phosphorylate IRS1. Furthermore, because IRS1 can activate any of several proteins that contain SH2 domains, a single receptor acting through IRS1 can trigger two or more signaling pathways; insulin affects gene expression through the mitogenic Grb2-Sos-Ras-MAPK pathway and affects glycogen metabolism and glucose transport through the metabolic PI3K-PKB pathway. Finally, there are several closely related IRS proteins (IRS2, IRS3), each with its own characteristic tissue distribution and function, further enriching the signaling possibilities in pathways initiated by RTKs.
 What spurred the evolution of such complicated regulatory machinery? This system allows one activated receptor to activate several IRS1 molecules, amplifying the insulin signal, and it provides for the integration of signals from different receptors such as EGFR and PDGFR, each of which can phosphorylate IRS1. Furthermore, because IRS1 can activate any of several proteins that contain SH2 domains, a single receptor acting through IRS1 can trigger two or more signaling pathways; insulin affects gene expression through the mitogenic Grb2-Sos-Ras-MAPK pathway and affects glycogen metabolism and glucose transport through the metabolic PI3K-PKB pathway. Finally, there are several closely related IRS proteins (IRS2, IRS3), each with its own characteristic tissue distribution and function, further enriching the signaling possibilities in pathways initiated by RTKs.
Cross Talk among Signaling Systems Is Common and Complex
For simplicity, we have treated individual signaling pathways as separate sequences of events leading to separate metabolic consequences, but there is, in fact, extensive cross talk among signaling systems. The regulatory circuitry that governs metabolism is richly interwoven and multilayered. We have discussed the signaling pathways for insulin and epinephrine separately, but they do not operate independently. Insulin opposes the metabolic effects of epinephrine in most tissues, and activation of the insulin signaling pathway directly reduces signaling through the β-adrenergic signaling system. For example, the INSR kinase directly phosphorylates two Tyr residues in the cytoplasmic tail of a -adrenergic receptor, and PKB, activated by insulin, phosphorylates two Ser residues in the same region (Fig. 12-27). Phosphorylation of these four residues triggers clathrin-aided internalization of the -adrenergic receptor, lowering the cell’s sensitivity to epinephrine.
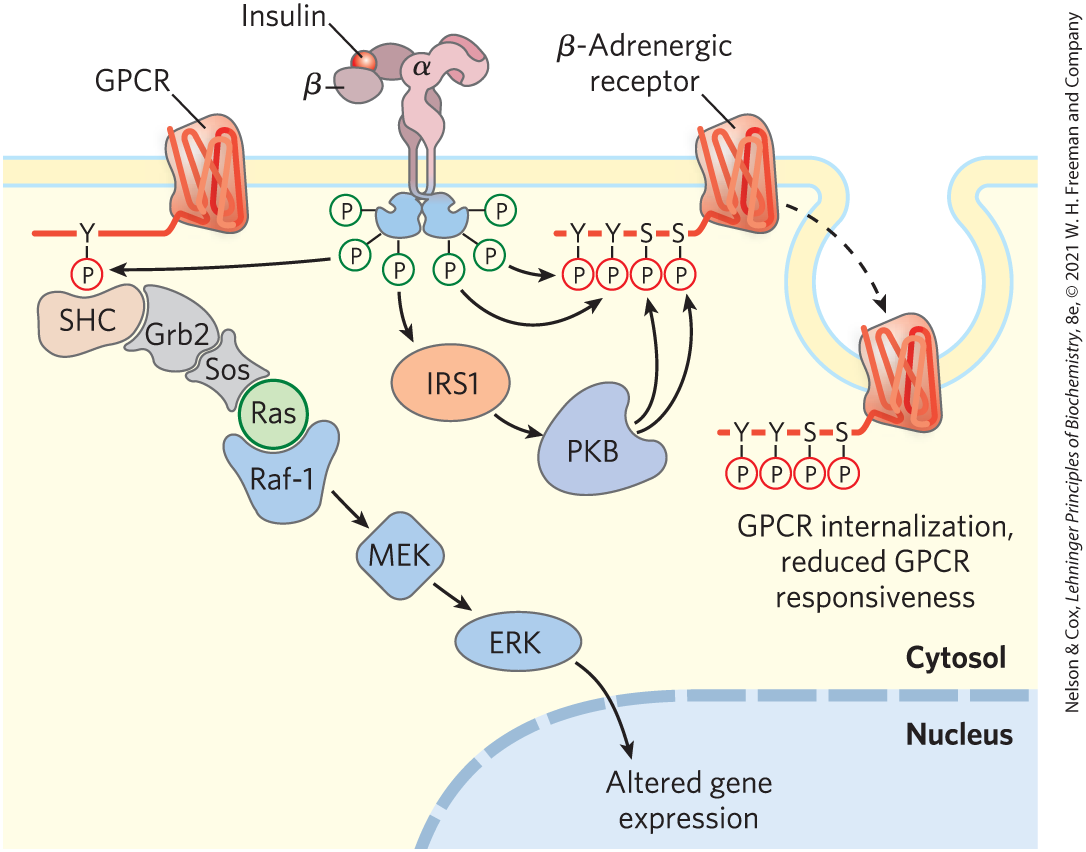
FIGURE 12-27 Cross talk between the insulin receptor and the β-adrenergic receptor (or other GPCR). When INSR is activated by insulin binding, its Tyr kinase directly phosphorylates the β-adrenergic receptor (right side) on two Tyr residues ( and ) near its carboxyl terminus, and indirectly causes phosphorylation of two Ser residues in the same region (through activation of protein kinase B (PKB). The effect of these phosphorylations is internalization of the adrenergic receptor, reducing the response to the adrenergic stimulus. Alternatively (left side), INSR-catalyzed phosphorylation of a GPCR (an adrenergic or other receptor) on a carboxyl-terminal Tyr creates the point of nucleation for activating the MAPK cascade (see Fig. 12-22), with Grb2 serving as the adaptor protein. In this case, INSR has used the GPCR to enhance its own signaling.
A second type of cross talk between these receptors occurs when –Tyr residues on the -adrenergic receptor, phosphorylated by INSR, serve as nucleation points for SH2 domain–containing proteins such as Grb2 (Fig. 12-27, left side). Activation of the MAPK ERK by insulin is 5- to 10-fold greater in the presence of the -adrenergic receptor, presumably because of this cross talk. Signaling systems that use cAMP and also show extensive interaction; each second messenger affects the generation and concentration of the other. Yet another factor that further complicates the signaling picture is that certain metabolic intermediates, such as fatty acids and ceramides, amino acids, and bile acids, can influence insulin signaling. One of the major challenges of systems biology is to sort out the effects of such interactions on the overall metabolic patterns in each tissue — a daunting task.
SUMMARY 12.4 Receptor Tyrosine Kinases
- The insulin receptor, INSR, is the prototype of receptor enzymes with Tyr kinase activity. When insulin binds, the receptor Tyr kinase is activated, and phosphorylates Tyr residues on other proteins, such as IRS. Phosphotyrosine residues of IRS1 serve as binding sites for proteins with SH2 domains. These multivalent proteins can serve as adaptors that bring two proteins into proximity. Sos bound to Grb2 activates Ras, which in turn activates a MAPK cascade that ends with the phosphorylation of target proteins in the cytosol and nucleus. The result is specific metabolic changes and altered gene expression.
- The enzyme PI3K, activated by interaction with IRS1, phosphorylates the membrane lipid to , which becomes the point of nucleation for proteins in a second and third branch of insulin signaling.
- Extensive interconnections among signaling pathways allow integration and fine-tuning of multiple hormonal effects.
 The insulin receptor, INSR, is the prototype of receptor enzymes with Tyr kinase activity. When insulin binds, the receptor Tyr kinase is activated, and phosphorylates Tyr residues on other proteins, such as IRS. Phosphotyrosine residues of IRS1 serve as binding sites for proteins with SH2 domains. These multivalent proteins can serve as adaptors that bring two proteins into proximity. Sos bound to Grb2 activates Ras, which in turn activates a MAPK cascade that ends with the phosphorylation of target proteins in the cytosol and nucleus. The result is specific metabolic changes and altered gene expression.