23.3 Hormonal Regulation of Fuel Metabolism
The minute-by-minute adjustments that keep the blood glucose level near 4.5 mm involve the combined actions of insulin, glucagon, epinephrine, and cortisol on metabolic processes in many body tissues, but especially in liver, muscle, and adipose tissue. Insulin signals to these tissues that blood glucose is higher than necessary; as a result, cells take up excess glucose from the blood and convert it to glycogen and triacylglycerols for storage. Glucagon signals that blood glucose is too low, and tissues respond by producing glucose through glycogen breakdown and (in the liver) gluconeogenesis, and by oxidizing fats to reduce the need for glucose. Epinephrine is released into the blood to prepare the muscles, lungs, and heart for a burst of activity. Cortisol mediates the body’s response to longer-term stresses.
 The minute-by-minute adjustments that keep the blood glucose level near 4.5 m
In this section, we discuss these hormonal regulations in the context of three normal metabolic states — well fed, fasted, and starving.
Insulin Counters High Blood Glucose in the Well-Fed State
After a high-carbohydrate meal, blood glucose rises several-fold. In response, insulin is released and acts through its plasma membrane receptors in muscle and liver (see Figs. 12-22, 12-23) to stimulate glucose uptake, phosphorylation, and oxidation via glycolysis and the citric acid cycle (Table 23-3). In response to insulin, GLUT4 glucose transporters sequestered in intracellular vesicles move to the plasma membrane, dramatically increasing the uptake of glucose from the blood (see Box 11-1). In the liver, insulin activates glycogen synthase and inactivates glycogen phosphorylase, so that much of the glucose 6-phosphate derived from blood glucose is channeled into glycogen.
Metabolic effect |
Target enzyme |
|---|---|
Glucose uptake (muscle, adipose tissue) |
Glucose transporter (GLUT4) |
Glucose uptake (liver) |
Glucokinase (increased expression) |
Glycogen synthesis (liver, muscle) |
Glycogen synthase |
Glycogen breakdown (liver, muscle) |
Glycogen phosphorylase |
Glycolysis, acetyl-CoA production (liver, muscle) |
PFK-1 (by PFK-2) Pyruvate dehydrogenase complex |
Fatty acid synthesis (liver) |
Acetyl-CoA carboxylase |
Triacylglycerol synthesis (adipose tissue) |
Lipoprotein lipase |
Insulin also stimulates the storage of excess fuel as fat in adipose tissue (Fig. 23-22). Excess acetyl-CoA not needed for energy production via the citric acid cycle is used for fatty acid synthesis. These fatty acids are converted to TAGs in the liver and exported to adipose tissue as components of plasma lipoproteins (VLDL; see Fig. 21-40). In adipose tissue, TAGs are released from VLDL as fatty acids, which are taken up by adipocytes and reconverted to TAGs for storage in response to insulin stimulation.
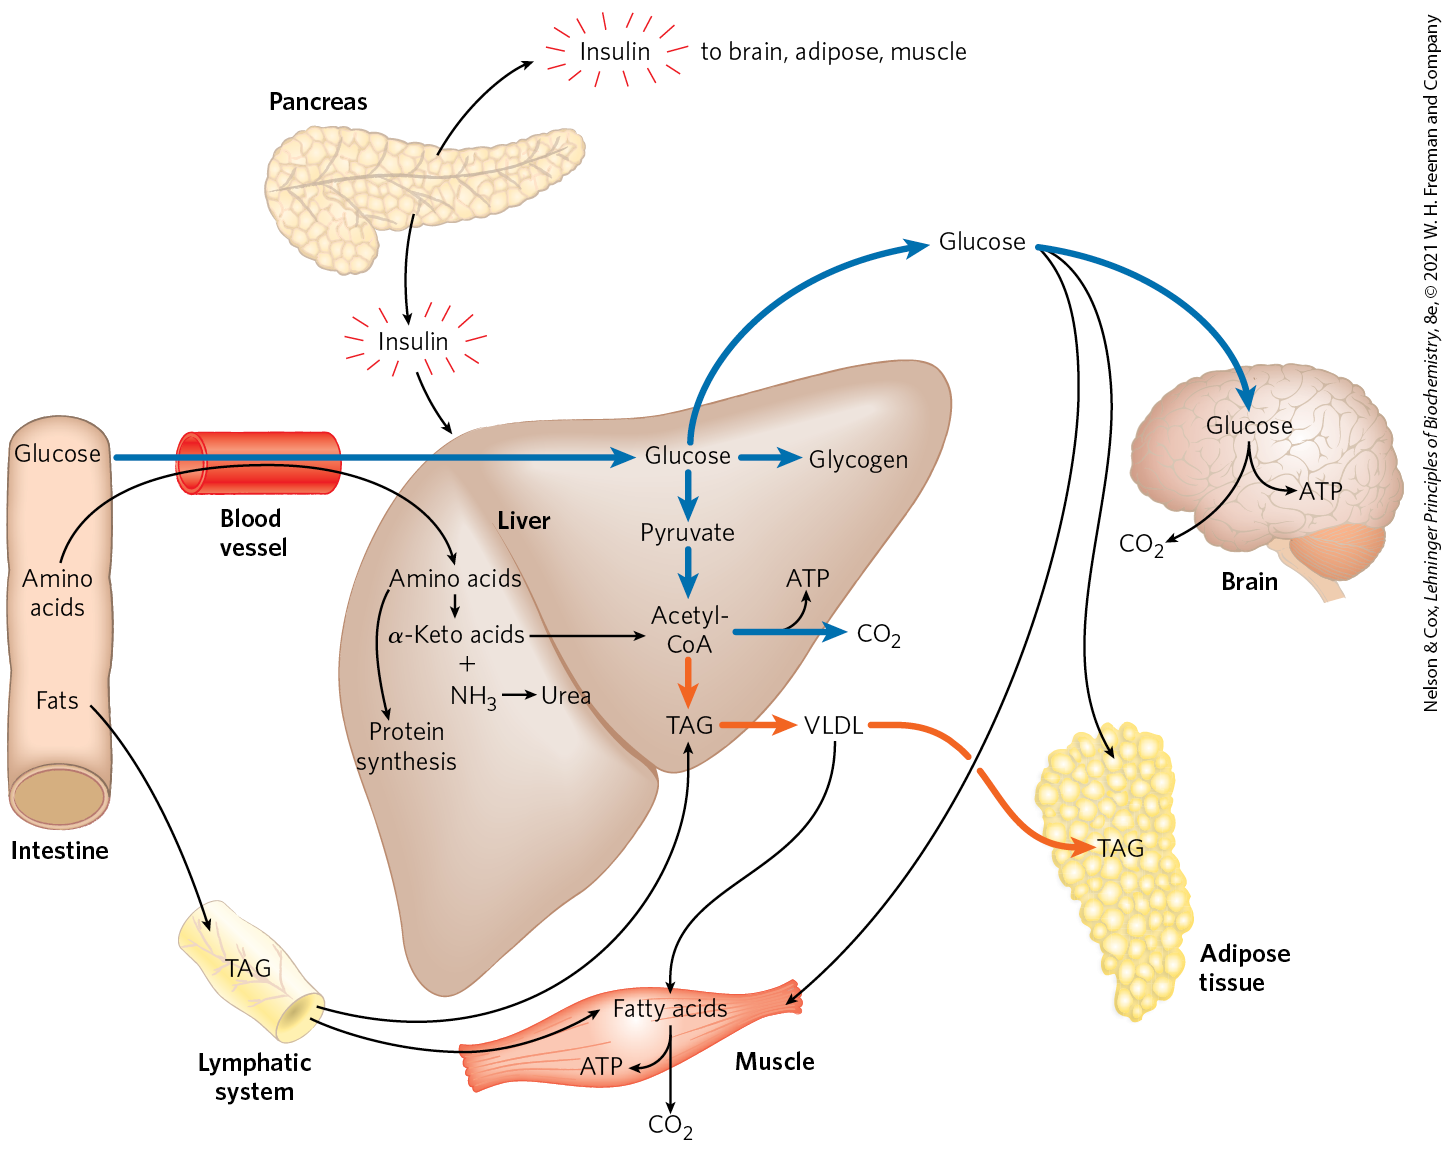
FIGURE 23-22 The well-fed state: the lipogenic liver. Immediately after a calorie-rich meal, glucose, fatty acids, and amino acids enter the liver. Blue arrows follow the path of glucose; orange arrows follow the path of lipids. Insulin released in response to the high blood glucose concentration stimulates glucose uptake by the tissues. Some glucose is exported to the brain for its energy needs, and some goes to adipose and muscle tissue. In the liver, excess glucose is oxidized to acetyl-CoA, which is used to make triacylglycerols for export to adipose and muscle tissue. The NADPH necessary for lipid synthesis is obtained by oxidation of glucose in the pentose phosphate pathway. Excess amino acids are converted to pyruvate and acetyl-CoA, which are also used for lipid synthesis. Dietary fats move from the intestine as chylomicrons, via the lymphatic system, to the liver, muscle, and adipose tissues.
In summary, an important effect of insulin is to bring about the conversion of excess blood glucose after a meal to two storage forms: glycogen (in the liver and muscle) and TAGs (in adipose tissue).
Pancreatic β Cells Secrete Insulin in Response to Changes in Blood Glucose
The peptide hormones insulin, glucagon, and somatostatin are produced by clusters of specialized pancreatic cells, the islets of Langerhans (Fig. 23-23). Each cell type of the islets produces a single hormone: α cells produce glucagon; β cells, insulin; and δ cells, somatostatin. When glucose enters the bloodstream from the intestine after a carbohydrate-rich meal, the resulting increase in blood glucose causes the pancreas to secrete insulin (and to decrease the secretion of glucagon).

FIGURE 23-23 The endocrine system of the pancreas. The pancreas contains both exocrine cells (see Fig. 18-3b), which secrete digestive enzymes in the form of zymogens, and clusters of endocrine cells, the islets of Langerhans. The islets contain α, β, and δ cells (also known as A, B, and D cells, respectively), each cell type secreting a specific peptide hormone.
As shown in Figure 23-24, when blood glucose rises, GLUT2 transporters carry glucose into the β cells, where it is immediately converted to glucose 6-phosphate by glucokinase and enters glycolysis. With the higher rate of glucose catabolism, [ATP] increases, causing ATP-gated channels in the plasma membrane to close. Reduced efflux of depolarizes the membrane. (Recall from Section 12.6 that exit of through an open channel hyperpolarizes the membrane; thus, closing the channel effectively depolarizes the membrane.) Membrane depolarization opens voltage-gated channels, and the resulting increase in cytosolic [] triggers the release of insulin by exocytosis. The brain integrates inputs on energy supply and demand, and signals from the parasympathetic and sympathetic nervous systems also affect (stimulate and inhibit, respectively) insulin release. A simple feedback loop limits hormone release: insulin lowers blood glucose by stimulating glucose uptake by the tissues; the reduced blood glucose is detected by the β cell as a diminished flux through the glucokinase reaction; this slows or stops the release of insulin. This feedback regulation holds blood glucose concentration nearly constant despite large fluctuations in dietary intake.
 GLUT2 transporters carry glucose into the β cells, where it is immediately converted to glucose 6-phosphate by glucokinase and enters glycolysis. With the higher rate of glucose catabolism,
  [ATP] increases, causing ATP-gated channels in the plasma membrane to close.
  Reduced efflux of depolarizes the membrane. (Recall from
  the resulting increase in cytosolic [] triggers
  the release of insulin by exocytosis. The brain integrates inputs on energy supply and demand, and signals from the parasympathetic and sympathetic nervous systems also affect (stimulate and inhibit, respectively) insulin release. A simple feedback loop limits hormone release: insulin lowers blood glucose by stimulating glucose uptake by the tissues; the reduced blood glucose is detected by the β cell as a diminished flux through the glucokinase reaction; this slows or stops the release of insulin. This feedback regulation holds blood glucose concentration nearly constant despite large fluctuations in dietary intake.
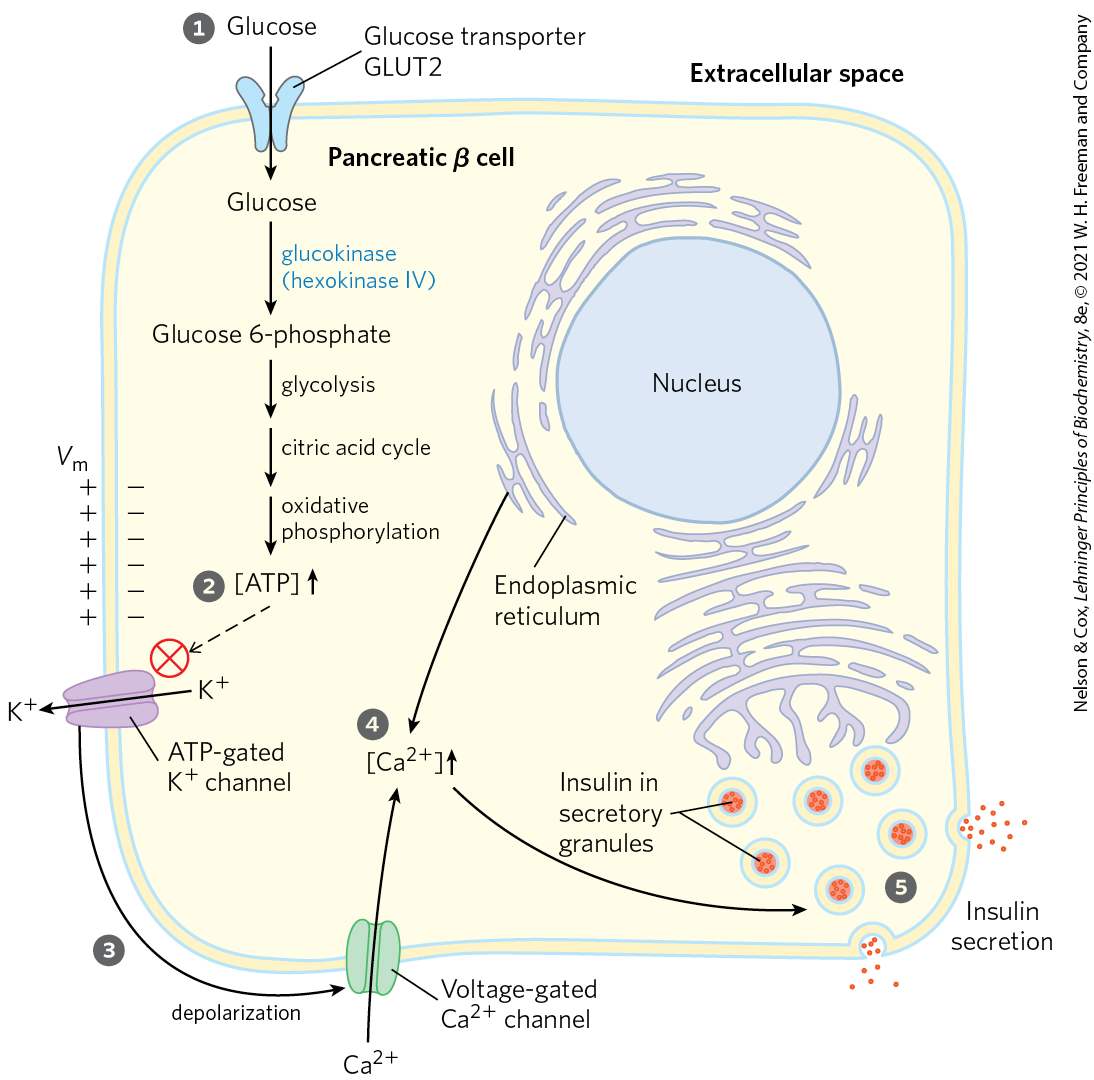
FIGURE 23-24 Glucose regulation of insulin secretion by pancreatic β cells. When the blood glucose level is high, active metabolism of glucose in the β cell raises intracellular [ATP], closing channels in the plasma membrane and thus depolarizing the membrane. In response to this membrane depolarization, voltage-gated channels open, allowing to flow into the cell. ( is also released from the ER, in response to the initial elevation of in the cytosol.) Cytosolic is now high enough to trigger insulin release by exocytosis. The numbered processes are discussed in the text.
The activity of ATP-gated channels is central to the regulation of insulin secretion by β cells. The channels are octamers of four identical Kir6.2 subunits and four identical SUR1 subunits (Fig. 23-25a) and are constructed along the same lines as the channels of bacteria and those of other eukaryotic cells (see Fig. 11-45). The four Kir6.2 subunits form a cone around the channel and function as the selectivity filter and ATP-gating mechanism (Fig. 23-25b). When [ATP] rises, indicating increased blood glucose, the channels close, thus depolarizing the plasma membrane and triggering insulin release as shown in Figure 23-24. The sulfonylurea drugs, oral medications used in the treatment of type 2 diabetes mellitus, bind to the SUR1 (sulfonylurea receptor) subunits of the channels, closing the channels and stimulating insulin release.
 The activity of ATP-gated channels is central to the regulation of insulin secretion by β cells. The channels are octamers of four identical Kir6.2 subunits and four identical SUR1 subunits (
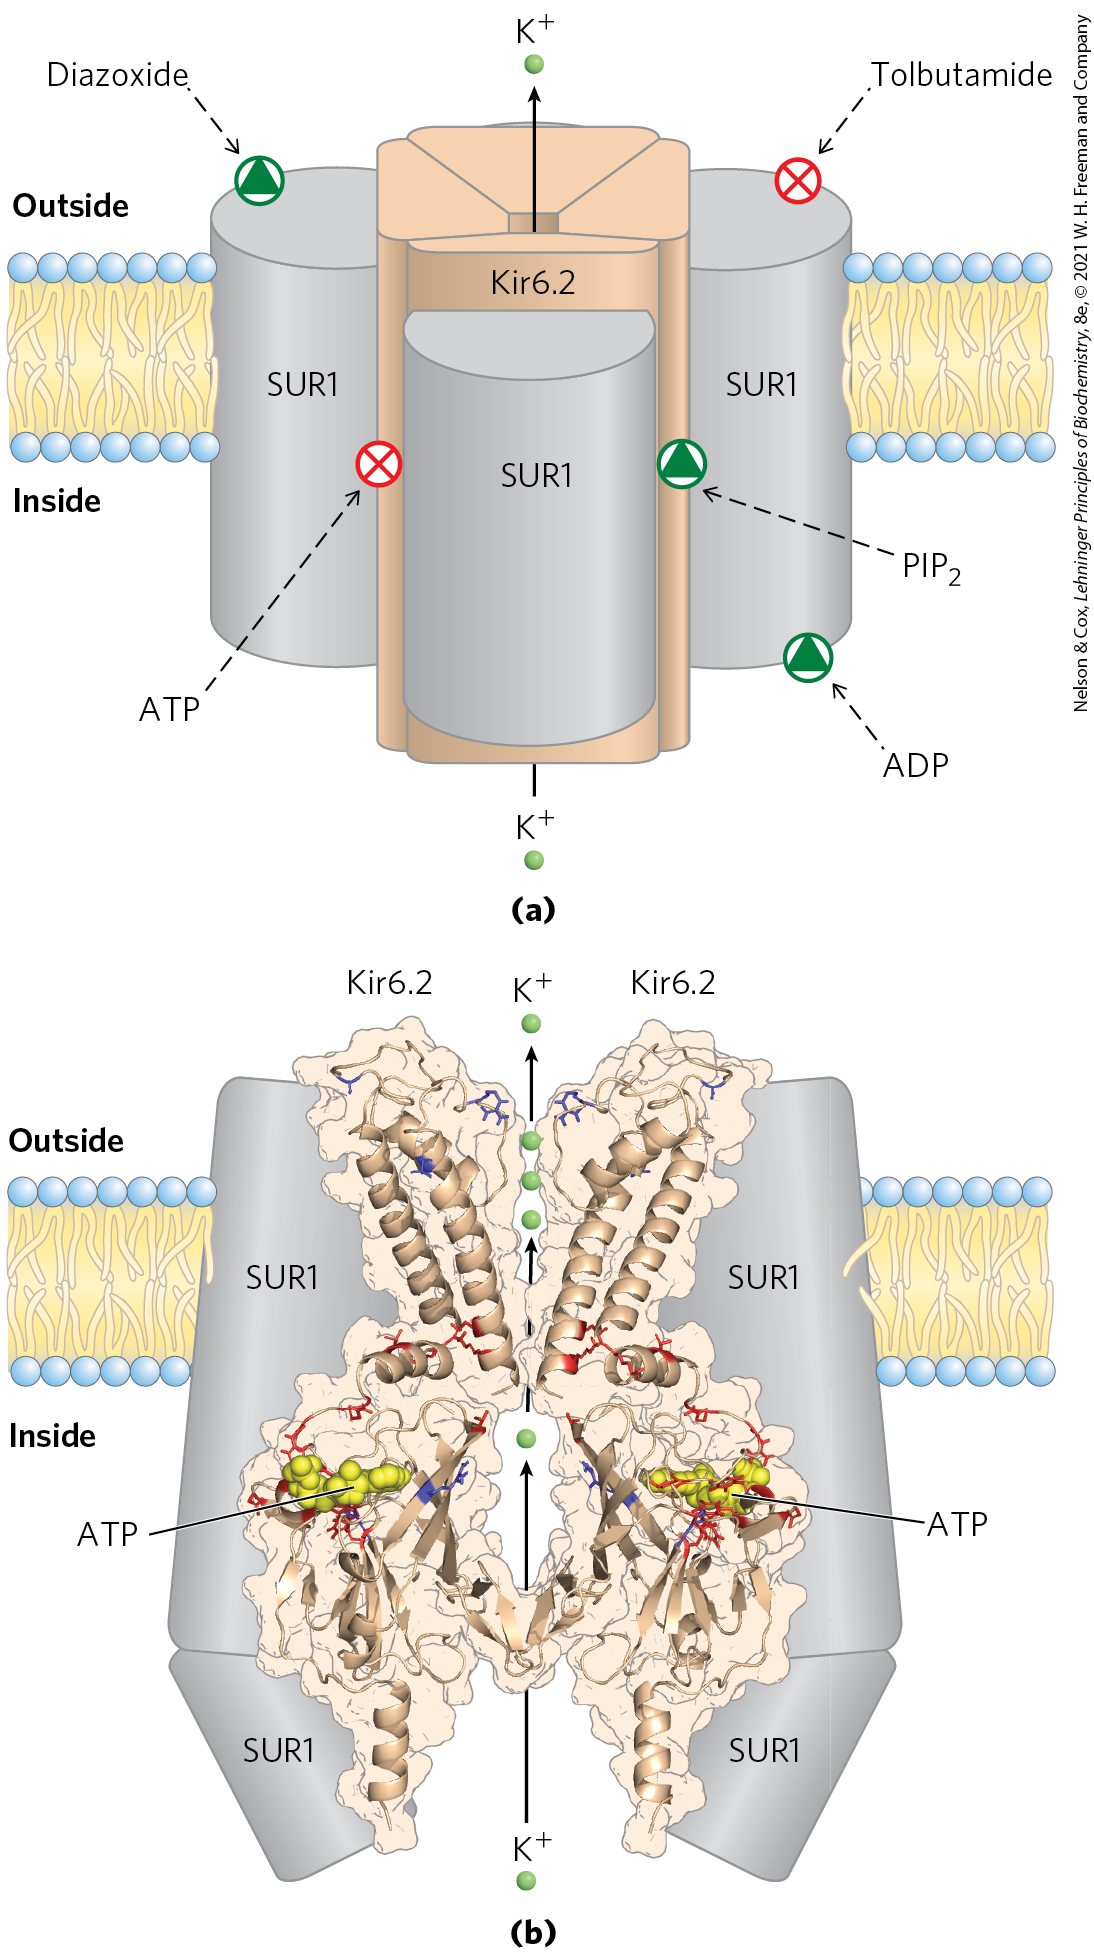
FIGURE 23-25 ATP-gated channels in β cells. (a) The ATP-gated channel, viewed in the plane of the membrane. The channel is formed by four identical Kir6.2 subunits, which are surrounded by four SUR1 (sulfonylurea receptor) subunits. The SUR1 subunits have binding sites for ADP and the drug diazoxide, both of which favor the open channel, and tolbutamide, a sulfonylurea drug that favors the closed channel. The Kir6.2 subunits constitute the channel, and they contain, on the cytosolic side, binding sites for ATP and phosphatidylinositol 4,5-bisphosphate , which favor the closed and the open channel, respectively. (b) The structure of the Kir6.2 portion of the channel, viewed in the plane of the membrane. For clarity, only two transmembrane domains and two cytosolic domains are shown. Three ions (green) are shown in the region of the selectivity filter. Mutation in certain amino acid residues (shown in red) leads to neonatal diabetes; mutation in others (shown in blue) leads to hyperinsulinism of infancy. This structure was obtained by mapping the known Kir6.2 sequence onto the crystal structures of a bacterial Kir channel (KirBac1.1) and the amino and carboxyl domains of another Kir protein, Kir3.1. [Data from (b) KirBac1.1: PDB ID 1P7B, A. Kuo et al., Science 300:1922, 2003; Kir3.1: PDB ID 1U4E, S. Pegan et al., Nature Neurosci. 8:279, 2005. Coordinates courtesy of Frances M. Ashcroft, Oxford University, used with permission of S. Haider and M. S. P. Sansom to re-create a model published in J. F. Antcliff et al., EMBO J. 24:229, 2005.]
Mutations in the ATP-gated channels of β cells are, fortunately, rare. Mutations in Kir6.2 that result in constantly open channels (red residues in Fig. 23-25b) lead to neonatal diabetes mellitus, with severe hyperglycemia that requires insulin therapy. Other mutations in Kir6.2 or SUR1 (blue residues in Fig. 23-25b) produce permanently closed channels and continuous release of insulin. If untreated, individuals with these mutations develop a condition in which excessive insulin causes severe hypoglycemia (low blood glucose) leading to irreversible brain damage. One effective treatment is surgical removal of part of the pancreas to reduce insulin production.

Glucagon Counters Low Blood Glucose
Several hours after the intake of dietary carbohydrate, blood glucose levels fall slightly because of the ongoing oxidation of glucose by the brain and other tissues. Lowered blood glucose triggers the pancreas to secrete glucagon and simultaneously decrease the release of insulin (Fig. 23-26).
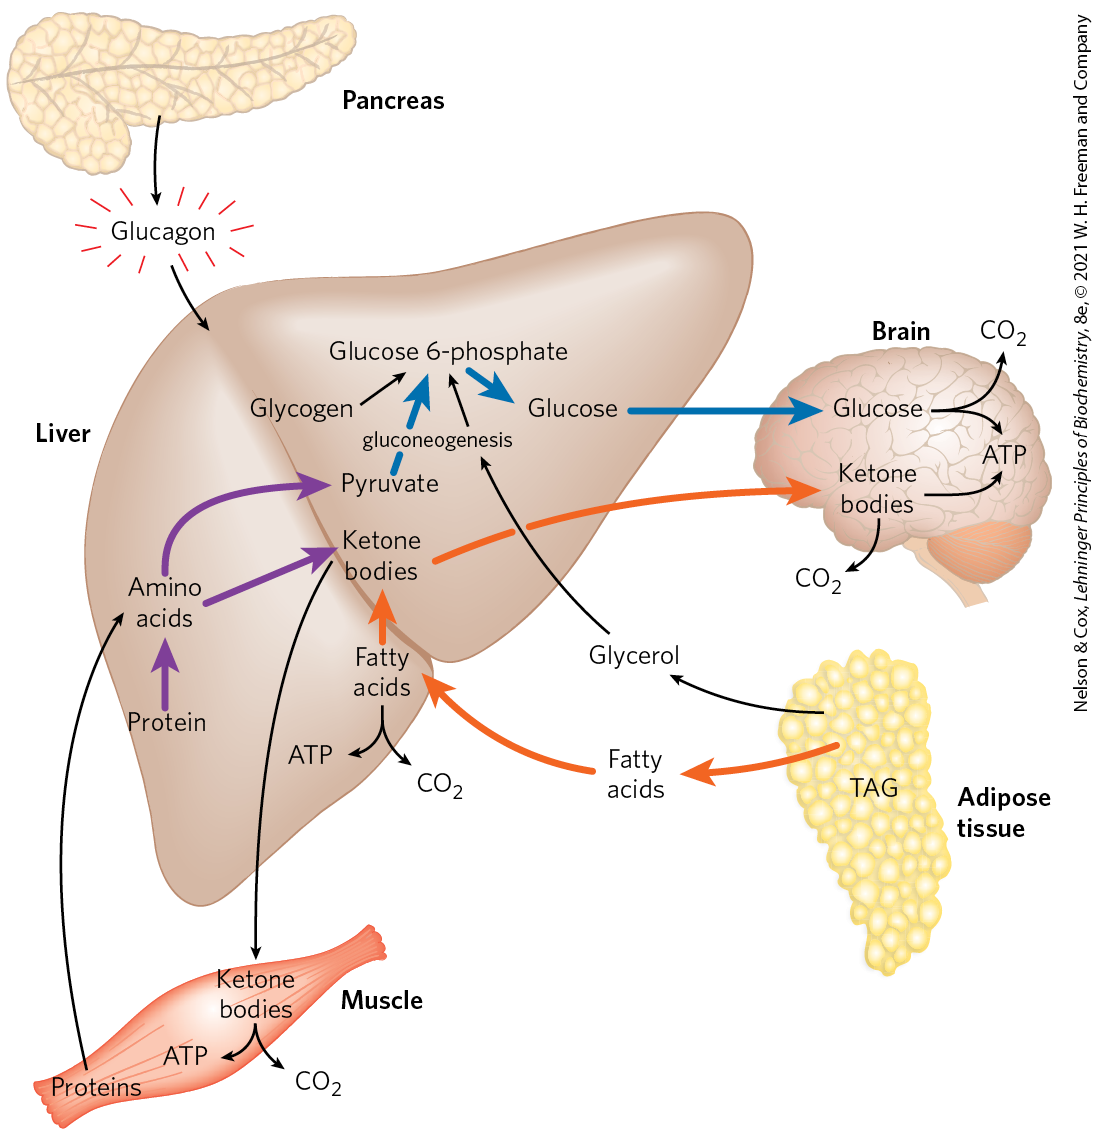
FIGURE 23-26 The fasting state: the glucogenic liver. After some hours without a meal, the liver becomes the principal source of glucose for the brain. Liver glycogen is broken down to glucose 1-phosphate, and this is converted to glucose 6-phosphate, then to free glucose, which is released into the bloodstream. Amino acids from the degradation of proteins in liver and muscle, and glycerol from the breakdown of TAGs in adipose tissue, are used for gluconeogenesis. The liver uses fatty acids as its principal fuel, and excess acetyl-CoA is converted to ketone bodies for export to other tissues; the brain is especially dependent on this fuel when glucose is in short supply (see Fig. 23-19). Blue arrows follow the path of glucose; orange arrows, the path of lipids; and purple arrows, the path of amino acids.
Glucagon causes an increase in blood glucose concentration in several ways (Table 23-4). Like epinephrine, it stimulates the net breakdown of liver glycogen by activating glycogen phosphorylase and inactivating glycogen synthase; both effects are the result of phosphorylation of the regulated enzymes, triggered by cAMP. Glucagon inhibits glucose breakdown by glycolysis in the liver and stimulates glucose synthesis by gluconeogenesis. Both effects result from lowering the concentration of fructose 2,6-bisphosphate, an allosteric inhibitor of the gluconeogenic enzyme fructose 1,6-bisphosphatase (FBPase-1) and an activator of the glycolytic enzyme phosphofructokinase-1. Recall that [fructose 2,6-bisphosphate] is ultimately controlled by a cAMP-dependent protein phosphorylation reaction (see Fig. 14-25). Glucagon also inhibits the glycolytic enzyme pyruvate kinase, by promoting its cAMP-dependent phosphorylation, thus blocking the conversion of phosphoenolpyruvate to pyruvate and preventing oxidation of pyruvate via the citric acid cycle (see Fig. 14-26). The resulting accumulation of phosphoenolpyruvate favors gluconeogenesis. This effect is augmented by glucagon’s stimulation of the synthesis of the gluconeogenic enzyme PEP carboxykinase. By stimulating glycogen breakdown, preventing glycolysis and promoting gluconeogenesis in hepatocytes, glucagon enables the liver to export glucose, restoring blood glucose to its normal level.
Metabolic effect |
Effect on glucose metabolism |
Target enzyme |
|---|---|---|
Glycogen breakdown (liver) |
Glycogen glucose |
Glycogen phosphorylase |
Glycogen synthesis (liver) |
Less glucose stored as glycogen |
Glycogen synthase |
Glycolysis (liver) |
Less glucose used as fuel in liver |
PFK-1 |
Gluconeogenesis (liver) |
 |
FBPase-2 Pyruvate kinase PEP carboxykinase |
Fatty acid mobilization (adipose tissue) |
Less glucose used as fuel by liver, muscle |
Hormone-sensitive lipase |
PKA (perilipin–) |
||
Ketogenesis |
Provides alternative to glucose as energy source for brain |
Acetyl-CoA carboxylase |
 )
)Although its primary target is the liver, glucagon (like epinephrine) also affects adipose tissue, activating TAG breakdown by causing cAMP-dependent phosphorylation of perilipin and hormone-sensitive lipase. The activated lipase liberates free fatty acids, which are exported to the liver and other tissues as fuel, sparing glucose for the brain. The net effect of glucagon is therefore to stimulate glucose synthesis and release by the liver and to mobilize fatty acids from adipose tissue, to be used instead of glucose by tissues other than the brain. All these effects of glucagon are mediated by cAMP-dependent protein phosphorylation.
During Fasting and Starvation, Metabolism Shifts to Provide Fuel for the Brain
A healthy adult human has three types of fuel reserves: glycogen stored in the liver and, in smaller quantities, in muscles; large quantities of TAG in adipose tissues; and tissue proteins, which can be degraded when necessary to provide fuel (Table 23-5).
Type of fuel |
Weight (kg) |
Caloric equivalent (thousands of kcal (kJ)) |
Estimated survival (months)a |
|---|---|---|---|
Normal-weight, 70 kg man |
|||
Triacylglycerols (adipose tissue) |
15 |
140 (590) |
|
Proteins (mainly muscle) |
6 |
24 (100) |
|
Glycogen (muscle, liver) |
0.23 |
0.90 (3.8) |
|
Circulating fuels (glucose, fatty acids, triacylglycerols, etc.) |
0.023 |
0.10 (0.42) |
|
Total |
165 (690) |
3 |
|
Obese, 140 kg man |
|||
Triacylglycerols (adipose tissue) |
80 |
750 (3,100) |
|
Proteins (mainly muscle) |
8 |
32 (130) |
|
Glycogen (muscle, liver) |
0.23 |
0.92 (3.8) |
|
Circulating fuels |
0.025 |
0.11 (0.46) |
|
Total |
783 (3,200) |
14 |
|
Two hours after a meal, the blood glucose level is diminished slightly, and tissues receive glucose released from liver glycogen. There is little or no synthesis of TAGs. By four hours after a meal, blood glucose has fallen further, insulin secretion has slowed, and glucagon secretion has increased. These hormonal signals mobilize TAGs from adipose tissue, which now become the primary fuel for muscle and liver. Figure 23-27 shows the responses to prolonged fasting. To provide glucose for the brain, the liver degrades certain proteins — those most expendable in an organism not ingesting food. Their nonessential amino acids are transaminated or deaminated (Chapter 18), and the extra amino groups are converted to urea, which is exported via the bloodstream to the kidneys and excreted in the urine.
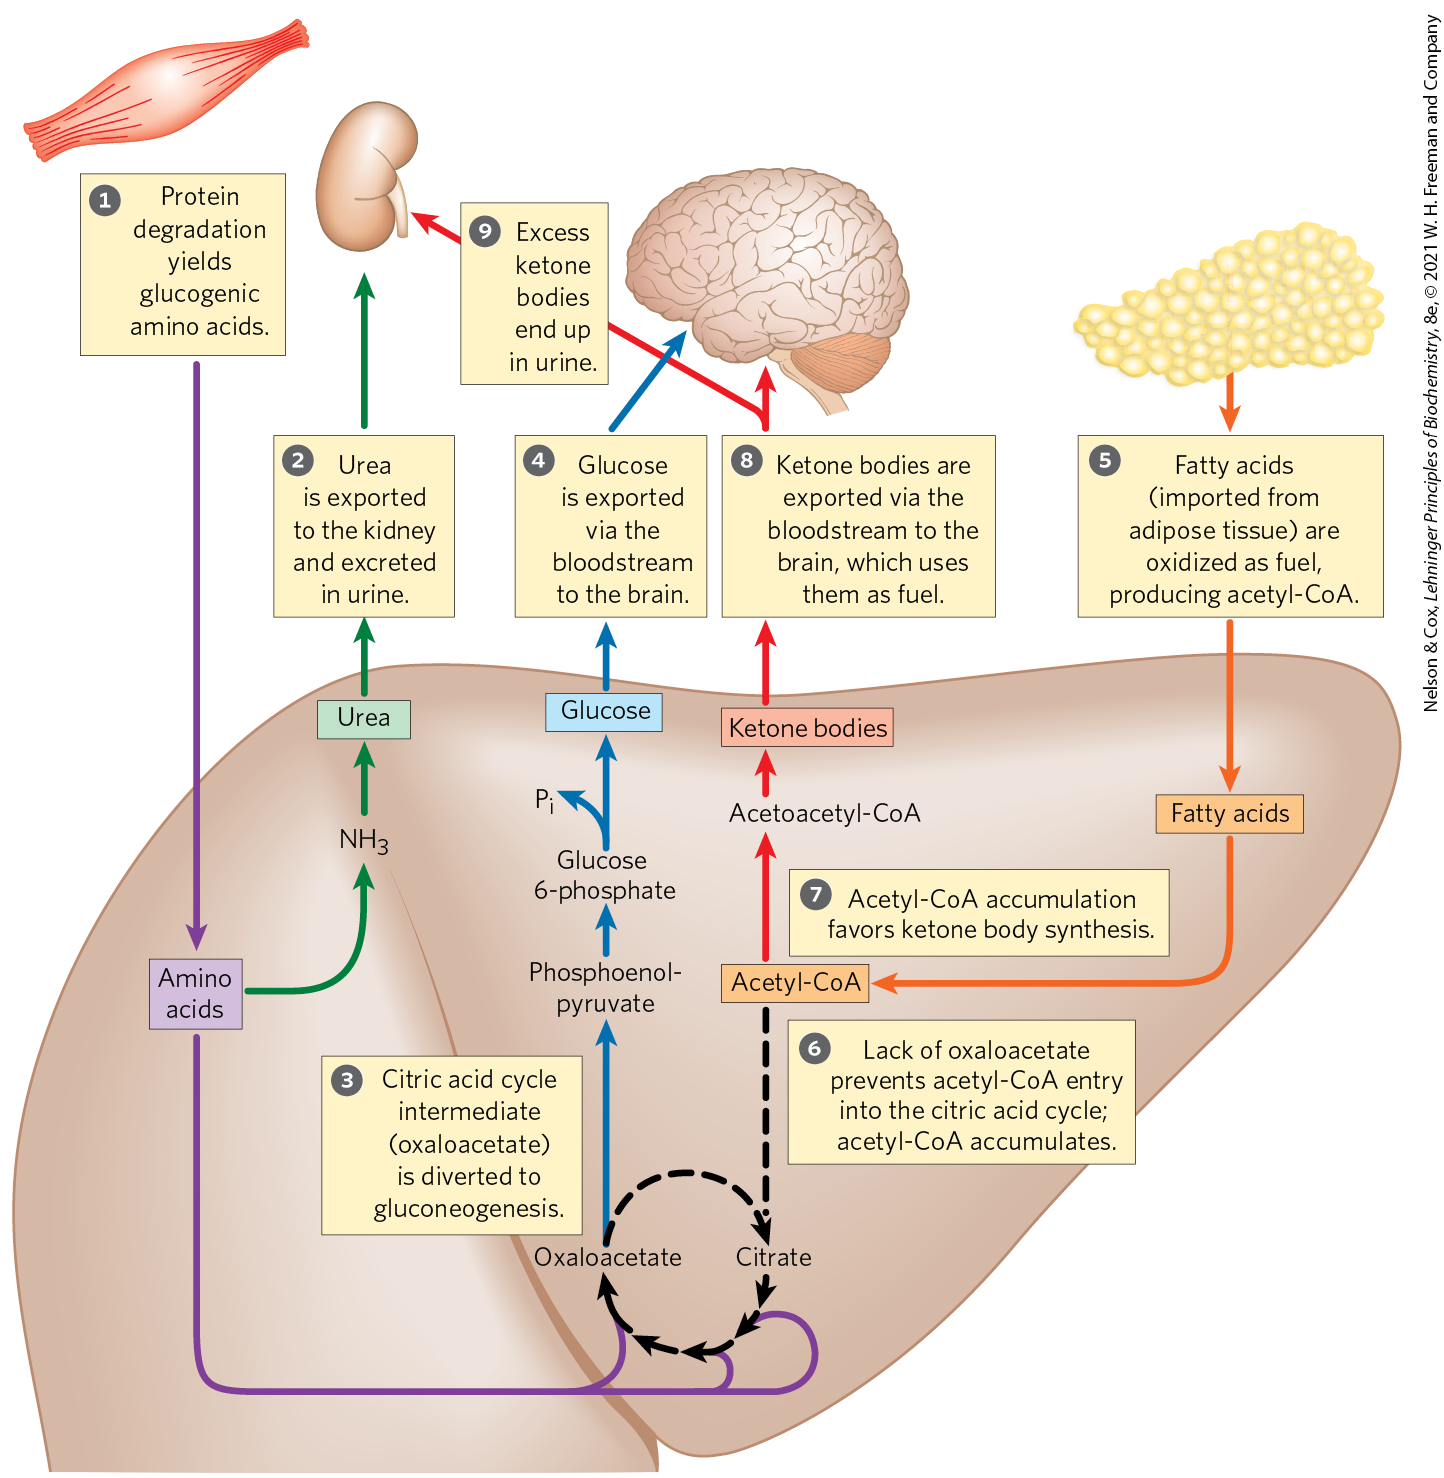
FIGURE 23-27 Fuel metabolism in the liver during prolonged fasting or in uncontrolled diabetes mellitus. The numbered steps are described in the text. After depletion of stored carbohydrates (glycogen), gluconeogenesis in the liver becomes the main source of glucose for the brain (blue arrows). from amino acid deamination is converted into urea and excreted (green arrows). Glucogenic amino acids from protein breakdown (purple arrows) provide substrates for gluconeogenesis, and glucose is exported to the brain. Fatty acids from adipose tissue are imported into the liver and oxidized to acetyl-CoA (orange arrows), and acetyl-CoA is the starting material for ketone body formation in the liver and for export to the brain to serve as an energy source (red arrows). Excess ketone bodies are excreted in the urine.
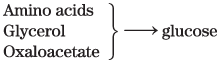
Also in the liver, and to some extent in the kidneys, the carbon skeletons of glucogenic amino acids are converted to pyruvate or intermediates of the citric acid cycle. These intermediates (as well as the glycerol derived from TAGs in adipose tissue) provide the starting materials for gluconeogenesis in the liver, yielding glucose for export to the brain. Fatty acids released from adipose tissue are oxidized to acetyl-CoA in the liver, but as oxaloacetate is depleted by the use of citric acid cycle intermediates for gluconeogenesis, entry of acetyl-CoA into the cycle is inhibited and acetyl-CoA accumulates. This favors the formation of acetoacetyl-CoA and ketone bodies. After a few days of fasting, the levels of ketone bodies in the blood rise (Fig. 23-28) as they are exported from the liver to the heart, skeletal muscle, and brain, which use these fuels instead of glucose (Fig. 23-27, ). When the concentration of ketone bodies in the blood exceeds the ability of the kidneys to reabsorb ketones , these compounds begin to appear in the urine.
 entry of acetyl-CoA into the cycle is inhibited and acetyl-CoA accumulates.
  This favors the formation of acetoacetyl-CoA and ketone bodies. After a few days of fasting, the levels of ketone bodies in the blood rise (
 ). When the concentration of ketone bodies in the blood exceeds the ability of the kidneys to reabsorb ketones
  , these compounds begin to appear in the urine.
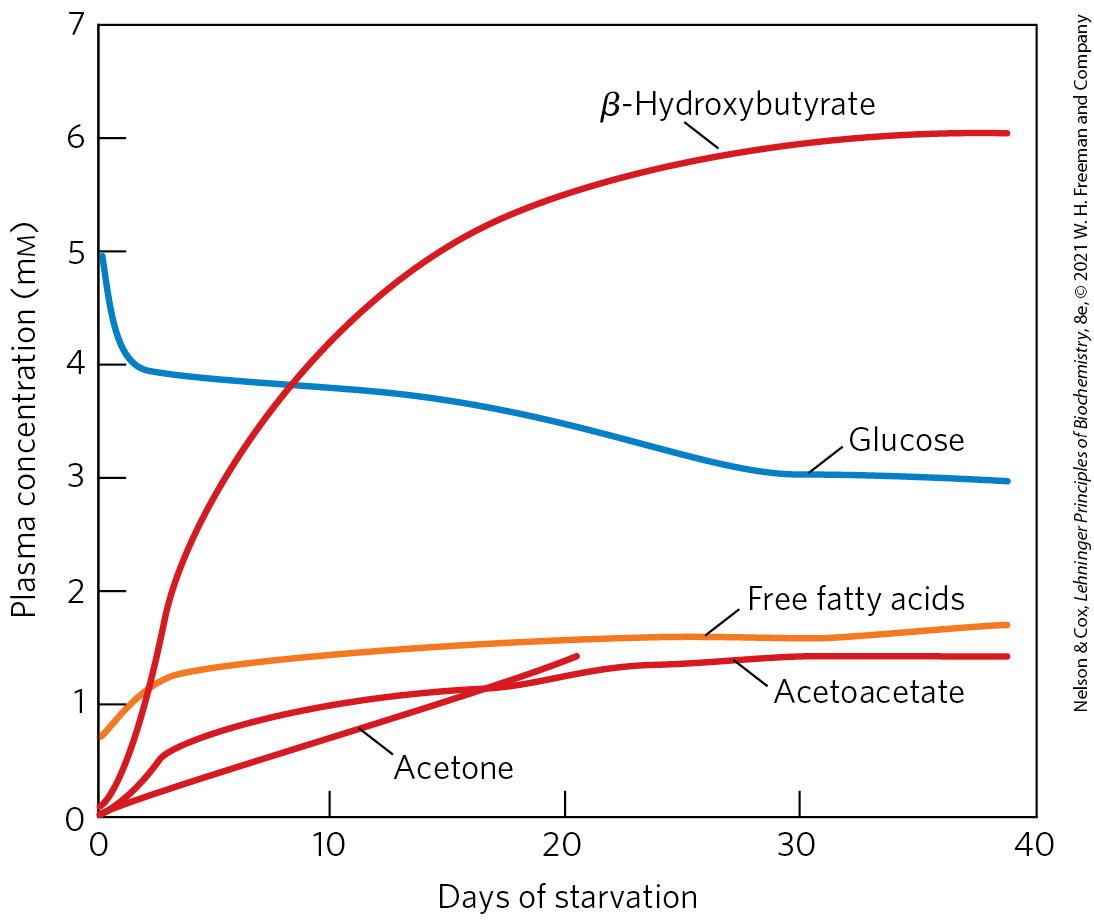
FIGURE 23-28 Plasma concentrations of fatty acids, glucose, and ketone bodies during six weeks of starvation. Despite the hormonal mechanisms for maintaining the glucose level in blood, glucose begins to diminish within 2 days of beginning a fast. The levels of ketone bodies, almost unmeasurable before the fast, rise dramatically after 2 to 4 days of fasting, with β-hydroxybutyrate as the major contributor. These water-soluble ketones, acetoacetate and β-hydroxybutyrate, supplement glucose as an energy source for the brain during a long fast. Acetone, a minor ketone body, is not metabolized but is eliminated in the breath. A much smaller rise in blood fatty acids also occurs, but this does not contribute to energy metabolism in the brain, as fatty acids do not cross the blood-brain barrier. [Data from G. F. Cahill, Jr., Annu. Rev. Nutr. 26:1, 2006, Fig. 2.]
Triacylglycerols stored in the adipose tissue of a normal-weight adult could provide enough fuel to maintain a basal rate of metabolism for about three months; a very obese adult has enough stored fuel to endure a fast of more than a year (Table 23-5). When fat reserves are gone, the degradation of essential proteins begins; this leads to loss of heart and liver function and, in prolonged starvation, to death. Stored fat can provide adequate energy (calories) during a fast or a rigid diet, but vitamins and minerals must be provided, and sufficient dietary glucogenic amino acids are needed to replace those being used for gluconeogenesis. Rations for those on a weight-reduction diet are commonly fortified with vitamins, minerals, and amino acids or proteins.
Epinephrine Signals Impending Activity
When an animal is confronted with a stressful situation that requires increased activity — fighting or fleeing, in the extreme case — neuronal signals from the brain trigger the release of epinephrine and norepinephrine from the adrenal medulla. Both hormones dilate the respiratory passages to facilitate the uptake of , increase the rate and strength of the heartbeat, and raise the blood pressure, thereby promoting the flow of and fuels to the tissues (Table 23-6). This is the “fight-or-flight” response.
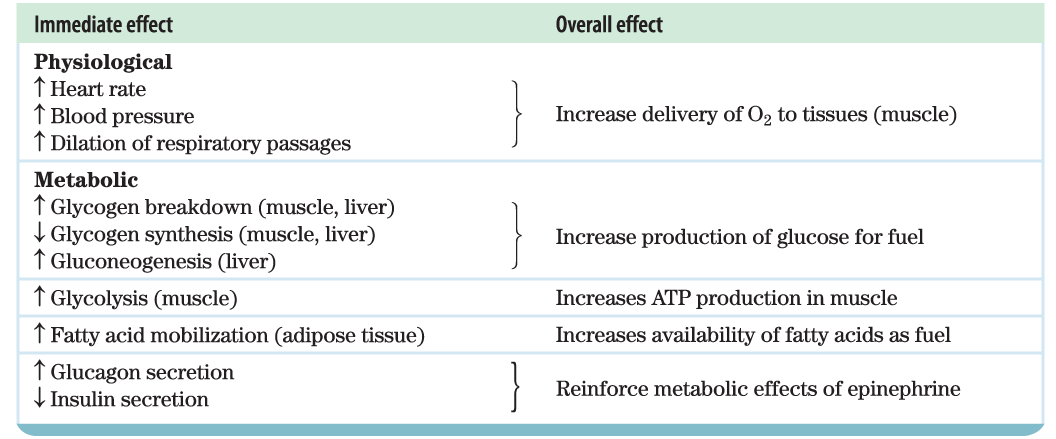 |
Epinephrine acts primarily on muscle, adipose, and liver tissues. It activates glycogen phosphorylase and inactivates glycogen synthase by cAMP-dependent phosphorylation of the enzymes, thus stimulating the conversion of liver glycogen to blood glucose, the fuel for anaerobic muscular work. Epinephrine also promotes the anaerobic breakdown of muscle glycogen by lactic acid fermentation, stimulating glycolytic ATP formation. The stimulation of glycolysis is accomplished by raising the concentration of fructose 2,6-bisphosphate, a potent allosteric activator of the key glycolytic enzyme phosphofructokinase-1. Epinephrine also stimulates fat mobilization in adipose tissue, by activating hormone-sensitive lipase and moving aside perilipin (see Fig. 17-2). Finally, epinephrine stimulates glucagon secretion and inhibits insulin secretion, reinforcing its effect of mobilizing fuels and inhibiting fuel storage.
Cortisol Signals Stress, Including Low Blood Glucose
A variety of stressors (anxiety, fear, pain, hemorrhage, infection, low blood glucose, starvation) stimulate release of the glucocorticoid cortisol from the adrenal cortex (see Fig. 23-6). Cortisol acts on muscle, liver, and adipose tissue to supply the organism with fuel to withstand the stress. Cortisol is a relatively slow-acting hormone that alters metabolism by changing the kinds and amounts of certain enzymes synthesized in its target cells, rather than by regulating the activity of existing enzyme molecules.
In adipose tissue, cortisol leads to an increased release of fatty acids from stored TAGs. The exported fatty acids serve as fuel for other tissues, and the glycerol is used for gluconeogenesis in the liver. Cortisol stimulates the breakdown of nonessential muscle proteins and the export of amino acids to the liver, where they serve as precursors for gluconeogenesis. In the liver, cortisol promotes gluconeogenesis by stimulating synthesis of PEP carboxykinase; glucagon has the same effect, whereas insulin has the opposite effect. Glucose produced in this way is stored in the liver as glycogen or exported immediately to tissues that need glucose for fuel. The net effect of these metabolic changes is to restore blood glucose to its normal level and to increase glycogen stores, ready to support the fight-or-flight response commonly associated with stress. The effects of cortisol therefore counterbalance those of insulin. During extended periods of stress, the continued release of cortisol loses its positive adaptive value and begins to cause damage to muscle and bone and to impair endocrine and immune function.
Cushing disease is a medical condition in which a tumor on the pituitary gland causes the adrenal glands to overproduce cortisol. It is treated by surgery to remove the tumor, followed by chemotherapy to kill remaining tumor cells. Addison disease results from underproduction of cortisol, and is treated by administering hydrocortisone (the pharmaceutical name for cortisol).
SUMMARY 23.3 Hormonal Regulation of Fuel Metabolism
- Fluctuations in blood glucose (normally 70 to 100 mg/100 mL, or about 4.5 mm) due to dietary intake or vigorous exercise are counterbalanced by a variety of hormonally triggered changes in metabolism in several organs.
- High blood glucose elicits the release of insulin, which speeds the uptake of glucose by tissues and favors the storage of fuels as glycogen and triacylglycerols while inhibiting fatty acid mobilization in adipose tissue.
- Low blood glucose triggers release of glucagon, which stimulates glucose release from liver glycogen and shifts fuel metabolism in liver and muscle to fatty acid oxidation, sparing glucose for use by the brain. In prolonged fasting, TAGs become the principal fuel; the liver converts the fatty acids to ketone bodies for export to other tissues, including the brain.
- Epinephrine prepares the body for increased activity by mobilizing glucose from glycogen and other precursors, releasing the glucose into the blood.
- Cortisol, released in response to a variety of stressors (including low blood glucose), stimulates gluconeogenesis from amino acids and glycerol in the liver, thus raising blood glucose and counterbalancing the effects of insulin.
 Fluctuations in blood glucose (normally 70 to 100 mg/100 mL, or about 4.5 m