19.3 Regulation of Oxidative Phosphorylation
Oxidative phosphorylation produces most of the ATP made in aerobic cells. Complete oxidation of a molecule of glucose to yields 30 or 32 ATP (Table 19-5). By comparison, glycolysis under anaerobic conditions (lactate fermentation) yields only 2 ATP per glucose. Clearly, the evolution of oxidative phosphorylation provided a tremendous increase in the energy efficiency of catabolism. Complete oxidation to of the coenzyme A derivative of palmitate (16:0), which also occurs in the mitochondrial matrix, yields 108 ATP per palmitoyl-CoA (see Table 17-1). A similar calculation can be made for the ATP yield from oxidation of each of the amino acids (Chapter 18). Aerobic oxidative pathways that result in electron transfer to accompanied by oxidative phosphorylation therefore account for the vast majority of the ATP produced in catabolism, so the regulation of ATP production by oxidative phosphorylation to match the cell’s fluctuating needs for ATP is absolutely essential.
Process |
Direct product |
Final ATP |
|---|---|---|
Glycolysis |
2 NADH (cytosolic) 2 ATP |
3 or 5a 2 |
Pyruvate oxidation (two per glucose) |
2 NADH (mitochondrial matrix) |
5 |
Acetyl-CoA oxidation in citric acid cycle (two per glucose) |
6 NADH (mitochondrial matrix)
2 ATP or 2 GTP |
15 3 2 |
Total yield per glucose |
30 or 32 |
|
| aIf the malate/aspartate shuttle is used to transfer reducing equivalents into the mitochondrion, the yield is 5 ATP. If the glycerol 3-phosphate shuttle is used, the yield is 3 ATP. | ||
Oxidative Phosphorylation Is Regulated by Cellular Energy Needs
The rate of respiration ( consumption) in mitochondria is generally limited by the availability of ADP as a substrate for phosphorylation. Dependence of the rate of consumption on the availability of the acceptor, ADP (Fig. 19-20b), the acceptor control of respiration, can be remarkable. In some animal tissues, the acceptor control ratio, the ratio of the maximal rate of ADP-induced consumption to the basal rate in the absence of ADP, is at least 10.
The intracellular concentration of ADP is one measure of the energy status of cells. Another, related measure is the mass-action ratio of the ATP-ADP system, . Usually this ratio is very high, so the ATP-ADP system is almost fully phosphorylated. When the rate of some energy-requiring process (protein synthesis, for example) increases, the rate of breakdown of ATP to ADP and increases, lowering the mass-action ratio. With more ADP available for oxidative phosphorylation, the rate of respiration increases, causing regeneration of ATP. This continues until the mass-action ratio returns to its normal high level, at which point respiration slows again. The rate of oxidation of cellular fuels is regulated with such sensitivity and precision that the ratio fluctuates only slightly in most tissues, even during extreme variations in energy demand. In short, ATP is formed only as fast as it is used in energy-requiring cellular activities.
An Inhibitory Protein Prevents ATP Hydrolysis during Hypoxia
We have already encountered ATP synthase as an ATP-driven proton pump (see Fig. 11-40), catalyzing the reverse of ATP synthesis under some experimental conditions. When a cell is hypoxic (deprived of oxygen), as in a heart attack or a stroke, electron transfer to oxygen slows, and so does the pumping of protons. The proton-motive force soon collapses. Under these conditions, the ATP synthase could operate in reverse, hydrolyzing ATP made by glycolysis to pump protons outward and causing a disastrous drop in ATP levels. This is prevented by a small (84 amino acids) protein inhibitor, . simultaneously binds to two ATP synthase molecules, inhibiting the enzyme’s activity in both directions (Fig. 19-33). is inhibitory only in its dimeric form, which is favored at pH lower than 6.5. In a cell starved for oxygen, the main source of ATP becomes glycolysis, and the pyruvic or lactic acid thus formed lowers the pH in the cytosol and the mitochondrial matrix. This favors dimerization, leading to inhibition of ATP synthase and thereby preventing any wasteful hydrolysis of ATP. When aerobic metabolism resumes, production of pyruvic acid slows, the pH of the cytosol rises, the dimer is destabilized, and the inhibition of ATP synthase is lifted. is an intrinsically disordered protein (p. 117); it acquires a favored conformation only on interaction with ATP synthase. In many tumors and cancer cell lines, which rely more heavily on glycolysis for ATP generation, is expressed at unusually high levels.
 Under these conditions, the ATP synthase could operate in reverse, hydrolyzing ATP made by glycolysis to pump protons outward and causing a disastrous drop in ATP levels. This is prevented by a small (84 amino acids) protein inhibitor, . simultaneously binds to two ATP synthase molecules, inhibiting the enzyme’s activity in both directions (
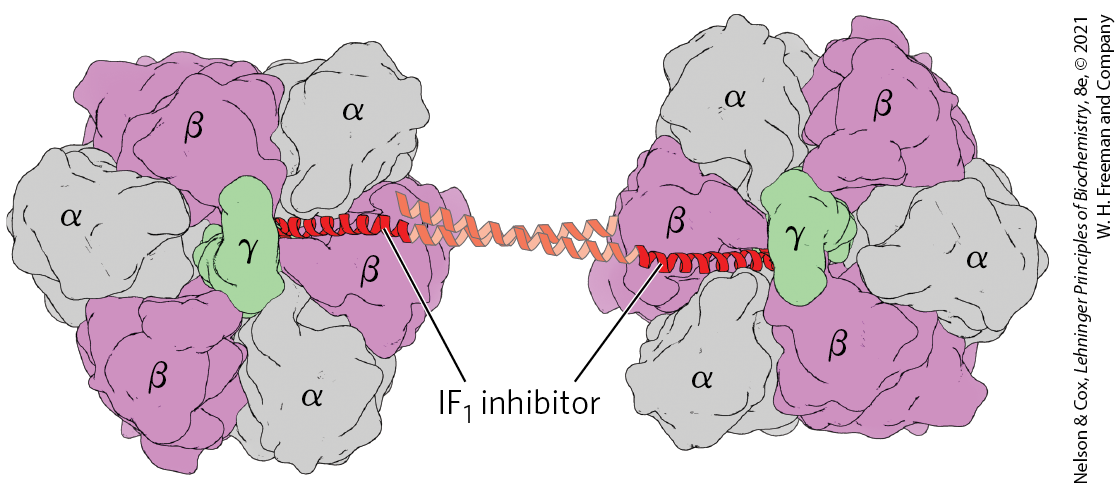
FIGURE 19-33 Structure of bovine -ATPase in a complex with its regulatory protein . Two molecules are viewed here from the n side, as in Figure 19-25b. The inhibitor (red) binds to the interface of the subunits in the diphosphate (ADP) conformation (α-ADP and β-ADP), freezing the two complexes and thereby blocking ATP hydrolysis (and synthesis). (Parts of the -helices that link the two molecules failed to resolve in the crystals of and are modeled based on the crystal structure of isolated .) [Data from PDB ID 1OHH, E. Cabezon et al., Nat. Struct. Biol. 10:744, 2003.]
Hypoxia Leads to ROS Production and Several Adaptive Responses
In hypoxic cells there is an imbalance between the input of electrons from fuel oxidation in the mitochondrial matrix and transfer of electrons to molecular oxygen, leading to increased formation of reactive oxygen species. In addition to the glutathione peroxidase system (Fig. 19-18), cells have two other lines of defense against ROS (Fig. 19-34). One is regulation of pyruvate dehydrogenase (PDH), the enzyme that delivers acetyl-CoA to the citric acid cycle (Chapter 16). Under hypoxic conditions, PDH kinase phosphorylates mitochondrial PDH, inactivating it and slowing the delivery of and NADH from the citric acid cycle to the respiratory chain. A second means of preventing ROS formation is the replacement of one subunit of Complex IV, known as COX4-1, with another subunit, COX4-2, that is better suited to hypoxic conditions. With COX4-1, the catalytic properties of Complex IV are optimal for respiration at normal oxygen concentrations; with COX4-2, Complex IV is optimized for operation under hypoxic conditions.
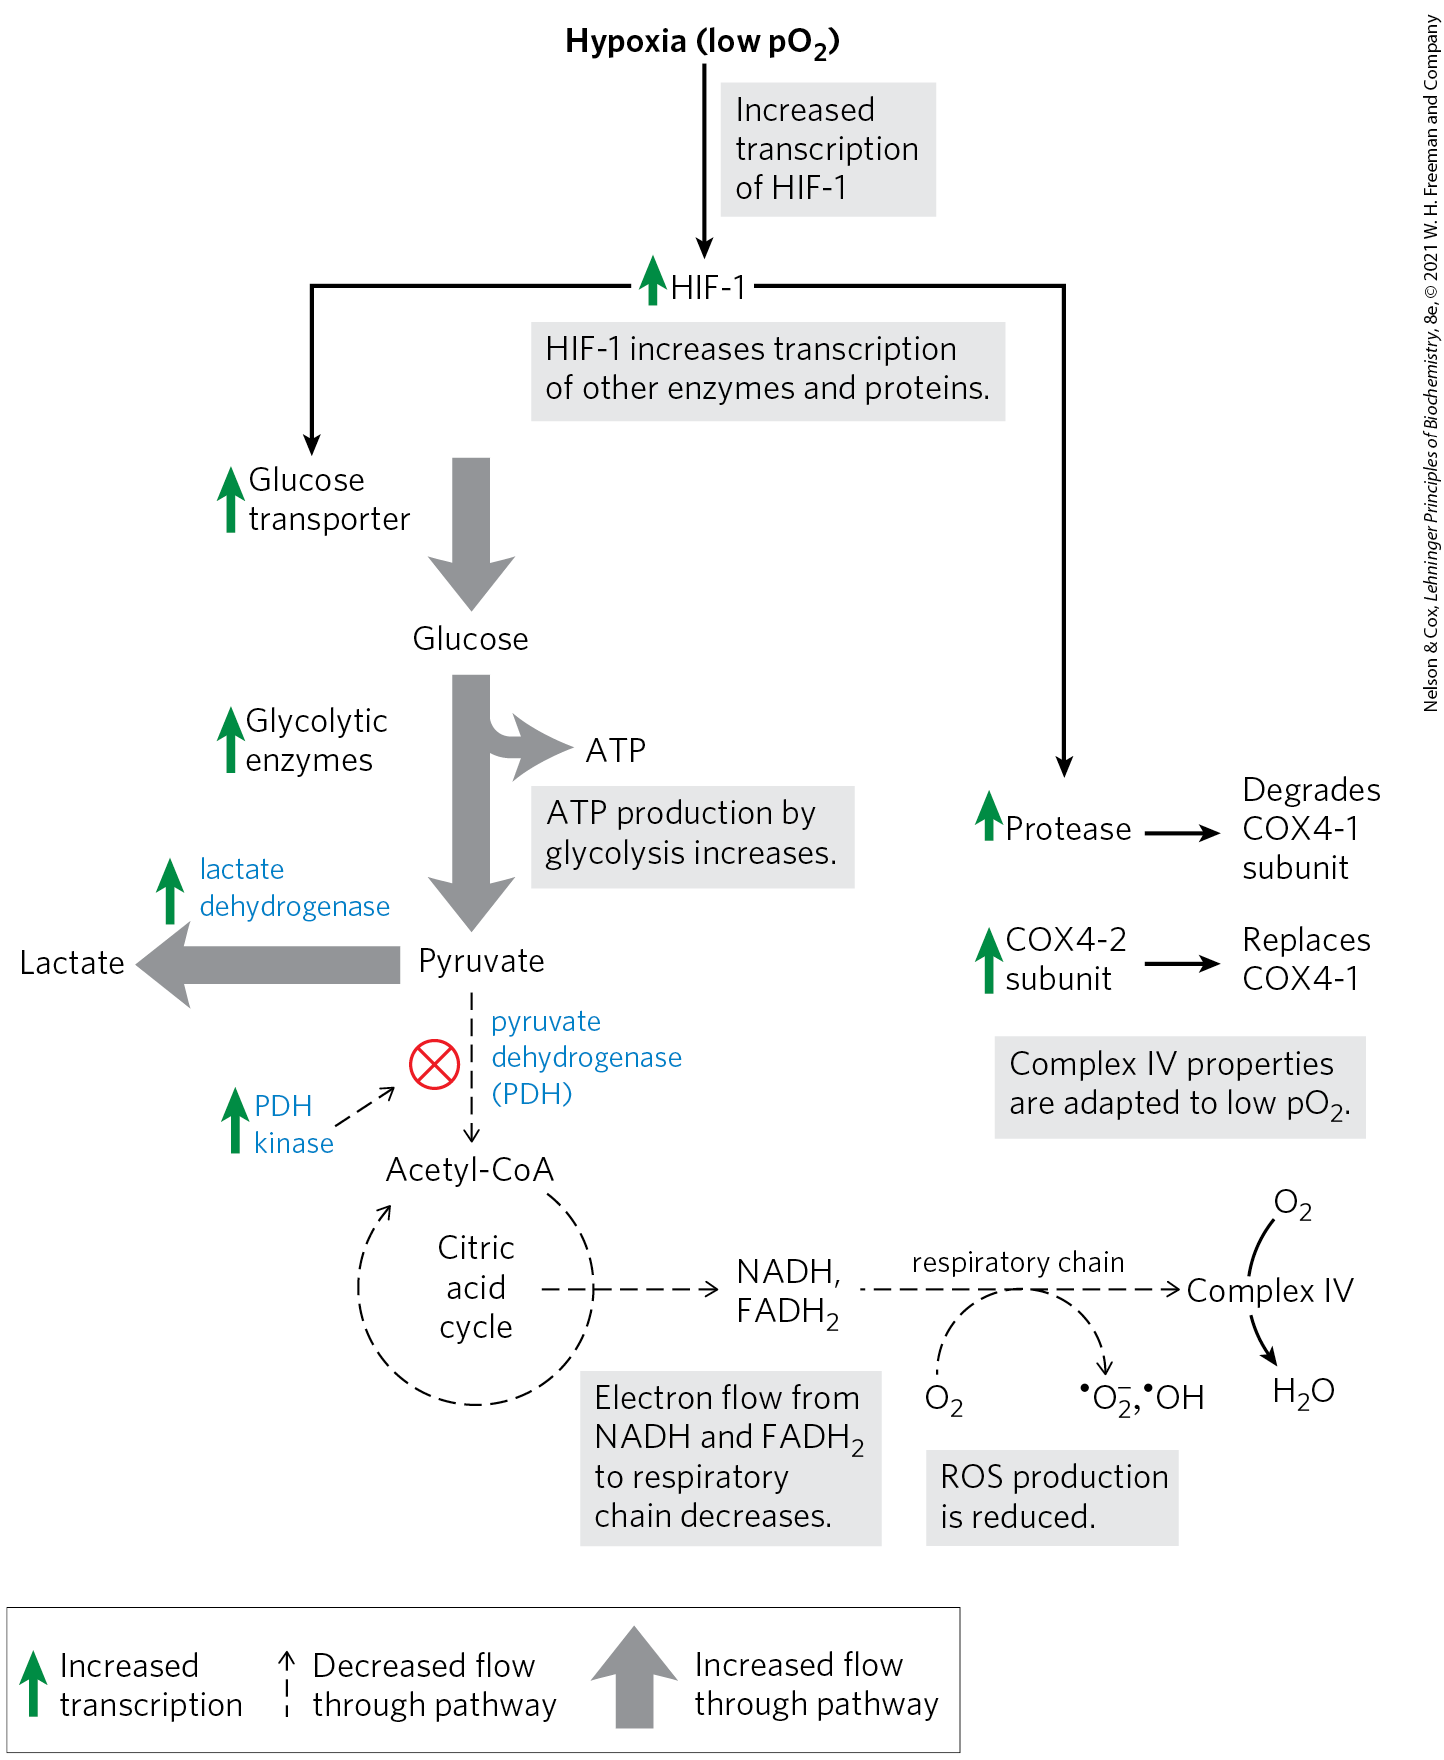
FIGURE 19-34 Regulation of gene expression by hypoxia-inducible factor (HIF-1) to reduce ROS formation. Under conditions of low oxygen (hypoxia), HIF-1 is synthesized in greater amounts and acts as a transcription factor, increasing synthesis of the glucose transporter, glycolytic enzymes, pyruvate dehydrogenase kinase (PDH kinase), lactate dehydrogenase, a protease that degrades the cytochrome oxidase subunit COX4-1, and cytochrome oxidase subunit COX4-2. These changes counter the formation of ROS by decreasing the supply of NADH and and making cytochrome oxidase of Complex IV more effective. [Information from D. A. Harris, Bioenergetics at a Glance, p. 36, Blackwell Science, 1995.]
The changes in PDH activity and the COX4-2 content of Complex IV are both mediated by HIF-1, the hypoxia-inducible factor. HIF-1 (another intrinsically disordered protein) accumulates in hypoxic cells and, acting as a transcription factor, triggers increased synthesis of PDH kinase, COX4-2, and a protease that degrades COX4-1. HIF-1 is a master regulator of homeostasis. Recall that it also mediates the changes in glucose transport and glycolytic enzymes that produce the Warburg effect, the dependence on glycolysis (not mitochondrial respiration) for ATP production, even in the presence of sufficient oxygen (see Box 14-1).
When these mechanisms for dealing with ROS are insufficient, either due to genetic mutation affecting one of the protective proteins or under conditions of very high rates of ROS production, mitochondrial function is compromised. Mitochondrial damage is thought to be involved in aging, heart failure, certain rare cases of diabetes (described below), and several maternally inherited genetic diseases that affect the nervous system.
 When these mechanisms for dealing with ROS are insufficient, either due to genetic mutation affecting one of the protective proteins or under conditions of very high rates of ROS production, mitochondrial function is compromised. Mitochondrial damage is thought to be involved in aging, heart failure, certain rare cases of diabetes (described below), and several maternally inherited genetic diseases that affect the nervous system.
ATP-Producing Pathways Are Coordinately Regulated
The major catabolic pathways have overlapping and concerted regulatory mechanisms that allow them to function together in an economical and self-regulating manner to produce ATP and biosynthetic precursors. The relative concentrations of ATP and ADP control not only the rates of electron transfer and oxidative phosphorylation but also the rates of the citric acid cycle, pyruvate oxidation, and glycolysis (Fig. 19-35). Whenever ATP consumption increases, the rate of electron transfer and oxidative phosphorylation increases. Simultaneously, the rate of pyruvate oxidation via the citric acid cycle increases, increasing the flow of electrons into the respiratory chain. These events, in turn, can evoke an increased rate of glycolysis, increasing the rate of pyruvate formation. When conversion of ADP to ATP lowers the ADP concentration, acceptor control slows electron transfer and thus oxidative phosphorylation. Glycolysis and the citric acid cycle are also slowed, because ATP is an allosteric inhibitor of the glycolytic enzyme phosphofructokinase-1 (see Fig. 14-23) and of pyruvate dehydrogenase (see Fig. 16-18).
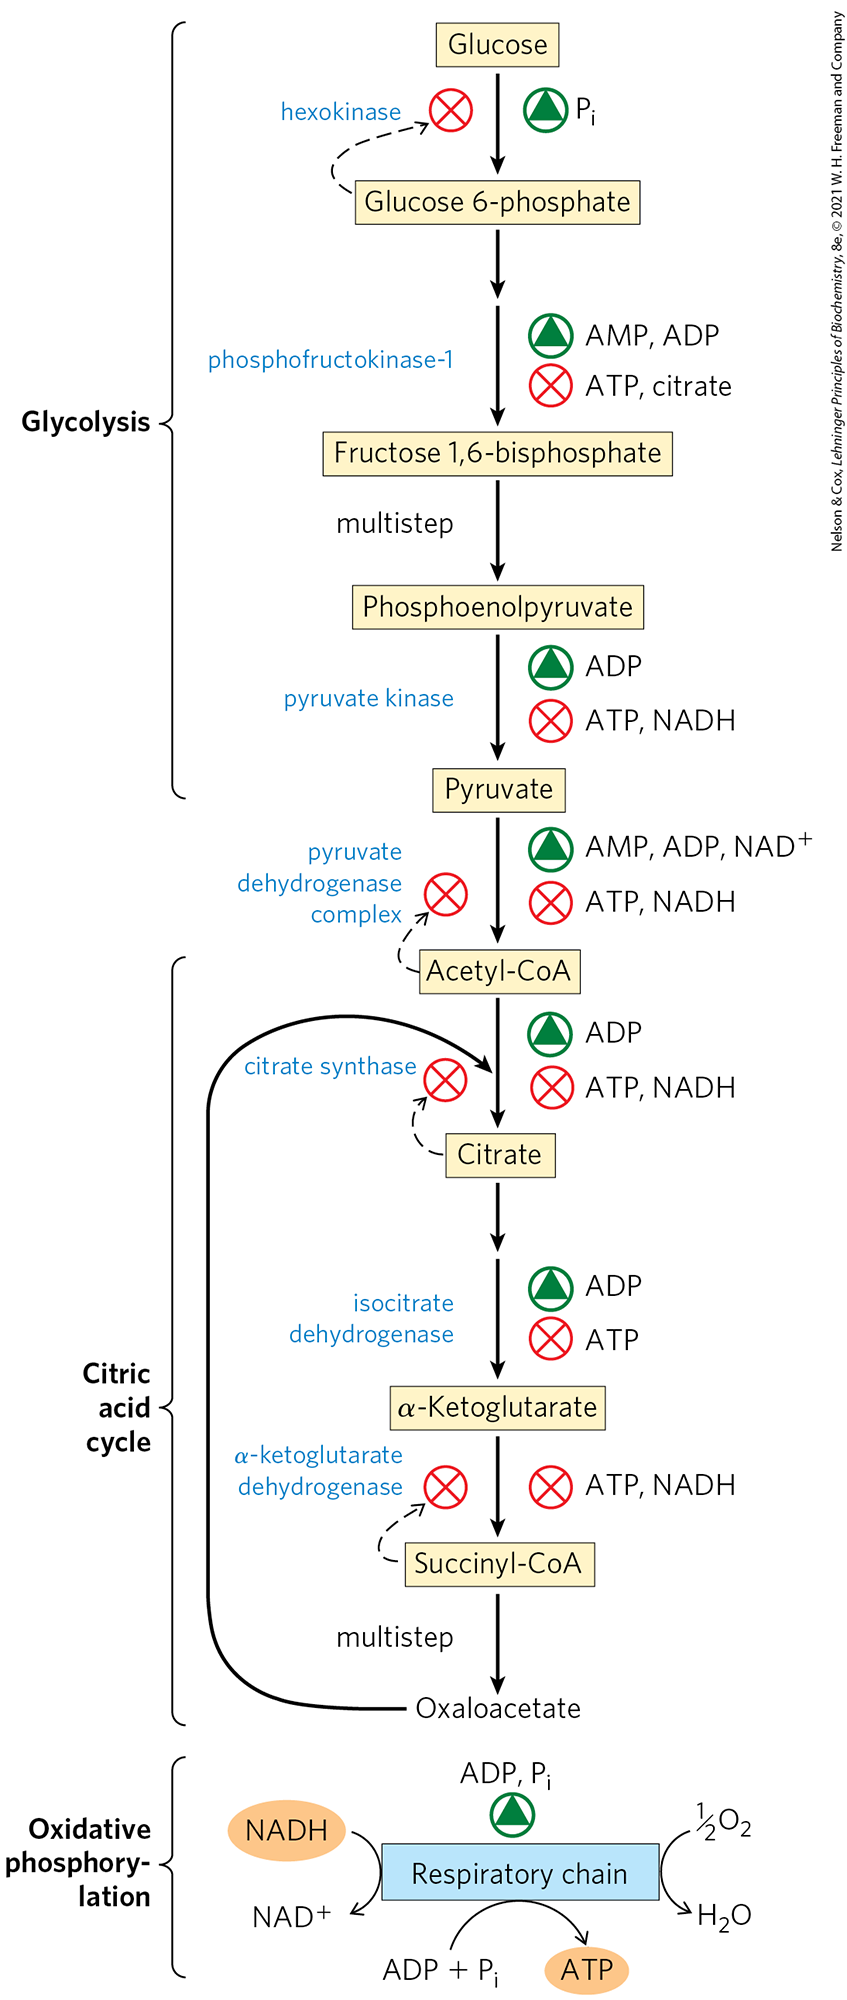
FIGURE 19-35 Regulation of ATP-producing pathways. This diagram shows the coordinated regulation of glycolysis, pyruvate oxidation, the citric acid cycle, and oxidative phosphorylation by the relative concentrations of ATP, ADP, and AMP, and by NADH. High [ATP] (or low [ADP] and [AMP]) produces low rates of glycolysis, pyruvate oxidation, acetate oxidation via the citric acid cycle, and oxidative phosphorylation. All four pathways are accelerated when the use of ATP and the formation of ADP, AMP, and increase. The ability of citrate to inhibit both glycolysis and the citric acid cycle reinforces the action of the adenine nucleotide system. In addition, increased [NADH] and [acetyl-CoA] also inhibit the oxidation of pyruvate to acetyl-CoA, and a high ratio inhibits the dehydrogenase reactions of the citric acid cycle (see Fig. 16-18).
Phosphofructokinase-1 is also inhibited by citrate, the first intermediate of the citric acid cycle. When the cycle is “idling,” citrate accumulates within mitochondria, then is transported into the cytosol. When the cytosolic concentrations of both ATP and citrate rise, they produce a concerted allosteric inhibition of phosphofructokinase-1 that is greater than the sum of their individual effects, slowing glycolysis.
SUMMARY 19.3 Regulation of Oxidative Phosphorylation
- Oxidative phosphorylation is regulated by cellular energy demands. Intracellular [ADP] and the mass-action ratio are measures of a cell’s energy status.
- In hypoxic (oxygen-deprived) cells, a protein inhibitor blocks ATP hydrolysis by the reverse activity of ATP synthase, preventing a drastic drop in [ATP].
- The adaptive responses to hypoxia, mediated by HIF-1, slow electron transfer into the respiratory chain and modify Complex IV to act more efficiently under low-oxygen conditions.
- ATP and ADP concentrations set the rate of electron transfer through the respiratory chain via a series of coordinated controls on respiration, glycolysis, and the citric acid cycle.
 Oxidative phosphorylation is regulated by cellular energy demands. Intracellular [ADP] and the mass-action ratio are measures of a cell’s energy status.