13.5 Regulation of Metabolic Pathways
Metabolic regulation is one of the most remarkable features of living organisms. Of the thousands of enzyme-catalyzed reactions that can take place in a cell, there is probably not one that escapes some form of regulation. This need to regulate every aspect of cellular metabolism becomes clear as one examines the complexity of metabolic reaction sequences. Although it is convenient for the student of biochemistry to divide metabolic processes into “pathways” that play discrete roles in the cell’s economy, no such separation exists in the living cell. Rather, every pathway we discuss in this book is inextricably intertwined with all the other cellular pathways in a multidimensional network of reactions (Fig. 13-28).
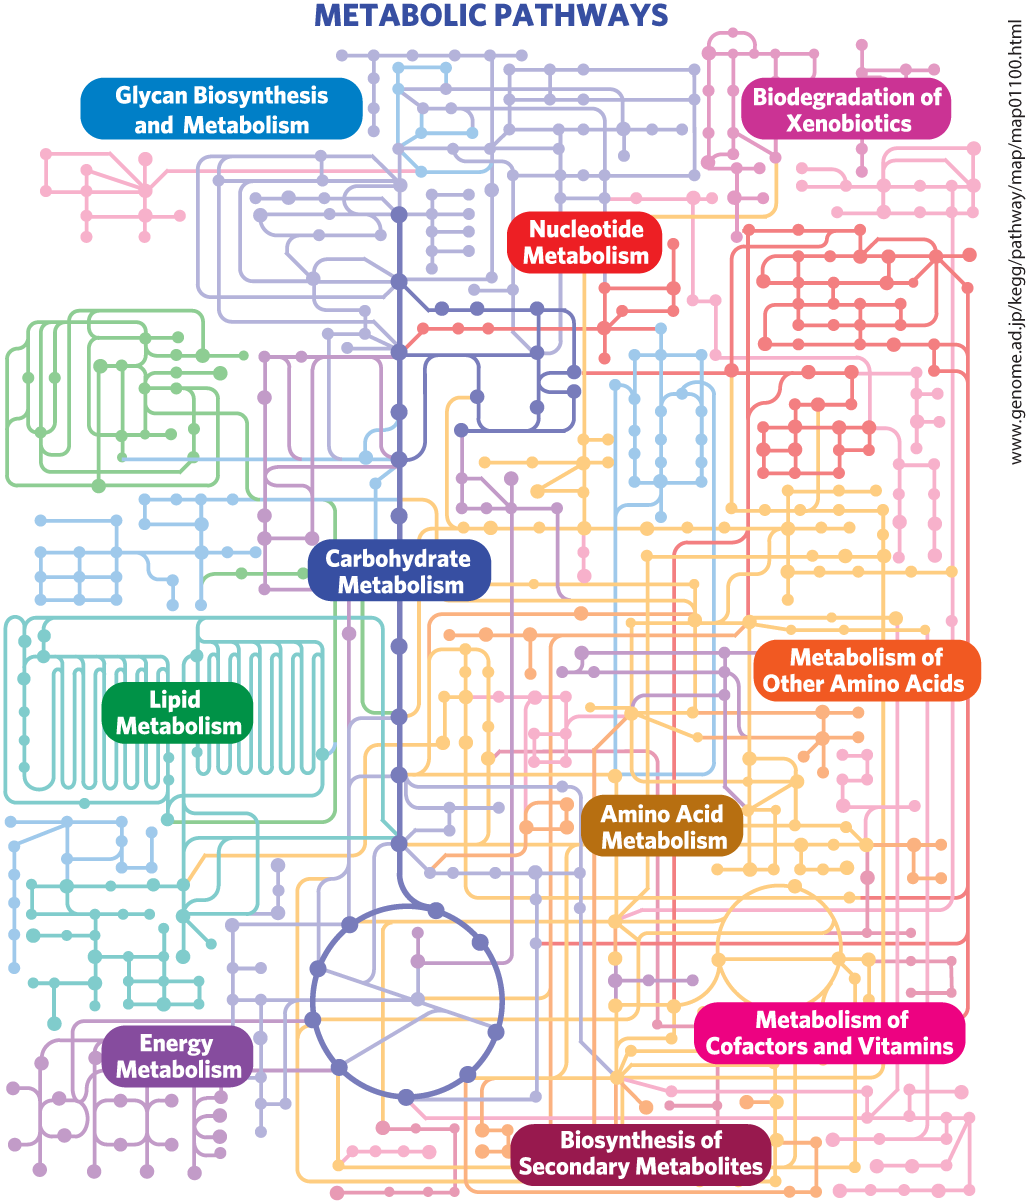
FIGURE 13-28 Metabolism as a three-dimensional meshwork. A typical eukaryotic cell has the capacity to make about 30,000 different proteins, which catalyze thousands of different reactions involving many hundreds of metabolites, most shared by more than one “pathway.” In this much-simplified overview of metabolic pathways, each dot represents an intermediate compound and each connecting line represents an enzymatic reaction. For a more realistic and far more complex diagram of metabolism, see the online KEGG PATHWAY database (www.genome.ad.jp/kegg/pathway/map/map01100.html); in this interactive map, you can click on each dot to obtain extensive data about the compound and the enzymes for which it is a substrate.
For example, in Chapter 14 we will discuss four possible fates for glucose 6-phosphate in a hepatocyte: breakdown by glycolysis for the production of ATP, breakdown in the pentose phosphate pathway for the production of NADPH and pentose phosphates, use in the synthesis of complex polysaccharides of the extracellular matrix, or hydrolysis to glucose and phosphate to replenish blood glucose. In fact, glucose 6-phosphate has other possible fates in hepatocytes, too; it may, for example, be used to synthesize other sugars, such as glucosamine, galactose, galactosamine, fucose, and neuraminic acid, for use in protein glycosylation, or it may be partially degraded to provide acetyl-CoA for fatty acid and sterol synthesis. And E. coli can use glucose to produce the carbon skeleton of every one of its several thousand types of molecules. When any cell uses glucose 6-phosphate for one purpose, that “decision” affects all the other pathways for which glucose 6-phosphate is a precursor or intermediate: any change in the allocation of glucose 6-phosphate to one pathway affects, directly or indirectly, the flow of metabolites through all the others.
Cells and Organisms Maintain a Dynamic Steady State
The pathways of glucose metabolism provide, in the catabolic direction, the energy essential to oppose the forces of entropy and, in the anabolic direction, biosynthetic precursors and a storage form of metabolic energy. These reactions are so important to survival that very complex regulatory mechanisms have evolved to ensure that metabolites move through each pathway in the correct direction and at the correct rate to match exactly the cell’s or the organism’s changing circumstances. By a variety of mechanisms operating on different time scales, adjustments are made in the rate of metabolite flow through an entire pathway when external circumstances change.
Circumstances do change, sometimes dramatically. The availability of oxygen may decrease due to hypoxia (diminished delivery of oxygen to tissues) or ischemia (diminished flow of blood to tissues). Wound healing requires huge amounts of energy and biosynthetic precursors. The relative proportions of carbohydrate, fat, and protein in the diet vary from meal to meal, and the supply of fuels obtained in the diet is intermittent, requiring metabolic adjustments between meals and during periods of starvation.
Fuels such as glucose enter a cell, and waste products such as leave, but the mass and the gross composition of a typical cell, organ, or adult animal do not change appreciably over time; cells and organisms exist in a dynamic steady state. For each metabolic reaction in a pathway, the substrate is provided by the preceding reaction at the same rate at which it is converted to product. Thus, although the rate (v) of metabolite flow, or flux, through this step of the pathway may be high and variable, the concentration of substrate, S, remains constant. So, for the two-step reaction
when , [S] is constant. For example, changes in for the entry of glucose from various sources into the blood are balanced by changes in for the uptake of glucose from the blood into various tissues, so the concentration of glucose in the blood ([S]) is held nearly constant at 5 mm. This is homeostasis for blood glucose. The failure of homeostatic mechanisms is often at the root of human disease. In diabetes mellitus, for example, the regulation of blood glucose concentration is defective as a result of the lack of or insensitivity to insulin, with profound medical consequences.
 For example, changes in for the entry of glucose from various sources into the blood are balanced by changes in for the uptake of glucose from the blood into various tissues, so the concentration of glucose in the blood ([S]) is held nearly constant at 5 m
In the course of evolution, organisms have acquired a remarkable collection of regulatory mechanisms for maintaining homeostasis at the molecular, cellular, and organismal levels, as reflected in the proportion of genes that encode regulatory machinery. In humans, about 2,500 genes (~12% of all genes) encode regulatory proteins, including a variety of receptors, regulators of gene expression, and more than 500 different protein kinases! In many cases, the regulatory mechanisms overlap: one enzyme is subject to regulation by several different mechanisms.
Both the Amount and the Catalytic Activity of an Enzyme Can Be Regulated
The flux through an enzyme-catalyzed reaction can be modulated by changes in the number of enzyme molecules or by changes in the catalytic activity of each enzyme molecule already present. Such changes occur on time scales from milliseconds to many hours, in response to signals from within or outside the cell. Very rapid allosteric changes in enzyme activity are generally triggered locally, by changes in the local concentration of a small molecule — a substrate of the pathway in which that reaction is a step (say, glucose for glycolysis), a product of the pathway (ATP from glycolysis), or a key metabolite or cofactor (such as NADH) that indicates the cell’s metabolic state. Second messengers (such as cyclic AMP and ) generated intracellularly in response to extracellular signals (hormones, cytokines, and so forth) also mediate allosteric regulation, on a slightly slower time scale set by the rate of the signal-transduction mechanism (see Chapter 12).
Extracellular signals (Fig. 13-29, ) may be hormonal (insulin or epinephrine, for example) or neuronal (acetylcholine), or may be growth factors or cytokines. The number of molecules of a given enzyme in a cell is a function of the relative rates of synthesis and degradation of that enzyme. The rate of synthesis can be adjusted by the activation (in response to some outside signal) of a transcription factor (Fig. 13-29, ; described in more detail in Chapter 28). Transcription factors are nuclear proteins that, when activated, bind specific DNA regions (response elements) near a gene’s promoter (its transcriptional starting point) and activate or repress the transcription of that gene, leading to increased or decreased synthesis of the encoded protein. Activation of a transcription factor is sometimes the result of its binding of a specific ligand and sometimes the result of its phosphorylation or dephosphorylation. Each gene is controlled by one or more response elements that are recognized by specific transcription factors. Genes that have several response elements are therefore controlled by several different transcription factors responding to several different signals. Groups of genes encoding proteins that act together, such as the enzymes of glycolysis, often share common response element sequences, so that a single signal, acting through a particular transcription factor, turns all of these genes on and off together.
 ) may be hormonal (insulin or epinephrine, for example) or neuronal (acetylcholine), or may be growth factors or cytokines. The number of molecules of a given enzyme in a cell is a function of the relative rates of synthesis and degradation of that enzyme. The rate of synthesis can be adjusted by the activation (in response to some outside signal) of a transcription factor (
 ; described in more detail in
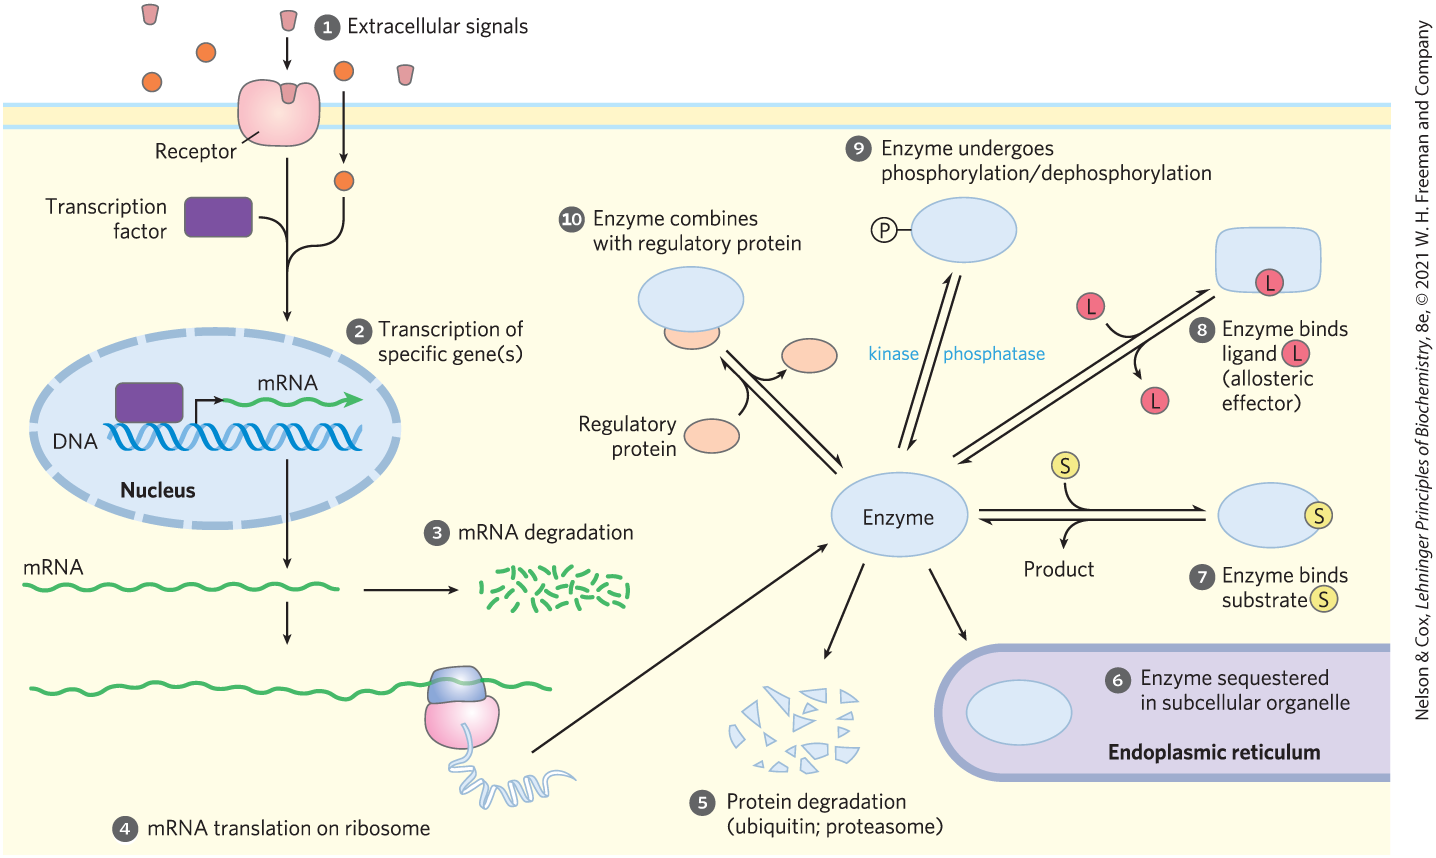
FIGURE 13-29 Factors affecting the activity of enzymes. The total activity of an enzyme can be changed by altering the number of its molecules in the cell, or its effective activity in a subcellular compartment ( through ), or by modulating the activity of existing molecules ( through ), as detailed in the text. An enzyme may be influenced by a combination of such factors.
 ), or by modulating the activity of existing molecules (
 through
  ),
),The stability of messenger RNAs — their resistance to degradation by cellular ribonucleases (Fig. 13-29, ) — varies, and the amount of a given mRNA in the cell is a function of its rates of synthesis and degradation (Chapter 26). The rate at which an mRNA is translated into a protein by ribosomes (Fig. 13-29, ) is also regulated, and depends on several factors described in detail in Chapter 27. Note that an n-fold increase in an mRNA does not always mean an n-fold increase in its protein product.
 ) — varies, and the amount of a given mRNA in the cell is a function of its rates of synthesis and degradation (
 ) is also regulated, and depends on several factors described in detail in
 Once synthesized, protein molecules have a finite lifetime, which may range from minutes to many days (Table 13-8). The rate of protein degradation (Fig. 13-29, ) differs from one protein to another and depends on the conditions in the cell. Some proteins are tagged by the covalent attachment of ubiquitin for degradation in proteasomes, as discussed in Chapter 27 (see, for example, the case of cyclin, in Fig. 12-38). Rapid turnover (synthesis followed by degradation) is energetically expensive, but proteins with a short half-life can reach new steady-state levels much faster than those with a long half-life, and the benefit of this quick responsiveness must balance or outweigh the cost to the cell.
 ) differs from one protein to another and depends on the conditions in the cell. Some proteins are tagged by the covalent attachment of ubiquitin for degradation in proteasomes, as discussed in
 | Tissue | Average half-life (days) |
|---|---|
| Liver | 0.9 |
| Kidney | 1.7 |
| Heart | 4.1 |
| Brain | 4.6 |
| Muscle | 10.7 |
Yet another way to alter the effective activity of an enzyme is to sequester the enzyme and its substrate in different compartments (Fig. 13-29, ). In muscle, for example, hexokinase cannot act on glucose until the sugar enters the myocyte from the blood, and the rate at which it enters depends on the activity of glucose transporters (see Table 11-1) in the plasma membrane. Within cells, membrane-bounded compartments segregate certain enzymes and enzyme systems, and the transport of substrate across these intracellular membranes may be the limiting factor in enzyme action.
By these several mechanisms for regulating enzyme level, cells can dramatically change their complement of enzymes in response to changes in metabolic circumstances. In vertebrates, liver is the most adaptable tissue; a change from a high-carbohydrate diet to a high-lipid diet, for example, affects the transcription of hundreds of genes and thus the levels of hundreds of proteins. These global changes in gene expression can be quantified in the entire complement of mRNAs (the transcriptome) or protein (proteome) of a cell type or organ, offering great insights into metabolic regulation. The effect of changes in the proteome is often a change in the total ensemble of low molecular weight metabolites, the metabolome (Fig. 13-30). The metabolome of E. coli growing on glucose is dominated by a few classes of metabolites: glutamate (49%); nucleotides (mainly ribonucleoside triphosphates) (15%); intermediates of glycolysis, the citric acid cycle, and the pentose phosphate pathway (central pathways of carbon metabolism) (15%); and redox cofactors and glutathione (9%).
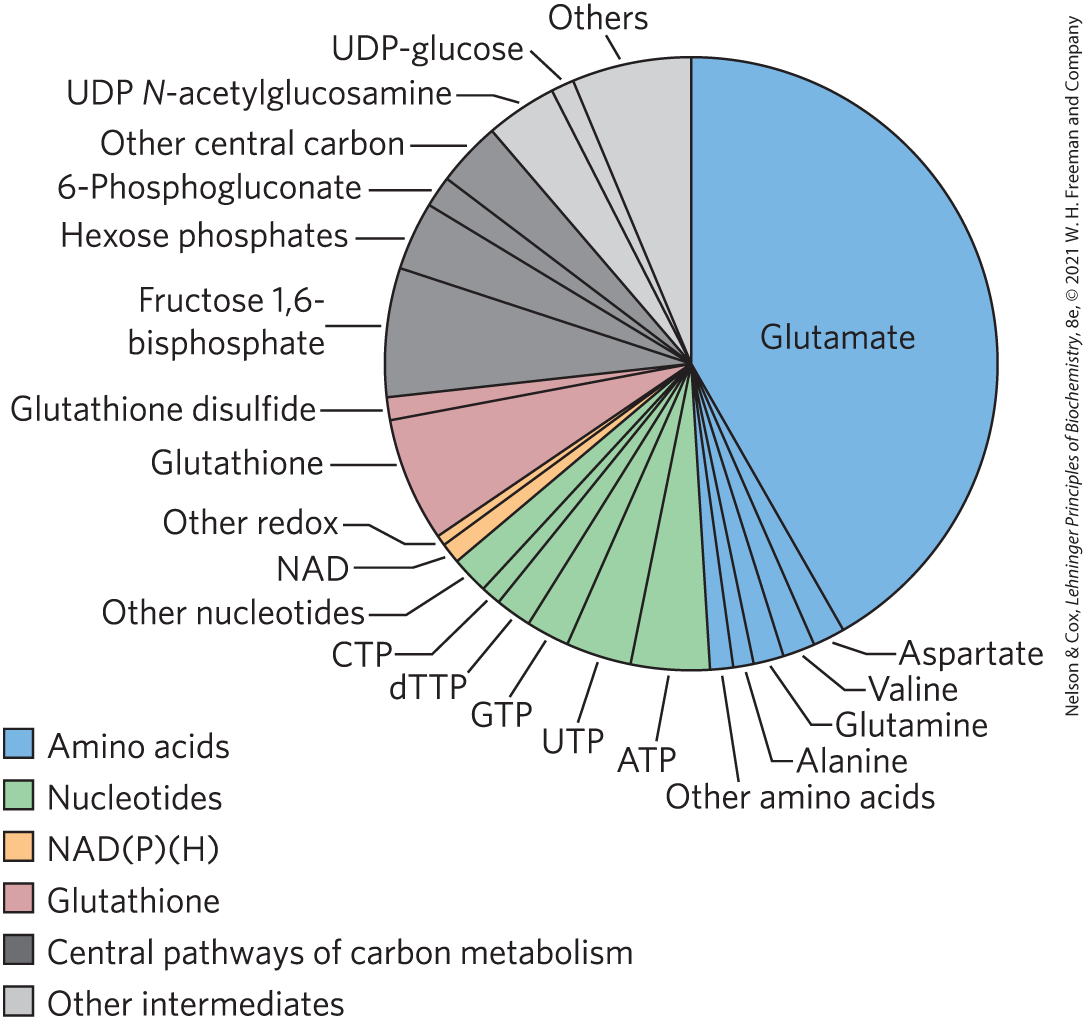
FIGURE 13-30 The metabolome of E. coli growing on glucose. Summary of the relative molar abundance of 103 metabolites as measured by a combination of liquid chromatography and tandem mass spectrometry (LC-MS/MS). For reference, the absolute concentration of glutamate in living cells is 9.6 mm. [Data from B. D. Bennett et al., Nature Chem. Biol. 5:593, 2009, Fig. 1.]
Once the regulatory mechanisms that involve protein synthesis and degradation have produced a certain number of molecules of each enzyme in a cell, the activity of those enzymes can be further regulated in several other ways: by the concentration of substrate, the presence of allosteric effectors, covalent modifications, or binding of regulatory proteins — all of which can change the activity of an individual enzyme molecule (Fig. 13-29, to ).
All enzymes are sensitive to the concentration of their substrate(s) (Fig. 13-29, ). Recall that in the simplest case (an enzyme that follows Michaelis-Menten kinetics), the initial rate of the reaction is half-maximal when the substrate is present at a concentration equal to (that is, when the enzyme is half-saturated with substrate). Activity drops off at lower [S], and when [S] , the reaction rate is linearly dependent on [S].
The relationship between [S] and is important because intracellular concentrations of substrate are often in the same range as, or lower than, . The activity of hexokinase, for example, changes with [glucose], and intracellular [glucose] varies with the concentration of glucose in the blood. As we will see, the different forms (isozymes) of hexokinase have different values and are therefore affected differently by changes in intracellular [glucose], in ways that make sense physiologically. For a number of phosphoryl transfers from ATP, and for redox reactions using NADPH or , the metabolite concentration is well above the (Fig. 13-31); these cofactors are not likely to be limiting in such reactions.
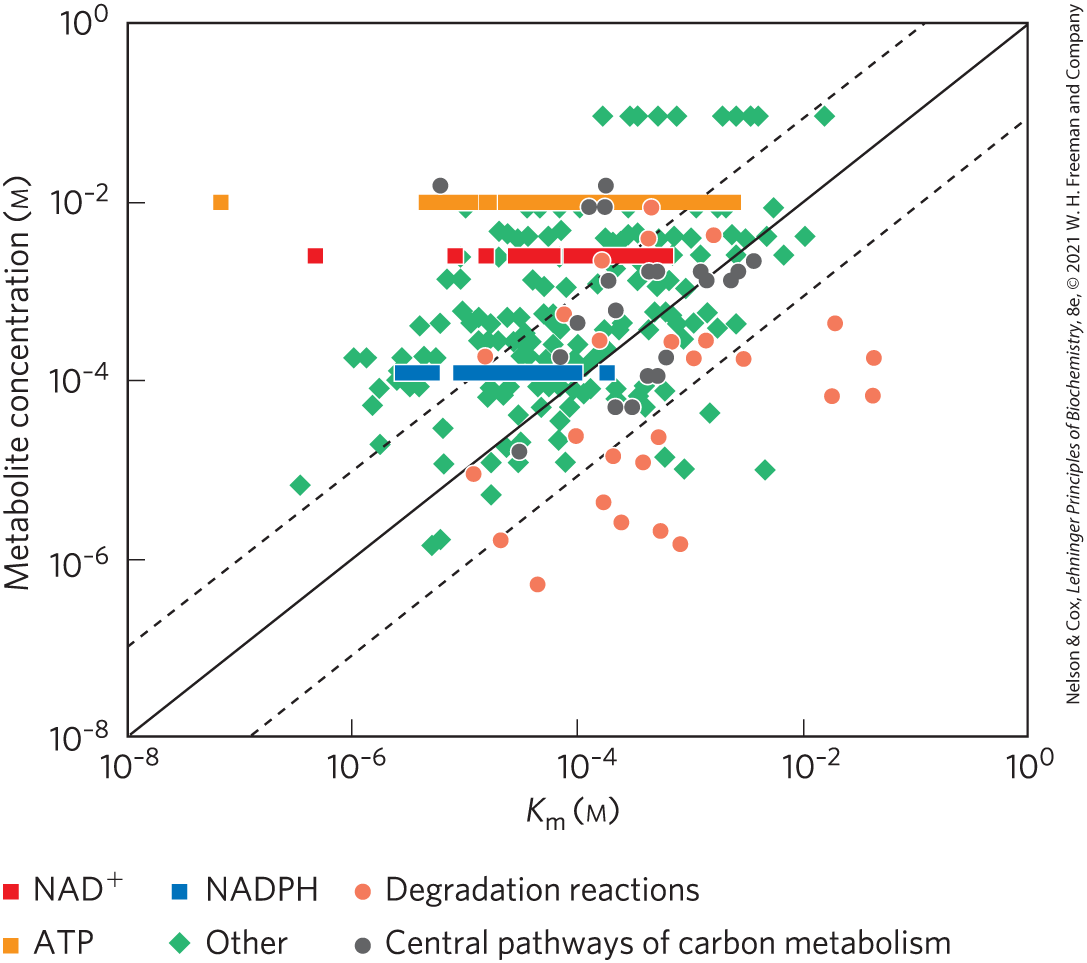
FIGURE 13-31 Comparison of and substrate concentration for some metabolic enzymes. Measured metabolite concentrations for E. coli growing on glucose are plotted against the known for enzymes that consume that metabolite. The solid line is the line of unity (where metabolite concentration ), and the dashed lines each denote a 10-fold deviation from the line of unity. [Data from B. D. Bennett et al., Nature Chem. Biol. 5:593, 2009, Fig. 2.]
Enzyme activity can be either increased or decreased by an allosteric effector (Fig. 13-29, ; see Fig. 6-37). Allosteric effectors typically convert hyperbolic kinetics to sigmoid kinetics, or vice versa (see Fig. 14-24b, for example). In the steepest part of the sigmoid curve, a small change in the concentration of substrate, or of allosteric effector, can have a large impact on reaction rate. Recall from Chapter 5 (p. 157) that the cooperativity of an allosteric protein can be expressed as a Hill coefficient, with higher coefficients meaning greater cooperativity. For an allosteric enzyme with a Hill coefficient of 4, activity increases from to with only a 3-fold increase in [S], compared with the 81-fold rise in [S] needed by an enzyme with no cooperative effects (Hill coefficient of 1; Table 13-9).
 ; see
; see | Hill coefficient | Required change in [S] to increase from 10% to 90% |
|---|---|
| 0.5 | |
| 1.0 | |
| 2.0 | |
| 3.0 | |
| 4.0 |
Covalent modifications of enzymes or other proteins (Fig. 13-29, ) occur within seconds or minutes of a regulatory signal, typically an extracellular signal. By far the most common modifications are phosphorylation and dephosphorylation (Fig. 13-32); up to half the proteins in a eukaryotic cell are phosphorylated under some circumstances. Phosphorylation by a specific protein kinase may alter the electrostatic features of an enzyme’s active site, cause movement of an inhibitory region of the enzyme out of the active site, alter the enzyme’s interaction with other proteins, or force conformational changes that translate into changes in or . For covalent modification to be useful in regulation, the cell must be able to restore the altered enzyme to its original activity state. A family of phosphoprotein phosphatases, at least some of which are themselves under regulation, catalyzes the dephosphorylation of proteins.
 ) occur within seconds or minutes of a regulatory signal, typically an extracellular signal. By far the most common modifications are phosphorylation and dephosphorylation (
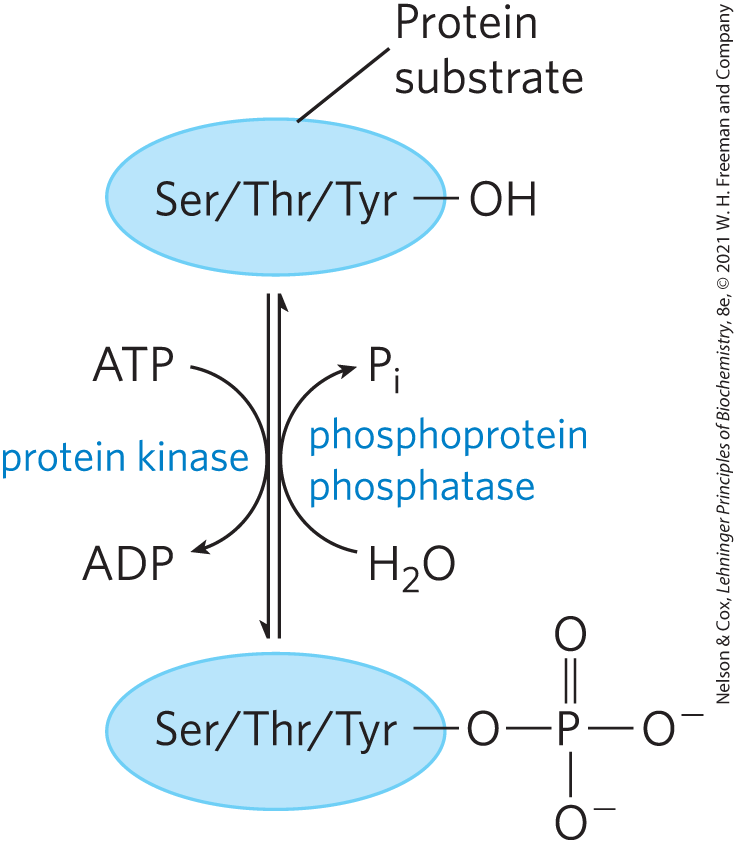
FIGURE 13-32 Protein phosphorylation and dephosphorylation. Protein kinases transfer a phosphoryl group from ATP to a Ser, Thr, or Tyr residue in an enzyme or other protein substrate. Protein phosphatases remove the phosphoryl group as .
Finally, many enzymes are regulated by association with and dissociation from another, regulatory protein (Fig. 13-29, ). For example, the cyclic AMP–dependent protein kinase (PKA; see Fig. 12-6) is inactive until cAMP binding separates catalytic from regulatory (inhibitory) subunits of the enzyme.
These several mechanisms for altering the flux through a step in a metabolic pathway are not mutually exclusive. It is very common for a single enzyme to be regulated at the level of transcription and by both allosteric and covalent mechanisms. The combination provides fast, smooth, effective regulation in response to a very wide array of perturbations and signals.
In the discussions that follow, it is useful to think of changes in enzymatic activity as serving two distinct though complementary roles. We use the term metabolic regulation to refer to processes that serve to maintain homeostasis at the molecular level — to hold some cellular parameter (concentration of a metabolite, for example) at a steady level over time, even as the flow of metabolites through the pathway changes. The term metabolic control refers to a process that leads to a change in the output of a metabolic pathway over time, in response to some outside signal or change in circumstances. The distinction, although useful, is not always easy to make.
Reactions Far from Equilibrium in Cells Are Common Points of Regulation
For some steps in a metabolic pathway the reaction is close to equilibrium, with the cell in its dynamic steady state (Fig. 13-33). The net flow of metabolites through these steps is the small difference between the rates of the forward and reverse reactions, rates that are very similar when a reaction is near equilibrium. Small changes in substrate or product concentration can produce large changes in the net rate, and they can even change the direction of the net flow. We can identify these near-equilibrium reactions in a cell by comparing the mass-action ratio, Q, with the equilibrium constant for the reaction, . Recall that for the reaction , . In practice, when Q and are within 1 to 2 orders of magnitude of each other, the reaction is near equilibrium. This is the case for more than half of the enzymes in the glycolytic pathway, for example (Table 13-10).
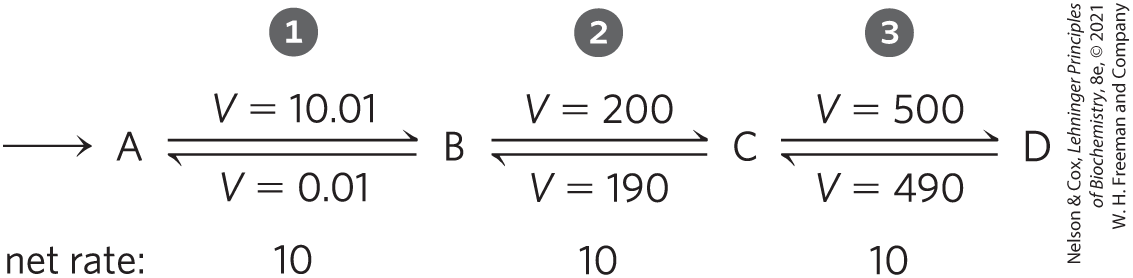
FIGURE 13-33 Near-equilibrium and nonequilibrium steps in a metabolic pathway. Steps and of this pathway are near equilibrium in the cell; for each step, the rate (V) of the forward reaction is only slightly greater than the reverse rate, so the net forward rate (10) is relatively low and the free-energy change, ∆G, is close to zero. An increase in [C] or [D] can reverse the direction of these steps. Step is maintained in the cell far from equilibrium; its forward rate greatly exceeds its reverse rate. The net rate of step (10) is much larger than the reverse rate (0.01) and is identical to the net rates of steps and when the pathway is operating in the steady state. Step has a large, negative ∆G.
| Enzyme | Mass-action ratio, Q | Reaction near equilibrium in vivo?a | (kJ/mol) | ΔG (kJ/mol) in heart | ||
|---|---|---|---|---|---|---|
| Liver | Heart | |||||
| Hexokinase | No | |||||
| PFK-1 | No | |||||
| Aldolase | Yes | |||||
| Triose phosphate isomerase | — b | Yes | ||||
| Glyceraldehyde 3-phosphate dehydrogenase + phosphoglycerate kinase | 9.0 | Yes | ||||
| Phosphoglycerate mutase | Yes | |||||
| Enolase | 3 | 2.9 | 1.4 | Yes | ||
| Pyruvate kinase | 40 | No | ||||
| Phosphohexose isomerase | Yes | |||||
| Pyruvate carboxylase + PEP carboxykinase | 7 | — b | No | |||
| Glucose 6-phosphatase | — b | Yes | ||||
|
Data for and Q from E. A. Newsholme and C. Start, Regulation in Metabolism, pp. 97, 263, Wiley Press, 1973. ∆G and were calculated from these data. aFor simplicity, any reaction for which the absolute value of the calculated ∆G is less than 6 is considered near equilibrium. bData not available. |
||||||
Other reactions are far from equilibrium in the cell. For example, for the phosphofructokinase-1 (PFK-1) reaction is about 1,000, but Q ([fructose 1,6-bisphosphate][ADP]/[fructose 6-phosphate][ATP]) in a hepatocyte in the steady state is about 0.1 (Table 13-10). It is because the reaction is so far from equilibrium in the cell that the process is exergonic under cellular conditions and tends to go in the forward direction. The reaction is held far from equilibrium because, under prevailing cellular conditions of substrate, product, and effector concentrations, the rate of conversion of fructose 6-phosphate to fructose 1,6-bisphosphate is limited by the activity of PFK-1. PFK-1 activity itself is limited by the number of PFK-1 molecules present and by the actions of allosteric effectors. Thus, the net forward rate of the enzyme-catalyzed reaction is equal to the net flow of glycolytic intermediates through other steps in the pathway, and the reverse flow through PFK-1 remains near zero.
The cell cannot allow reactions with large equilibrium constants to reach equilibrium. If [fructose 6-phosphate], [ATP], and [ADP] in the cell were held at typical levels (low millimolar concentrations) and the PFK-1 reaction were allowed to reach equilibrium by an increase in [fructose 1,6-bisphosphate], the concentration of fructose 1,6-bisphosphate would rise into the molar range, wreaking osmotic havoc on the cell. Consider another case: if the reaction were allowed to approach equilibrium in the cell, the actual free-energy change (ΔG) for that reaction (; see Worked Example 13-2, p. 480) would approach zero, and ATP would lose the high phosphoryl group transfer potential that makes it valuable to the cell. It is therefore essential that enzymes catalyzing ATP breakdown and other highly exergonic reactions in a cell be sensitive to regulation, so that when metabolic changes are forced by external circumstances, the flow through these enzymes will be adjusted to ensure that [ATP] remains far above its equilibrium level. When such metabolic changes occur, the activities of enzymes in all interconnected pathways adjust to keep these critical steps away from equilibrium. Thus, not surprisingly, many enzymes that catalyze highly exergonic reactions are subject to a variety of subtle regulatory mechanisms. The multiplicity of these adjustments is so great that we cannot predict by examining the properties of any one enzyme in a pathway whether that enzyme has a strong influence on net flow through the entire pathway.
Adenine Nucleotides Play Special Roles in Metabolic Regulation
After the protection of its DNA from damage, perhaps nothing is more important to a cell than maintaining a constant supply and concentration of ATP. Many ATP-using enzymes have values between 0.1 and 1 mm, and the ATP concentration in a typical cell is about 5 to 10 mm (Fig. 13-31). If [ATP] were to drop significantly, these enzymes would be less than fully saturated by their substrate (ATP), and the rates of hundreds of reactions that involve ATP would decrease (Fig. 13-34); the cell would probably not survive this kinetic effect on so many reactions.
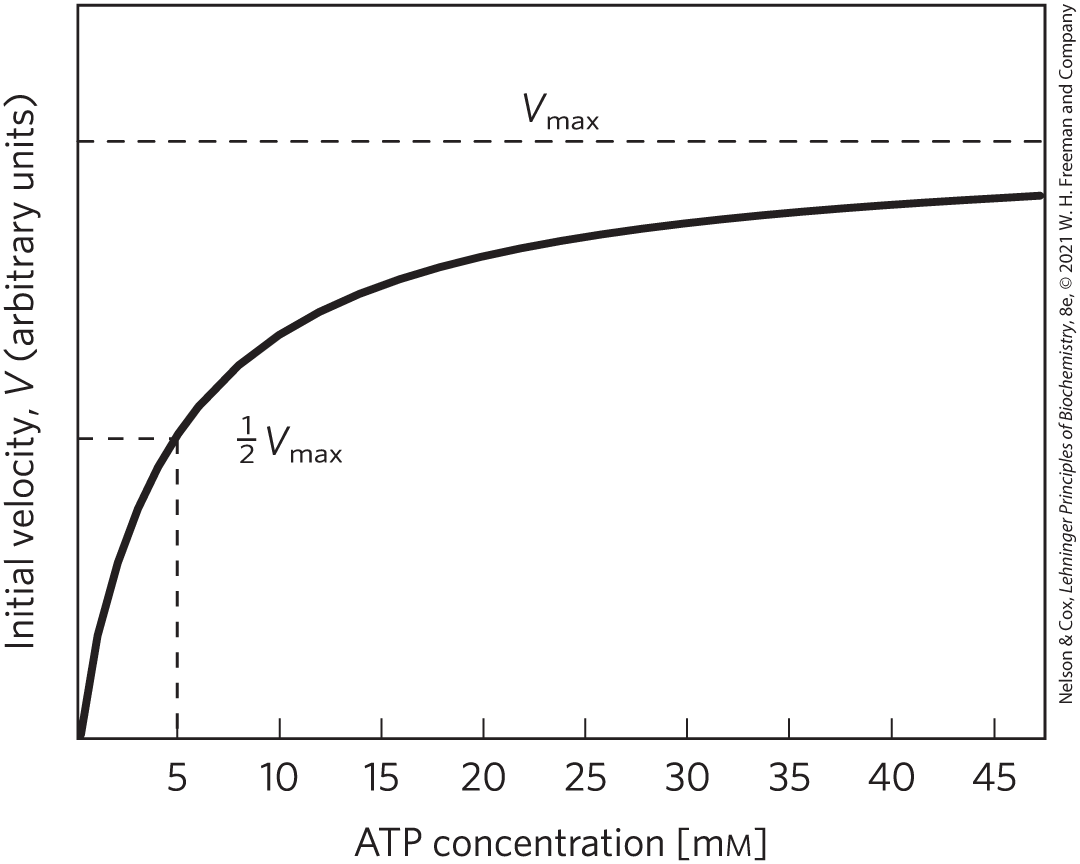
FIGURE 13-34 Effect of ATP concentration on the initial reaction velocity of a typical ATP-dependent enzyme. These experimental data yield a for ATP of 5 mm. The concentration of ATP in animal tissues is ~5 mm.
There is also an important thermodynamic effect of lowered [ATP]. Because ATP is converted to ADP or AMP when “spent” to accomplish cellular work, the [ATP]/[ADP] ratio profoundly affects all reactions that employ these cofactors. The same is true for other important cofactors, such as and For example, consider the reaction catalyzed by hexokinase:
Note that this expression holds true only when reactants and products are at their equilibrium concentrations, where . At any other set of concentrations, is not zero. Recall (from Section 13.1) that the ratio of products to substrates (the mass-action ratio, Q) determines the magnitude and sign of and therefore the driving force, , of the reaction:
Because an alteration of this driving force profoundly influences every reaction that involves ATP, organisms have evolved under strong pressure to develop regulatory mechanisms responsive to the [ATP]/[ADP] ratio.
AMP concentration is an even more sensitive indicator of a cell’s energetic state than is [ATP]. Normally, cells have a far higher concentration of ATP (5 to 10 mm) than of AMP (<0.1 mm). When some process (say, muscle contraction) consumes ATP, AMP is produced in two steps. First, hydrolysis of ATP produces ADP, then the reaction catalyzed by adenylate kinase produces AMP:
If ATP is consumed such that its concentration drops 10%, the relative increase in [AMP] is much greater than that of [ADP] (Table 13-11). It is not surprising, therefore, that many regulatory processes are keyed to changes in [AMP]. Probably the most important mediator of regulation by AMP is AMP-activated protein kinase (AMPK), which responds to an increase in [AMP] by phosphorylating key proteins and thus regulating their activities. (AMPK is not to be confused with the cyclic AMP–dependent protein kinase PKA; see Section 12.2.) The rise in [AMP] may be caused by a reduced nutrient supply or by increased physical exercise. AMP activates AMPK allosterically, which increases glucose transport and activates glycolysis and fatty acid oxidation, while suppressing energy-requiring processes such as the synthesis of glycogen, fatty acids, cholesterol, and protein. All of the changes effected by AMPK serve to raise [ATP] and lower [AMP]. In Chapter 23, we discuss the role of AMPK in balancing anabolism and catabolism in the whole organism.
| Adenine nucleotide | Concentration before ATP depletion (mm) | Concentration after ATP depletion (mm) | Relative change |
|---|---|---|---|
| ATP | 5.0 | 4.5 | 10% |
| ADP | 1.0 | 1.0 | 0 |
| AMP | 0.1 | 0.6 | 600% |
SUMMARY 13.5 Regulation of Metabolic Pathways
- In a metabolically active cell in a steady state, intermediates are formed and consumed at equal rates. When a transient perturbation alters the rate of formation or consumption of a metabolite, compensating changes in enzyme activities return the system to the steady state.
- Cells regulate their metabolism by a variety of mechanisms over a time scale ranging from less than a millisecond to days, either by changing the activity of existing enzyme molecules or by changing the number of molecules of a specific enzyme.
- Various signals activate or inactivate transcription factors, which act in the nucleus to regulate gene expression. Changes in the transcriptome lead to changes in the proteome, and ultimately in the metabolome of a cell or tissue.
- In multistep processes such as glycolysis, certain reactions are essentially at equilibrium in the steady state; the rates of these reactions rise and fall with substrate concentration. Other reactions are far from equilibrium; these steps are typically the points of regulation of the overall pathway.
- Regulatory mechanisms maintain nearly constant levels of key metabolites such as ATP and NADH in cells and glucose in the blood, while matching the use or production of glucose to the organism’s changing needs.
- The levels of ATP and AMP are a sensitive reflection of a cell’s energy status, and when the [ATP]/[AMP] ratio decreases, the AMP-activated protein kinase (AMPK) triggers a variety of cellular responses to raise [ATP] and lower [AMP].
 In a metabolically active cell in a steady state, intermediates are formed and consumed at equal rates. When a transient perturbation alters the rate of formation or consumption of a metabolite, compensating changes in enzyme activities return the system to the steady state.