8.3 Nucleic Acid Chemistry
The role of DNA as a repository of genetic information depends in part on its inherent stability. The chemical transformations that do occur are generally very slow in the absence of an enzyme catalyst. The long-term storage of information without alteration is so important to a cell, however, that even very slow reactions that alter DNA structure can be physiologically significant. Processes such as carcinogenesis and aging may be intimately linked to slowly accumulating, irreversible alterations of DNA. Other, nondestructive alterations also occur and are essential to function, such as the strand separation that must precede DNA replication or transcription. In addition to providing insights into physiological processes, our understanding of nucleic acid chemistry has given us a powerful array of technologies that have applications in molecular biology, medicine, agriculture, and forensic science. We now examine the chemical properties of DNA and a few of these technologies.

 The role of DNA as a repository of genetic information depends in part on its inherent stability. The chemical transformations that do occur are generally very slow in the absence of an enzyme catalyst. The long-term storage of information without alteration is so important to a cell, however, that even very slow reactions that alter DNA structure can be physiologically significant. Processes such as carcinogenesis and aging may be intimately linked to slowly accumulating, irreversible alterations of DNA. Other, nondestructive alterations also occur and are essential to function, such as the strand separation that must precede DNA replication or transcription. In addition to providing insights into physiological processes, our understanding of nucleic acid chemistry has given us a powerful array of technologies that have applications in molecular biology, medicine, agriculture, and forensic science. We now examine the chemical properties of DNA and a few of these technologies.
Double-Helical DNA and RNA Can Be Denatured
Solutions of carefully isolated, native DNA are highly viscous at pH 7.0 and room temperature . When such a solution is subjected to extremes of pH or to temperatures above , its viscosity decreases sharply, indicating that the DNA has undergone a physical change. Just as heat and extremes of pH denature globular proteins, they also cause denaturation, or melting, of double-helical DNA. Disruption of the hydrogen bonds between paired bases and of base-stacking interactions causes unwinding of the double helix to form two single strands, completely separate from each other along the entire length or part of the length (partial denaturation) of the molecule. No covalent bonds in the DNA are broken (Fig. 8-26).
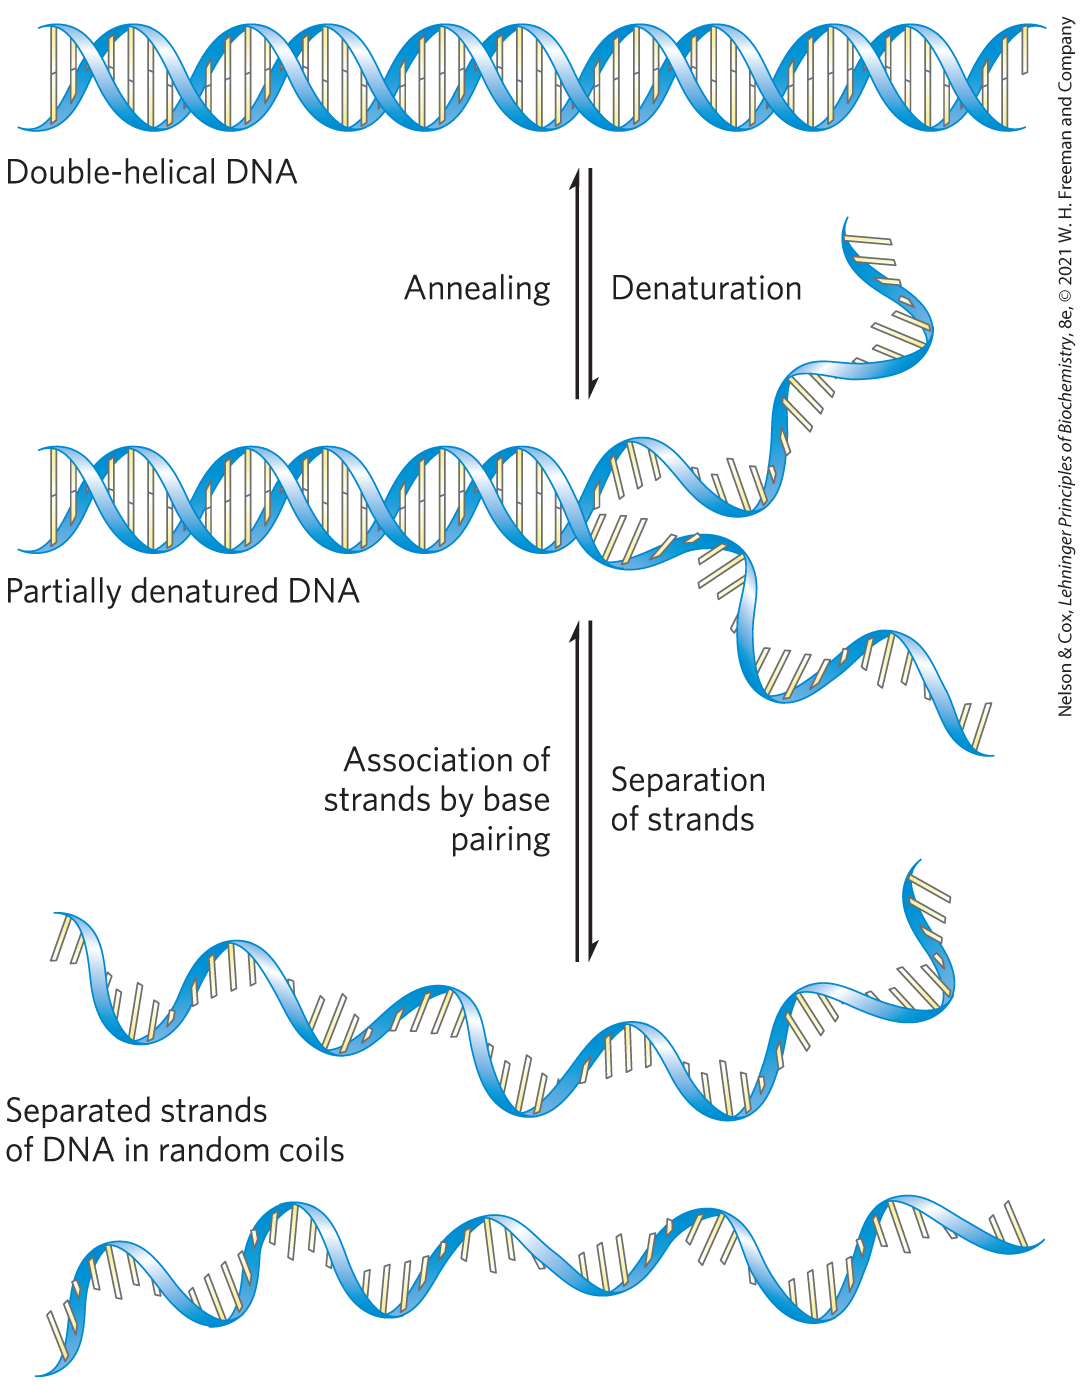
FIGURE 8-26 Reversible denaturation and annealing (renaturation) of DNA.
When the temperature or pH is returned to the range in which most organisms live, the unwound segments of the two strands spontaneously rewind, or anneal, to yield the intact duplex (Fig. 8-26). However, if the two strands are completely separated, renaturation occurs in two steps. In the first, relatively slow step, the two strands “find” each other by random collisions and form a short segment of complementary double helix. The second step is much faster: the remaining unpaired bases successively come into register as base pairs, and the two strands “zipper” themselves together to form the double helix.
The close interaction between stacked bases in a nucleic acid has the effect of decreasing its absorption of UV light relative to that of a solution with the same concentration of free nucleotides, and the absorption is decreased further when two complementary nucleic acid strands are paired. This is called the hypochromic effect. Denaturation of a double-stranded nucleic acid produces the opposite result: an increase in absorption called the hyperchromic effect. The transition from double-stranded DNA to the denatured, single-stranded form can thus be detected by monitoring UV absorption at 260 nm.
Viral or bacterial DNA molecules in solution denature when they are heated slowly (Fig. 8-27). Each species of DNA has a characteristic denaturation temperature, or melting point (; formally, the temperature at which half the DNA is present as separated single strands): the higher its content of base pairs, the higher the melting point of the DNA. This is primarily because, as we saw earlier, base pairs make greater contributions to base stacking than do base pairs. Thus, the melting point of a DNA molecule, determined under fixed conditions of pH and ionic strength, can yield an estimate of its base composition. If denaturation conditions are carefully controlled, regions that are rich in base pairs will denature while most of the DNA remains double-stranded. Such denatured regions (called bubbles) can be visualized with electron microscopy (Fig. 8-28). In the strand separation of DNA that occurs in vivo during processes such as DNA replication and transcription, the site where strand separation is initiated is often rich in base pairs, as we shall see.
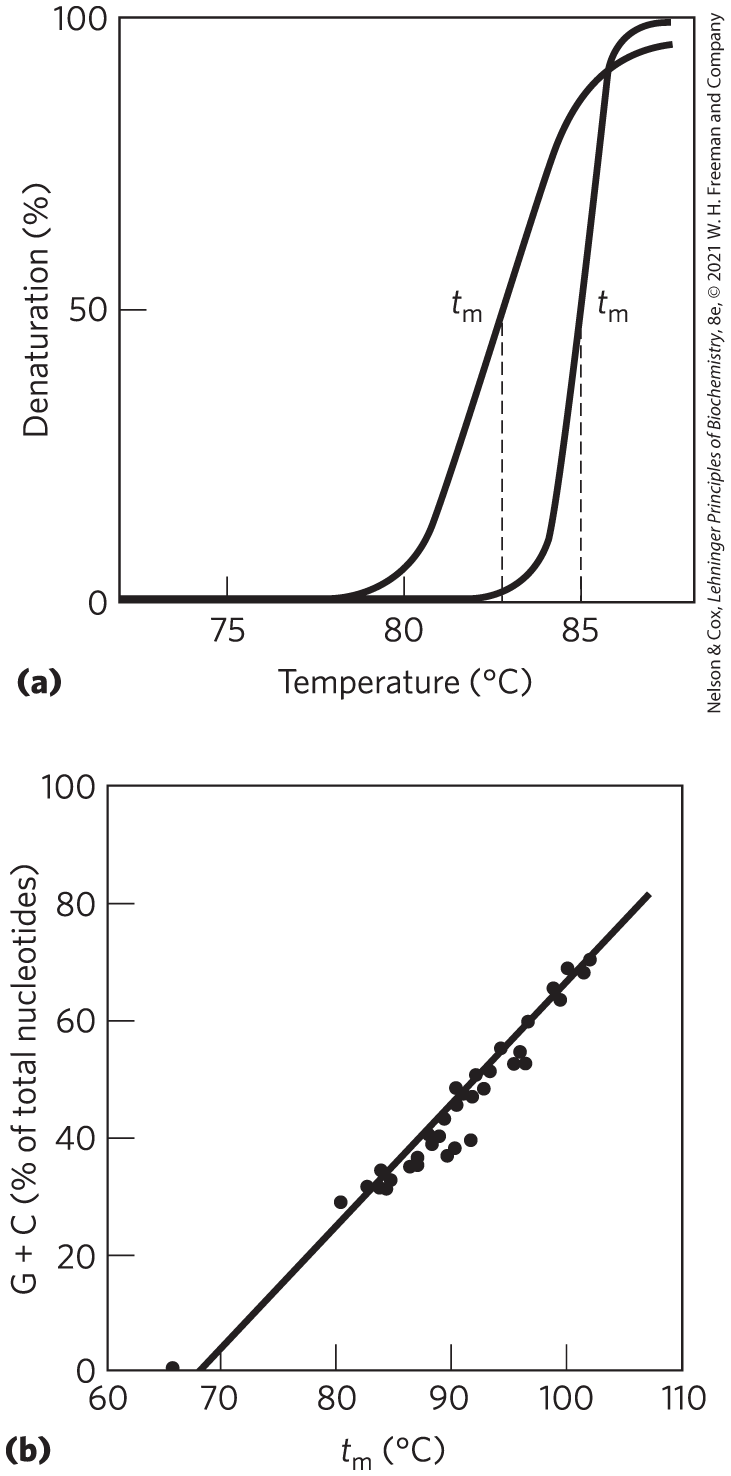
FIGURE 8-27 Heat denaturation of DNA. (a) The denaturation, or melting, curves of two DNA specimens. The temperature at the midpoint of the transition () is the melting point; it depends on pH and ionic strength and on the size and base composition of the DNA. (b) Relationship between and the G+C content of a DNA. [(b) Data from J. Marmur and P. Doty, J. Mol. Biol. 5:109, 1962.]
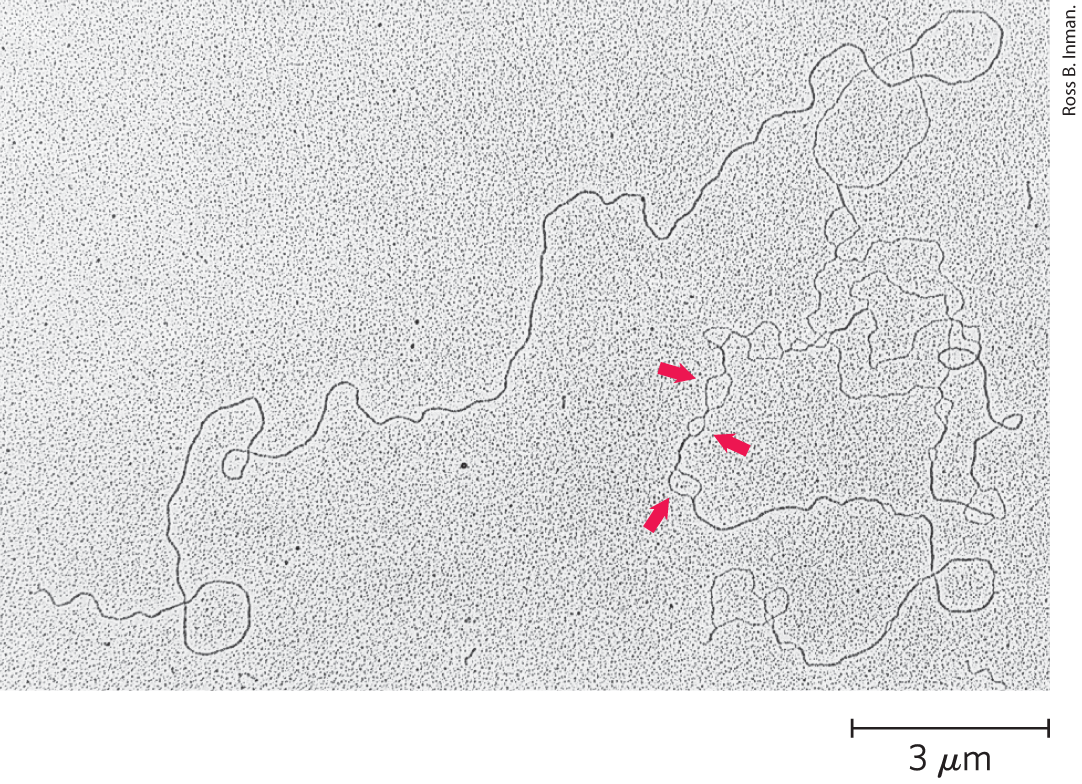
FIGURE 8-28 Partially denatured DNA. This DNA was partially denatured, then fixed to prevent renaturation during sample preparation. Although the shadowing method used to visualize the DNA in this electron micrograph obliterates many details, single-stranded and double-stranded regions are readily distinguishable. The arrows point to some single-stranded bubbles where denaturation has occurred. The regions that denature are highly reproducible and are rich in base pairs.
Duplexes of two RNA strands or of one RNA strand and one DNA strand (RNA-DNA hybrids) can also be denatured. Notably, RNA duplexes are more stable to heat denaturation than DNA duplexes. At neutral pH, denaturation of a double-helical RNA often requires temperatures at least higher than those required for denaturation of a DNA molecule with a comparable sequence, assuming that the strands in each molecule are perfectly complementary. The stability of an RNA-DNA hybrid is generally intermediate between that of RNA and DNA duplexes. The physical basis for these differences in thermal stability is not known.
WORKED EXAMPLE 8-1 DNA Base Pairs and DNA Stability
In samples of DNA isolated from two unidentified species of bacteria, X and Y, adenine makes up 32% and 17%, respectively, of the total bases. What relative proportions of adenine, guanine, thymine, and cytosine would you expect to find in the two DNA samples? What assumptions have you made? One of these species was isolated from a hot spring . Which species is most likely the thermophilic bacterium, and why?
SOLUTION:
For any double-helical DNA, A = T and G = C. The DNA from species X has 32% A and therefore must contain 32% T. This accounts for 64% of the bases and leaves 36% as pairs: 18% G and 18% C. The sample from species Y, with 17% A, must contain 17% T, accounting for 34% of the base pairs. The remaining 66% of the bases are thus equally distributed as 33% G and 33% C. This calculation is based on the assumption that both DNA molecules are double-stranded.
The higher the G+C content of a DNA molecule, the higher the melting temperature. Species Y, having the DNA with the higher G+C content (66%), most likely is the thermophilic bacterium; its DNA has a higher melting temperature and thus is more stable at the temperature of the hot spring.
Nucleotides and Nucleic Acids Undergo Nonenzymatic Transformations
Purines and pyrimidines, along with the nucleotides of which they are a part, undergo spontaneous alterations in their covalent structure. The rate of these reactions is generally very slow, but they are physiologically significant because of the cell’s very low tolerance for alterations in its genetic information. Alterations in DNA structure that produce permanent changes in the genetic information encoded therein are called mutations. In higher organisms, much evidence suggests an intimate link between the accumulation of mutations in an individual and the processes of aging and carcinogenesis.

Several nucleotide bases undergo spontaneous loss of their exocyclic amino groups (deamination) (Fig. 8-29a). For example, under typical cellular conditions, deamination of cytosine (in DNA) to uracil occurs in about one of every cytidine residues in 24 hours. This rate of deamination corresponds to about 100 spontaneous events per day, on average, in a mammalian cell. Deamination of adenine and guanine occurs at about 1/100th this rate.

FIGURE 8-29 Some well-characterized nonenzymatic reactions of nucleotides. (a) Deamination reactions. Only the base is shown. (b) Depurination, in which a purine is lost by hydrolysis of the N-β-glycosyl bond. Loss of pyrimidines through a similar reaction occurs, but much more slowly. The resulting lesion, in which the deoxyribose is present but the base is not, is called an abasic site or an AP site (apurinic site or, rarely, apyrimidinic site). The deoxyribose remaining after depurination is readily converted from the β-furanose to the aldehyde form (see Fig. 8-3), further destabilizing the DNA at this position. More nonenzymatic reactions are illustrated in Figures 8-30 and 8-31.
The slow cytosine deamination reaction seems innocuous enough, but it is almost certainly the reason why DNA contains thymine rather than uracil. The product of cytosine deamination (uracil) is readily recognized as foreign in DNA and is removed by a repair system (Chapter 25). If DNA normally contained uracil, recognition of uracils resulting from cytosine deamination would be more difficult, and unrepaired uracils would lead to permanent sequence changes as they were paired with adenines during replication. Cytosine deamination would gradually lead to a decrease in base pairs and an increase in base pairs in the DNA of all cells. Over the millennia, cytosine deamination could eliminate base pairs and the genetic code that depends on them. Establishing thymine as one of the four bases in DNA may well have been one of the crucial turning points in evolution, making the long-term storage of genetic information possible.
Another important reaction in deoxyribonucleotides is the hydrolysis of the N-β-glycosyl bond between the base and the pentose. The base is lost, creating a DNA lesion called an AP (apurinic, apyrimidinic) site or abasic site (Fig. 8-29b). Purines are lost at a higher rate than pyrimidines. As many as one in purines (10,000 per mammalian cell) are lost from DNA every 24 hours under typical cellular conditions. Depurination of ribonucleotides and RNA is much slower and less physiologically significant. In the test tube, loss of purines can be accelerated by dilute acid. Incubation of DNA at pH 3 causes selective removal of the purine bases, resulting in a derivative called apurinic acid.
Other reactions are promoted by radiation. UV light induces the condensation of two ethylene groups to form a cyclobutane ring. In the cell, the same reaction between adjacent pyrimidine bases in nucleic acids forms cyclobutane pyrimidine dimers. This happens most frequently between adjacent thymidine residues on the same DNA strand (Fig. 8-30). A second type of pyrimidine dimer, called a 6-4 photoproduct, is also formed during UV irradiation. Ionizing radiation (x-rays and gamma rays) can cause ring opening and fragmentation of bases as well as breaks in the covalent backbone of nucleic acids.
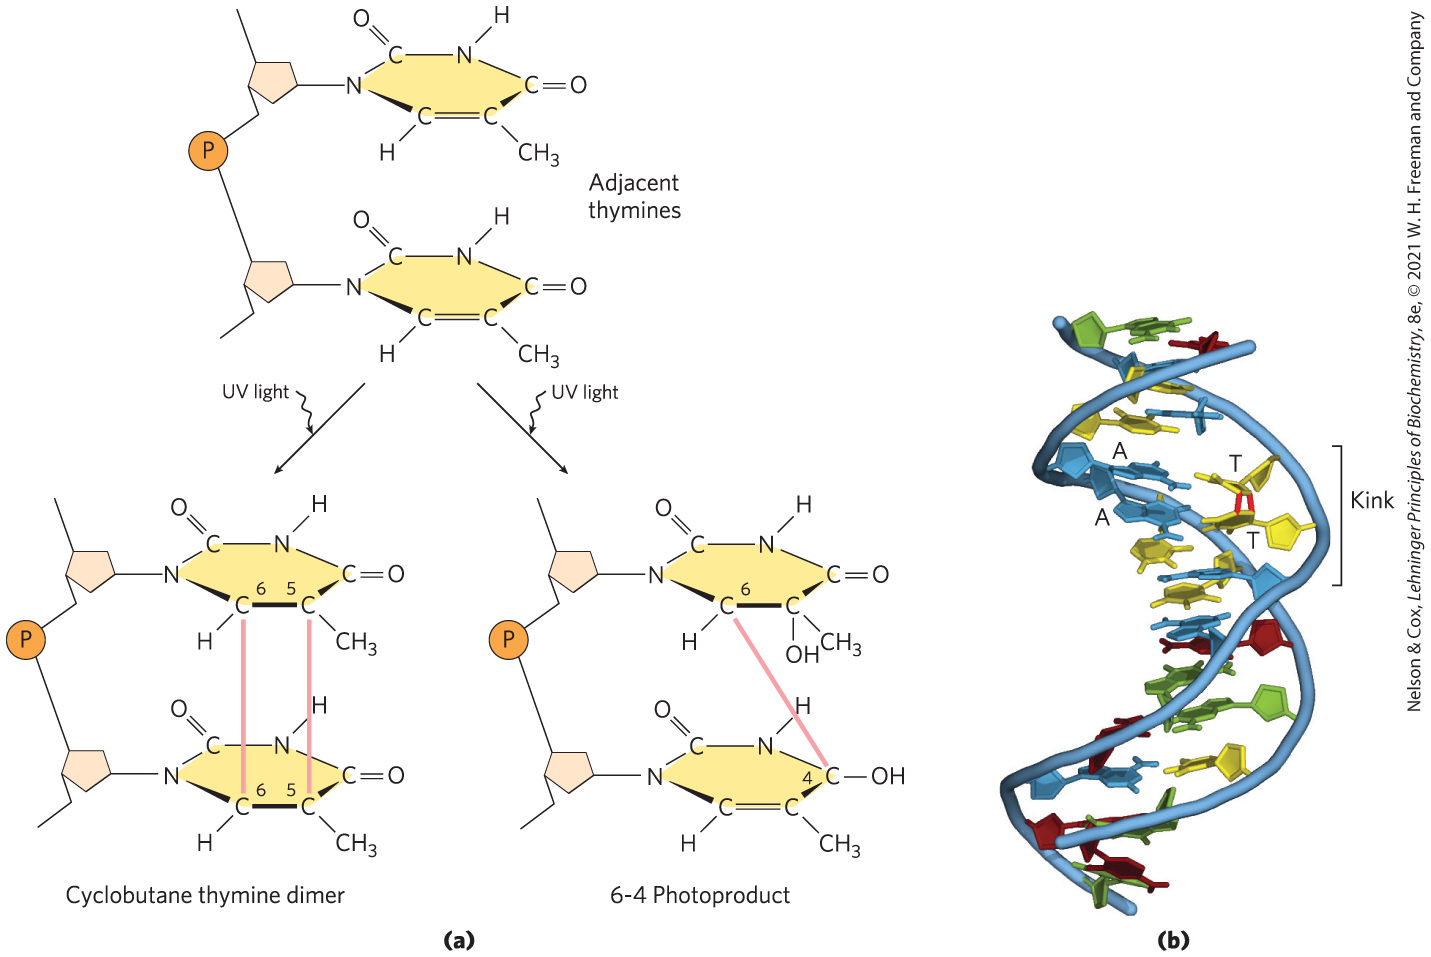
FIGURE 8-30 Formation of pyrimidine dimers induced by UV light. (a) One type of reaction (on the left) results in the formation of a cyclobutyl ring involving C-5 and C-6 of adjacent pyrimidine residues. An alternative reaction (on the right) results in a 6-4 photoproduct, with a linkage between C-6 of one pyrimidine and C-4 of its neighbor. (b) Formation of a cyclobutane pyrimidine dimer introduces a bend or kink into the DNA. [(b) Data from PDB ID 1TTD, K. McAteer et al., J. Mol. Biol. 282:1013, 1998.]
Virtually all forms of life are exposed to energy-rich radiation capable of causing chemical changes in DNA. Near-UV radiation (with wavelengths of 200 to 400 nm), which makes up a significant portion of the solar spectrum, is known to cause pyrimidine dimer formation and other chemical changes in the DNA of bacteria and of human skin cells. We are subjected to a constant field of ionizing radiation in the form of cosmic rays, which can penetrate deep into the earth, as well as radiation emitted from radioactive elements, such as radium, plutonium, uranium, radon, , and . X-rays used in medical and dental examinations and in radiation therapy of cancer and other diseases are another form of ionizing radiation. It is estimated that UV and ionizing radiations are responsible for about 10% of all DNA damage caused by environmental agents.
DNA also may be damaged by reactive chemicals introduced into the environment as products of industrial activity. Such products may not be injurious per se but may be metabolized by cells into forms that are. There are two prominent classes of such agents (Fig. 8-31): (1) deaminating agents, particularly nitrous acid () or compounds that can be metabolized to nitrous acid or nitrites, and (2) alkylating agents.
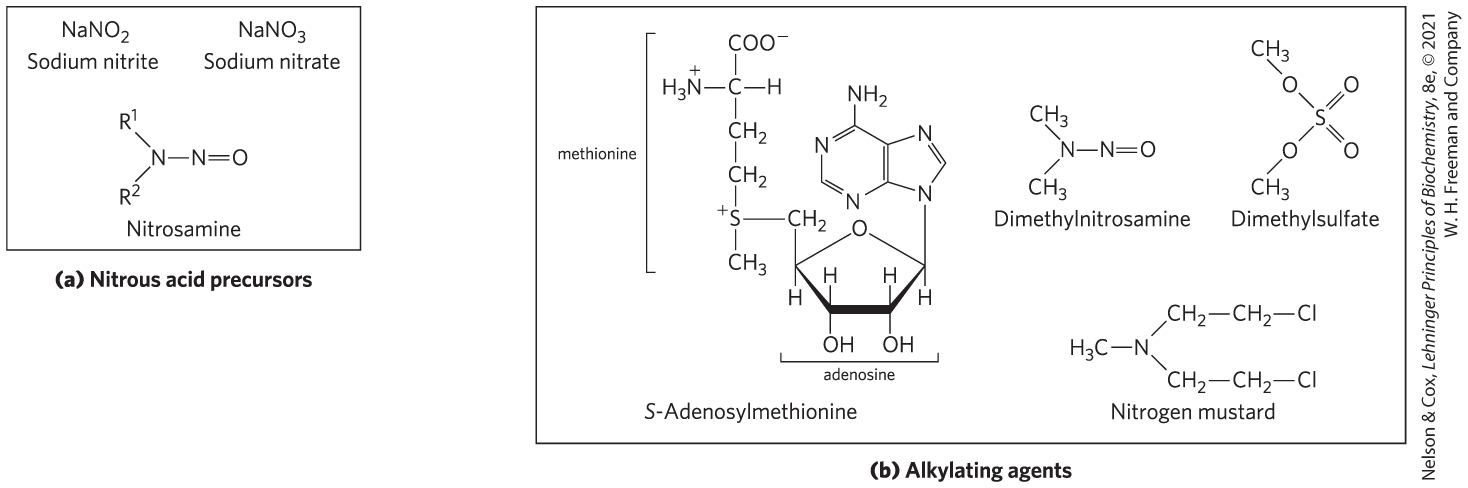
FIGURE 8-31 Chemical agents that cause DNA damage. (a) Precursors of nitrous acid, which promotes deamination reactions. (b) Alkylating agents. Most generate modified nucleotides nonenzymatically.
Nitrous acid, formed from organic precursors such as nitrosamines and from nitrite and nitrate salts, is a potent accelerator of the deamination of bases. Bisulfite has similar effects. Both agents are used as preservatives in processed foods to prevent the growth of toxic bacteria. They do not seem to increase cancer risks significantly when used in this way, perhaps because they are used in only small amounts and make only a minor contribution to the overall levels of DNA damage. (The potential health risk from food spoilage if these preservatives were not used is much greater.)
Alkylating agents can alter certain bases of DNA. For example, the highly reactive chemical dimethylsulfate (Fig. 8-31b) can methylate a guanine to yield -methylguanine, which cannot base-pair with cytosine.

Some alkylation of bases is a normal part of the regulation of gene expression. The enzymatic methylation of certain bases using S-adenosyl methionine is one example discussed below.
The most important source of mutagenic alterations in DNA is oxidative damage. Reactive oxygen species such as hydrogen peroxide, hydroxyl radicals, and superoxide radicals arise during irradiation or (more commonly) as a byproduct of aerobic metabolism. These species damage DNA through any of a large, complex group of reactions, ranging from oxidation of deoxyribose and base moieties to strand breaks. Of these species, the hydroxyl radicals are responsible for most oxidative DNA damage. Cells have an elaborate defense system to destroy reactive oxygen species, including enzymes such as catalase and superoxide dismutase that convert reactive oxygen species to harmless products. A fraction of these oxidants inevitably escape cellular defenses, however, and are able to damage DNA. Accurate estimates for the extent of this damage are not yet available, but every day the DNA of each human cell is subjected to thousands of damaging oxidative reactions.
This is merely a sampling of the best-understood reactions that damage DNA. Many carcinogenic compounds in food, water, and air exert their cancer-causing effects by modifying bases in DNA. Nevertheless, the integrity of DNA as a polymer is better maintained than that of either RNA or protein, because DNA is the only macromolecule that has the benefit of extensive biochemical repair systems. These repair processes (described in Chapter 25) greatly lessen the impact of damage to DNA.

Some Bases of DNA Are Methylated
Certain nucleotide bases in DNA molecules are enzymatically methylated. Adenine and cytosine are methylated more often than guanine and thymine. Methylation is generally confined to certain sequences or regions of a DNA molecule. In some cases, the function of methylation is well understood; in others, the function remains unclear. All known DNA methylases use S-adenosylmethionine as a methyl group donor (Fig. 8-31b). E. coli has two prominent DNA methylation systems. One serves in a defense role, allowing the cell to distinguish its DNA from foreign DNA by marking its own DNA with methyl groups. The cell can then identify as foreign and destroy DNA without the methyl groups (this is known as a restriction-modification system; see p. 303). The other enzyme system methylates adenosine residues within the sequence ()GATC() to -methyladenosine (Fig. 8-5a). Methyl groups are added by the Dam (DNA adenine methylation) methylase shortly after DNA replication, allowing the cell to distinguish newly replicated DNA from older cellular DNA (see Fig. 25-20).
In eukaryotic cells, about 5% of cytidine residues in DNA are methylated to 5-methylcytidine (Fig. 8-5a). Methylation is most common at CpG sequences, producing methyl-CpG symmetrically on both strands of the DNA. The extent of methylation of CpG sequences varies by region in large eukaryotic DNA molecules, affecting DNA metabolism and gene expression.
The Chemical Synthesis of DNA Has Been Automated
An important practical advance in nucleic acid chemistry was the rapid and accurate synthesis of short oligonucleotides of known sequence. The methods were pioneered by H. Gobind Khorana and his colleagues in the 1970s. Refinements by Robert Letsinger and Marvin Caruthers led to the chemistry now in widest use, called the phosphoramidite method (Fig. 8-32). The synthesis is carried out with the growing strand attached to a solid support, using principles similar to those used by Merrifield for peptide synthesis (see Fig. 3-30), and is readily automated. The efficiency of each addition step is very high, allowing the routine synthesis of polymers containing 70 or 80 nucleotides and, in some laboratories, much longer strands. The availability of relatively inexpensive DNA polymers with predesigned sequences revolutionized all areas of biochemistry.
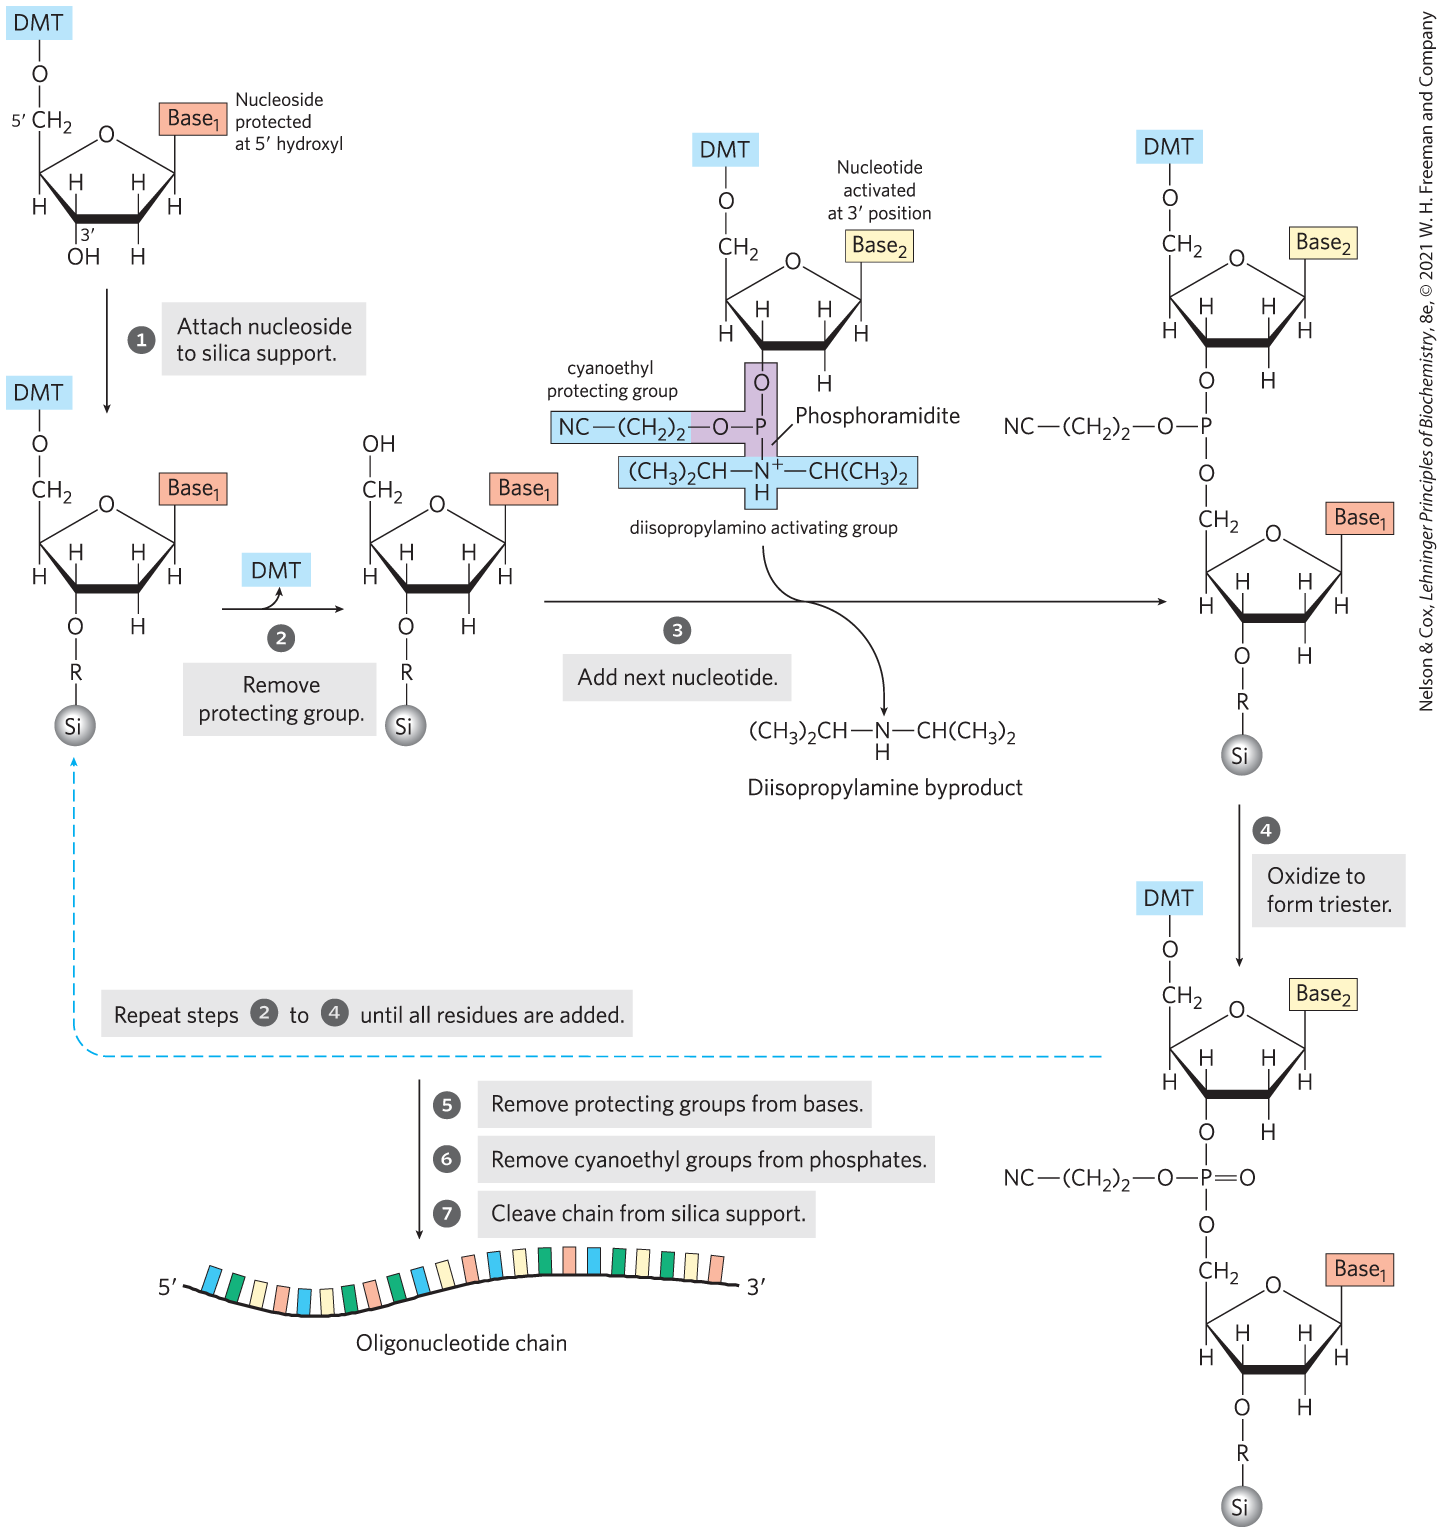
FIGURE 8-32 Chemical synthesis of DNA by the phosphoramidite method. Automated DNA synthesis is conceptually similar to the synthesis of polypeptides on a solid support. The oligonucleotide is built up on the solid support (silica), one nucleotide at a time, in a repeated series of chemical reactions with suitably protected nucleotide precursors. The first nucleoside (which will be the end) is attached to the silica support at the hydroxyl (through a linking group, R) and is protected at the hydroxyl with an acid-labile dimethoxytrityl group (DMT). The reactive groups on all bases are also chemically protected. The protecting DMT group is removed by washing the column with acid (the DMT group is colored, so this reaction can be followed spectrophotometrically). The next nucleotide has a reactive phosphoramidite at its position: a trivalent phosphite (as opposed to the more oxidized pentavalent phosphate normally present in nucleic acids) with one linked oxygen replaced by an amino group or a substituted amine. In the common variant shown, one of the phosphoramidite oxygens is bonded to the deoxyribose, the other is protected by a cyanoethyl group, and the third position is occupied by a readily displaced diisopropylamino group. Reaction with the immobilized nucleotide forms a , linkage, and the diisopropylamino group is eliminated. In step , the phosphite linkage is oxidized with iodine to produce a phosphotriester linkage. Reactions 2 through 4 are repeated until all nucleotides are added. At each step, excess nucleotide is removed before addition of the next nucleotide. In steps and the remaining protecting groups on the bases and the phosphates are removed, and in the oligonucleotide is separated from the solid support and purified. The chemical synthesis of RNA is somewhat more complicated because of the need to protect the hydroxyl of ribose without adversely affecting the reactivity of the hydroxyl.
 The first nucleoside (which will be the end) is attached to the silica support at the hydroxyl (through a linking group, R) and is protected at the hydroxyl with an acid-labile dimethoxytrityl group (DMT). The reactive groups on all bases are also chemically protected.
  The protecting DMT group is removed by washing the column with acid (the DMT group is colored, so this reaction can be followed spectrophotometrically).
  The next nucleotide has a reactive phosphoramidite at its position: a trivalent phosphite (as opposed to the more oxidized pentavalent phosphate normally present in nucleic acids) with one linked oxygen replaced by an amino group or a substituted amine. In the common variant shown, one of the phosphoramidite oxygens is bonded to the deoxyribose, the other is protected by a cyanoethyl group, and the third position is occupied by a readily displaced diisopropylamino group. Reaction with the immobilized nucleotide forms a , linkage, and the diisopropylamino group is eliminated. In step
  , the phosphite linkage is oxidized with iodine to produce a phosphotriester linkage. Reactions 2 through 4 are repeated until all nucleotides are added. At each step, excess nucleotide is removed before addition of the next nucleotide. In steps
  and
and  the remaining protecting groups on the bases and the phosphates are removed, and in
  the oligonucleotide is separated from the solid support and purified. The chemical synthesis of RNA is somewhat more complicated because of the need to protect the hydroxyl of ribose without adversely affecting the reactivity of the hydroxyl.
Gene Sequences Can Be Amplified with the Polymerase Chain Reaction
Genome projects, as described in Chapter 9, have given rise to online databases containing the complete genome sequences of thousands of organisms. This archive of sequence information allows researchers to greatly amplify any DNA segment they might be interested in with the polymerase chain reaction (PCR), a process conceived by Kary Mullis in 1983. Even DNA segments with unknown sequences can be amplified if the sequences flanking them are known. The amplified DNA can then be used for a multitude of purposes, as we shall see.
The PCR procedure, shown in Figure 8-33, relies on DNA polymerases, enzymes that synthesize DNA strands from deoxyribonucleotides (dNTPs), using a DNA template. DNA polymerases do not synthesize DNA de novo, but instead must add nucleotides to the ends of preexisting strands, referred to as primers (see Chapter 25). In PCR, two synthetic oligonucleotides are prepared for use as replication primers that can be extended by a DNA polymerase. These oligonucleotide primers are complementary to sequences on opposite strands of the target DNA, positioned so that their ends define the ends of the segment to be amplified, and they become part of the amplified sequence. The ends of the annealed primers are oriented toward each other and positioned to prime DNA synthesis across the targeted DNA segment.
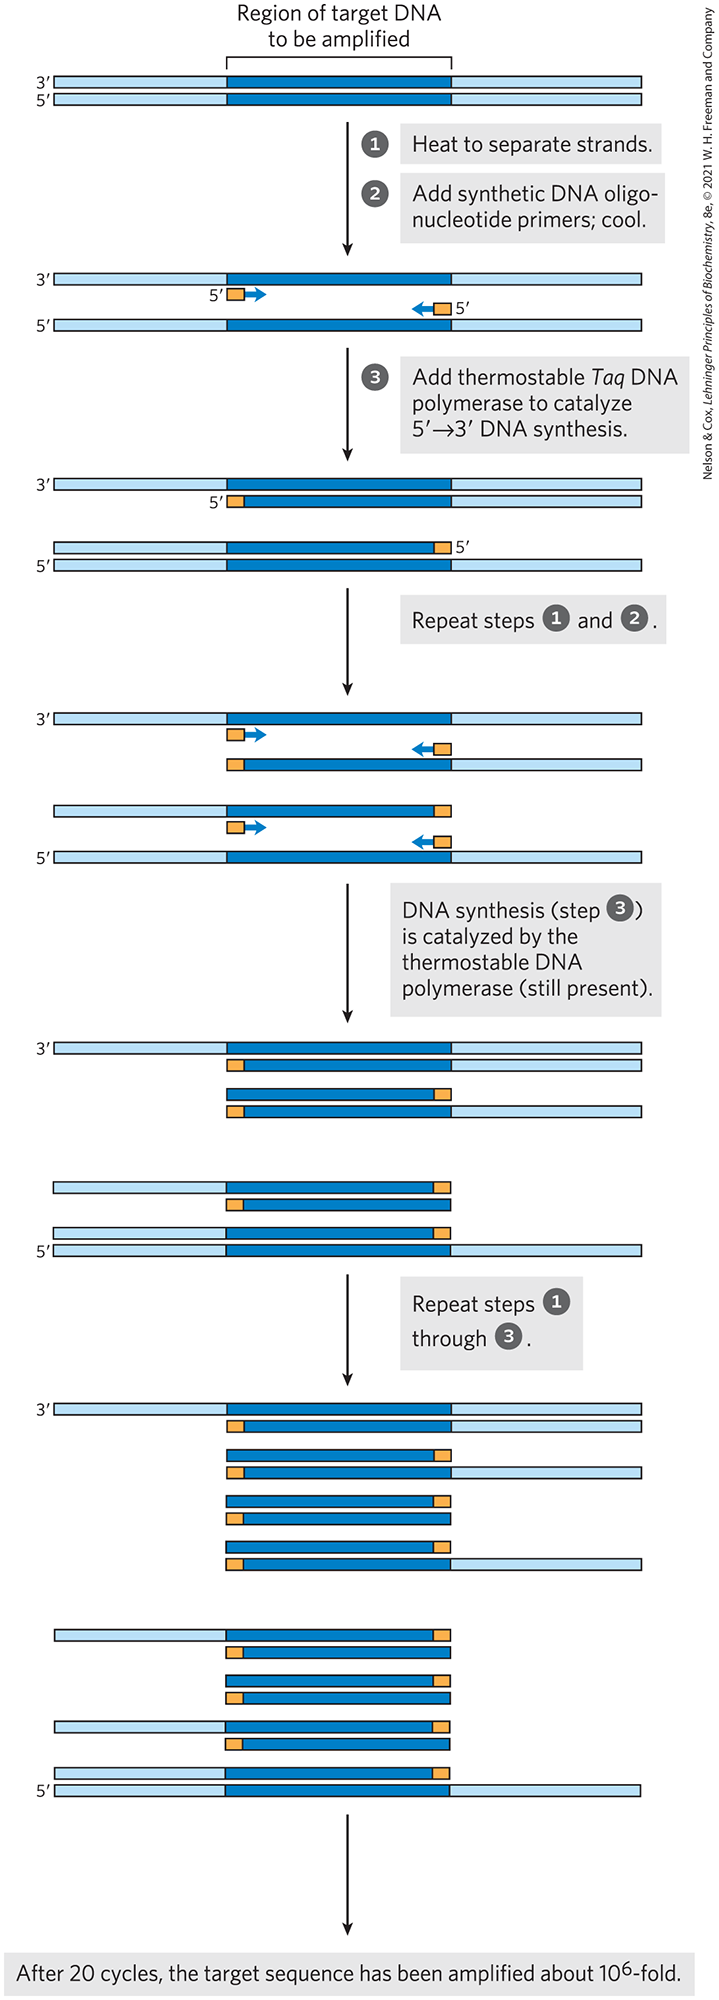
FIGURE 8-33 Amplification of a DNA segment by the polymerase chain reaction (PCR). The PCR procedure has three steps: DNA strands are separated by heating, then annealed to an excess of short synthetic DNA primers (orange) that flank the region to be amplified (dark blue); new DNA is synthesized by polymerization catalyzed by DNA polymerase. The thermostable Taq DNA polymerase is not denatured by the heating steps. The three steps are repeated for 25 or 30 cycles in an automated process carried out in a small benchtop instrument called a thermocycler.
The PCR procedure has an elegant simplicity. Basic PCR requires four components: a DNA sample containing the segment to be amplified, the pair of synthetic oligonucleotide primers, a pool of deoxynucleoside triphosphates, and a DNA polymerase. There are three steps (Fig. 8-33). In step , the reaction mixture is heated briefly to denature the DNA, separating the two strands. In step , the mixture is cooled so that the primers can anneal to the DNA. The high concentration of primers increases the likelihood that they will anneal to each strand of the denatured DNA before the two DNA strands (present at a much lower concentration) can reanneal to each other. Then, in step , the primed segment is replicated selectively by the DNA polymerase, using the pool of dNTPs. The cycle of heating, cooling, and replication is repeated 25 to 30 times over a few hours in an automated process, amplifying the DNA segment between the primers until the sample is large enough to be readily analyzed or cloned (described in Chapter 9).
Each replication cycle doubles the number of target DNA segment copies, so the concentration grows exponentially. The flanking DNA sequences increase in number linearly, but this effect is quickly rendered insignificant. After 20 cycles, the targeted DNA segment has been amplified more than a millionfold (); after 30 cycles, more than a billionfold. Step of PCR uses a heat-stable DNA polymerase such as the Taq polymerase, isolated from a thermophilic bacterium (Thermus aquaticus) that thrives in hot springs where temperatures approach the boiling point of water. The Taq polymerase remains active after every heating step (step ) and does not have to be replenished.
This technology is highly sensitive: PCR can detect and amplify just one DNA molecule in almost any type of sample — including some ancient ones. The double-helical structure of DNA is highly stable, but as we have seen, DNA does degrade slowly over time through various nonenzymatic reactions. PCR has allowed the successful cloning of rare, undegraded DNA segments isolated from samples more than 40,000 years old. Investigators have used the technique to clone DNA fragments from the mummified remains of humans and extinct animals, such as the woolly mammoth, creating the research fields of molecular archaeology and molecular paleontology. DNA from burial sites has been amplified by PCR and used to trace ancient human migrations (see Fig. 9-31). Epidemiologists use PCR-enhanced DNA samples from human remains to trace the evolution of human pathogenic viruses. Due to its capacity to amplify just a few strands of DNA that might be present in a sample, PCR is a potent tool in forensic medicine (Box 8-1). It is also being used to detect viral infections and certain types of cancers before they cause symptoms, as well as in the prenatal diagnosis of genetic diseases.
 This technology is highly sensitive: PCR can detect and amplify just one DNA molecule in almost any type of sample — including some ancient ones. The double-helical structure of DNA is highly stable, but as we have seen, DNA does degrade slowly over time through various nonenzymatic reactions. PCR has allowed the successful cloning of rare, undegraded DNA segments isolated from samples more than 40,000 years old. Investigators have used the technique to clone DNA
 WORKED EXAMPLE 8-2 Designing Primers for the Polymerase Chain Reaction
You set out to amplify the chromosomal sequence between the bases underlined below, using PCR. Only one strand is shown, but keep in mind that it is paired to a complementary strand.
TGGTAGGCCGAT – – – [1,000 bp] – – – TAGCTAAGAATCTTTCTCAGAA
Design single-stranded oligonucleotide primers to amplify only those sequences between (and including) the underlined bases. The optimal length for PCR primers is usually 18 to 22 nucleotides. For this example, simply write the first 6 nucleotides of each primer.
SOLUTION:
Left primer GTAGGC
Right primer AAGATT
Remember, (1) the two strands of DNA are antiparallel, (2) DNA synthesis proceeds uniquely in the direction, (3) DNA synthesis must be directed across the region to be amplified, and (4) DNA sequences are always written in the direction. The sequence given is thus oriented , left to right, even though no orientation guides are provided. The left primer must be complementary to the strand not shown, which is in the opposite orientation. Thus, the left primer begins at the G and is identical to the sequence shown. The right primer must direct DNA synthesis right to left, synthesizing a strand complementary to the strand provided. It will begin with an A complementary to the T, and then continue with additional nucleotides complementary to the strand shown. Although that sequence is written right to left, it is in the direction and must be flipped to be in the conventional orientation, written , left to right. Companies that provide PCR primers expect orders to be written in the conventional direction. Doing otherwise is a common (and expensive) mistake.
The Sequences of Long DNA Strands Can Be Determined
In its capacity as a repository of information, a DNA molecule’s most important property is its nucleotide sequence. Until the late 1970s, determining the sequence of a nucleic acid containing as few as 5 or 10 nucleotides was very laborious. The development of two techniques in 1977 (one by Allan Maxam and Walter Gilbert, the other by Frederick Sanger) made possible the sequencing of larger DNA molecules. Although the two methods are similar in strategy, Sanger sequencing, also known as dideoxy chain-termination sequencing, is both technically easier and more accurate (Fig. 8-34).
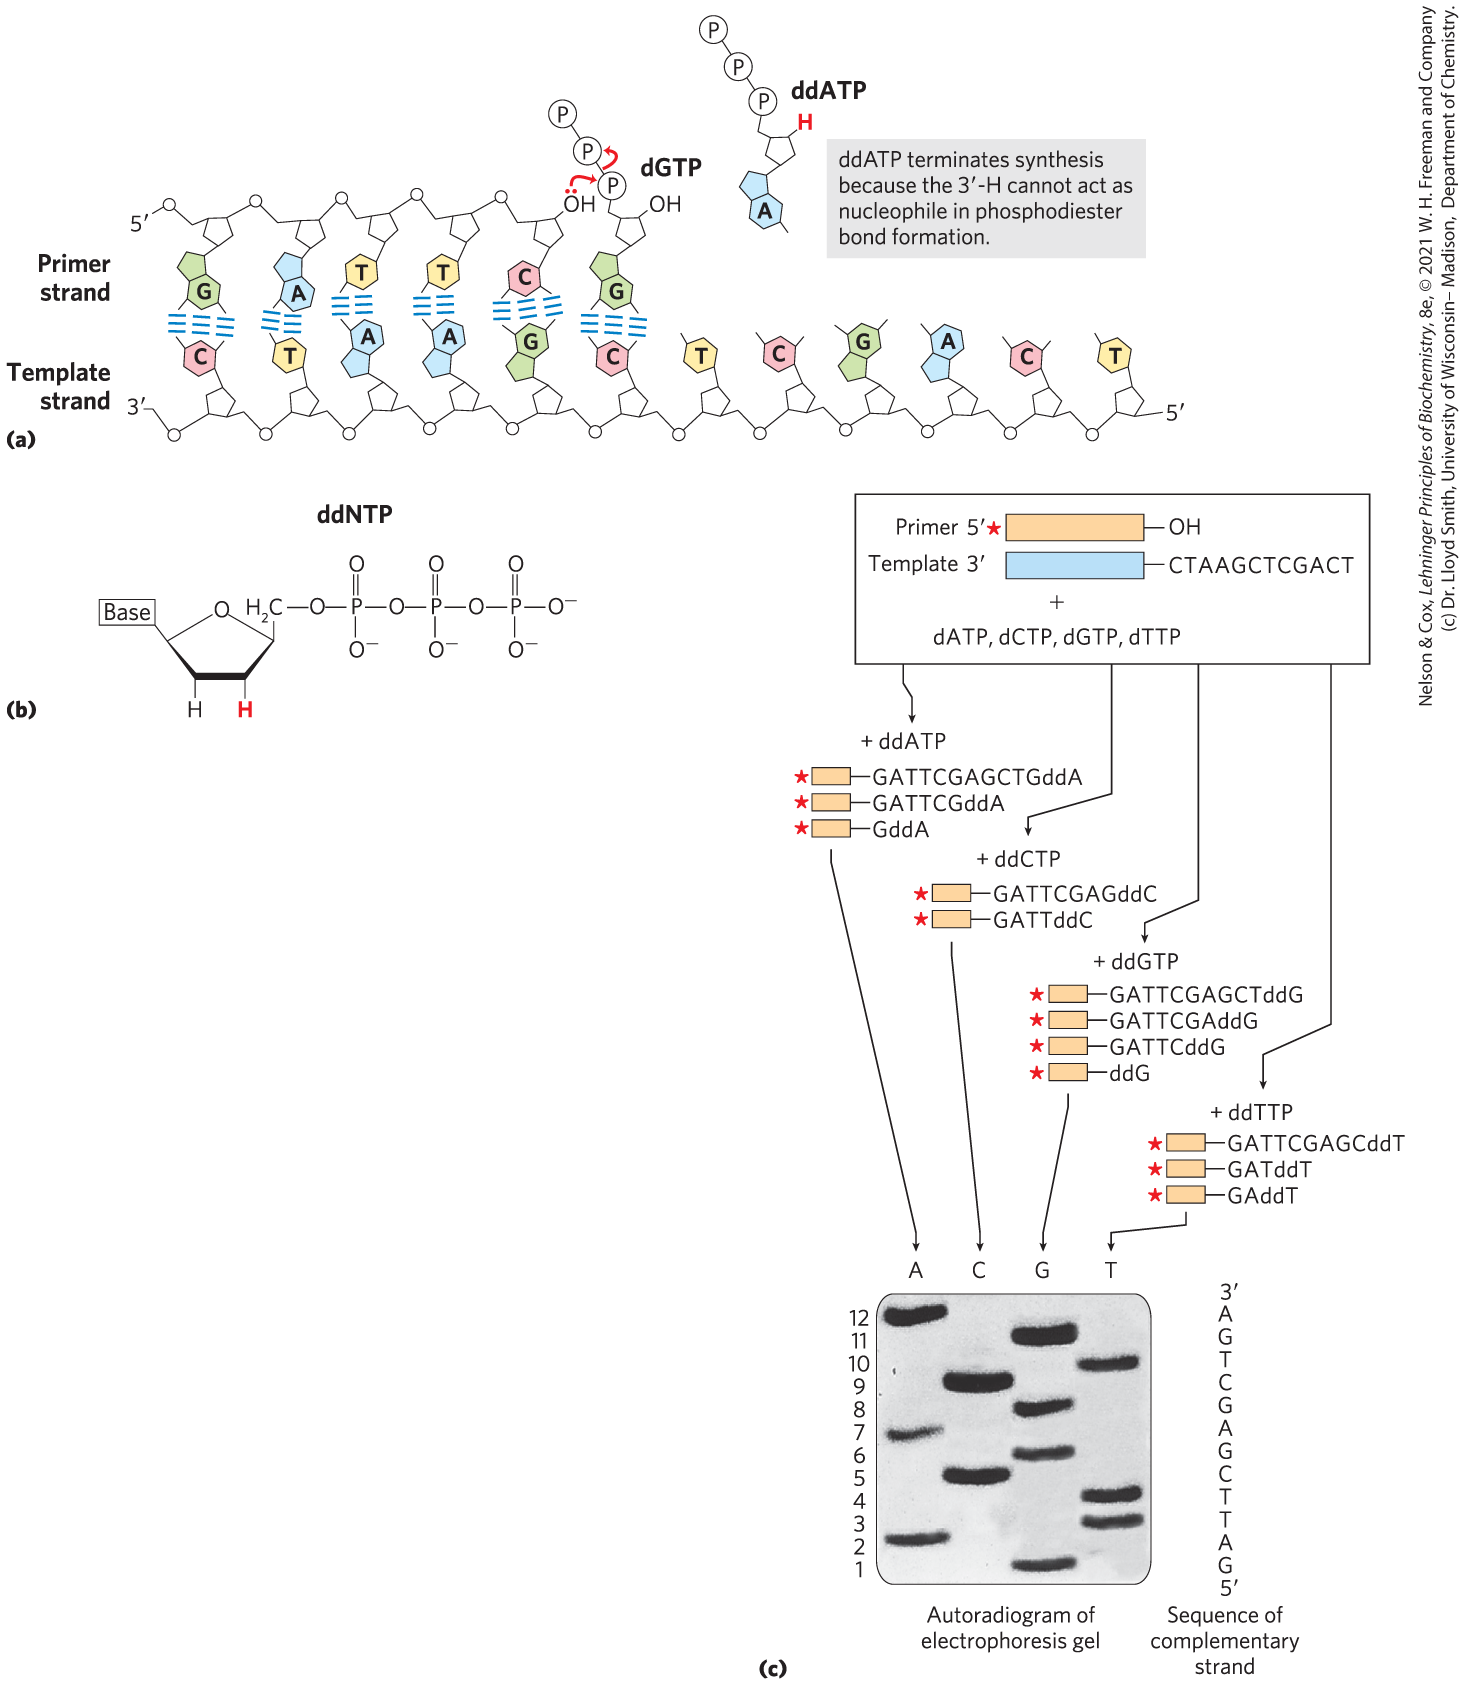
FIGURE 8-34 DNA sequencing by the Sanger method. This method makes use of the mechanism of DNA synthesis by DNA polymerases (Chapter 25). (a) DNA polymerases require both a primer (a short oligonucleotide strand), to which nucleotides are added, and a template strand to guide the selection of each new nucleotide. In cells, the -hydroxyl group of the primer reacts with an incoming deoxynucleoside triphosphate — dGTP in this example — to form a new phosphodiester bond. The Sanger sequencing procedure uses dideoxynucleoside triphosphate (ddNTP) analogs to interrupt DNA synthesis. When a ddNTP — ddATP in this example — is inserted in place of a dNTP, strand elongation is halted after the analog is added, because the analog lacks the -hydroxyl group needed for the next step. (b) Dideoxynucleoside triphosphate analogs have —H (red) rather than —OH at the position of the ribose ring. (c) The DNA to be sequenced is used as the template strand, and a short primer, radioactively (in the example here) or fluorescently labeled, is annealed to it. The result is a solution containing a mixture of labeled fragments of particular length, each ending with a C residue. The different-sized fragments, separated by electrophoresis, reveal the location of C residues. This procedure is repeated separately for each of the four ddNTPs, and the sequence can be read directly from an autoradiogram of the gel. Because shorter DNA fragments migrate faster, the fragments near the bottom of the gel represent the nucleotide positions closest to the primer (the end), and the sequence is read (in the direction) from bottom to top. Note that the sequence obtained is that of the strand complementary to the strand being analyzed.
Any protocol for DNA sequencing has two parts. One must first chemically distinguish between G, C, T, and A residues. A second strategy is then needed to determine where the four residues appear in the overall sequence.
Sanger sequencing exploited new (at the time) information about the mechanism of DNA synthesis by DNA polymerase to distinguish between the four nucleotides, making use of nucleotide analogs called dideoxynucleoside triphosphates (ddNTPs) to interrupt synthesis specifically at one or another type of nucleotide. Like PCR, Sanger’s method makes use of DNA polymerases and a primer to synthesize a DNA strand complementary to the strand under analysis. Each added deoxynucleotide is complementary, through base pairing, to a base in the template strand. In the reaction catalyzed by DNA polymerase, the -hydroxyl group of the primer reacts with an incoming dNTP to form a new phosphodiester bond (Fig. 8-34a). The ddNTPs interrupt DNA synthesis because they bind to the template strand but lack the -hydroxyl group needed to add the next nucleotide (Fig. 8-34b). Once a ddNTP is added to a growing strand, that strand cannot be extended further.
For instance, to identify C residues, a small amount of ddCTP is added to a reaction system containing a much larger amount of dCTP (along with the other three dNTPs). A competition then occurs every time the DNA polymerase encounters a G in the template strand. Usually, dC is added, and synthesis of the strand continues. Sometimes, ddC will be added instead, and the strand will be terminated at that position. Thus, a small fraction of the synthesized strands are prematurely terminated at every position where dC would normally be added, opposite each template dG. Given the excess of dCTP over ddCTP, the chance that the analog will be incorporated instead of dC is small. But enough ddCTP is present to ensure that some of the strands will be terminated at each G residue in the template.
The result is a solution containing a mixture of fragments, each ending with a ddC residue. The fragments differ in length, and locating the C residues then relies on precise electrophoretic methods that allow separation of DNA strands differing in size by only one nucleotide residue. (See Fig. 3-18 for a description of gel electrophoresis.) Note that in most sequencing protocols, the sequence obtained is that of the newly synthesized strand complementary to the template strand being analyzed.
When this procedure was first developed, the process was repeated separately for each of the four ddNTPs. Radioactively labeled primers allowed researchers to detect the DNA fragments generated during the DNA synthesis reactions. The sequence of the synthesized DNA strand was read directly from an autoradiogram of the resulting gel (Fig. 8-34c). Because shorter DNA fragments migrate faster, the fragments near the bottom of the gel represented the nucleotide positions closest to the primer (the end), and the sequence was read (in the direction) from bottom to top.
DNA sequencing was first automated by a variation of the Sanger method, in which each of the four ddNTPs used for a reaction was labeled with a different-colored fluorescent tag (Fig. 8-35). With this technology, all four fluorescent ddNTPs could be introduced into a single reaction. The terminated fragments, each of a different size, could be separated by electrophoresis in a single gel lane. The identity of the residue that terminated each fragment was made evident by its fluorescent color. Researchers could sequence DNA molecules containing thousands of nucleotides in a few hours, and the entire genomes of hundreds of organisms were sequenced in this way. For example, in the Human Genome Project, researchers sequenced all bp of the DNA in a human cell (see Chapter 9) in an effort that spanned nearly a decade and included contributions from dozens of laboratories worldwide. This form of Sanger sequencing is still used for routine analysis of short segments of DNA.
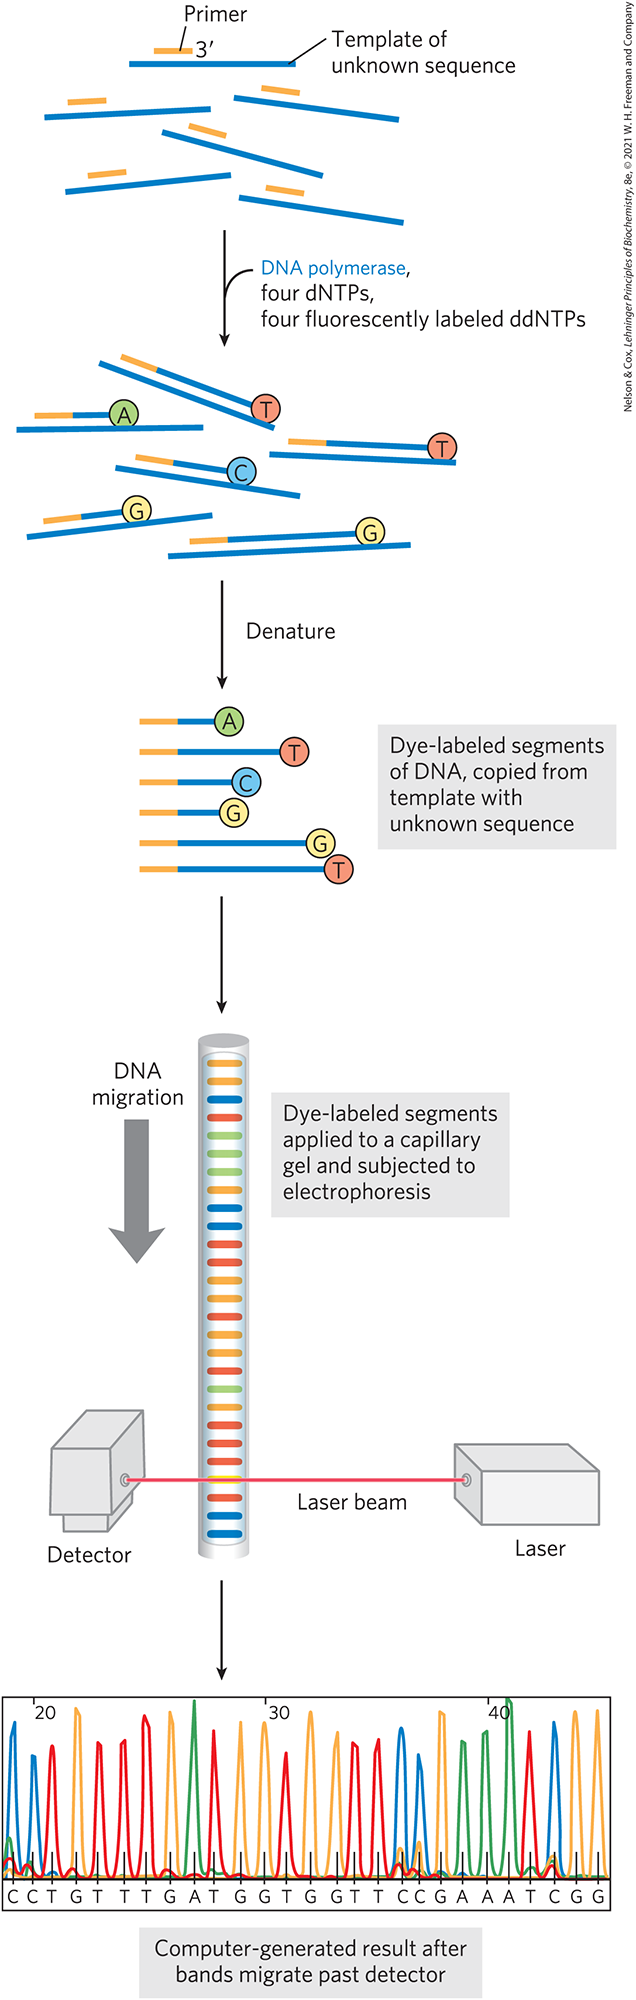
FIGURE 8-35 Automation of DNA sequencing reactions. In the Sanger method, each ddNTP can be linked to a fluorescent (dye) molecule that gives the same color to all the fragments terminating in that nucleotide, with a different color for each nucleotide. All four labeled ddNTPs are added to the reaction mix together. The resulting colored DNA fragments are separated by size in an electrophoretic gel in a capillary tube (a refinement of gel electrophoresis that allows faster separations). All fragments of a given length migrate through the capillary gel together in a single band, and the color associated with each band is detected with a laser beam. The DNA sequence is read by identifying the color sequences in the bands as they pass the detector and feeding this information directly to a computer. The amount of fluorescence in each band is represented as a peak in the computer output. [Data from Dr. Lloyd Smith, University of Wisconsin–Madison, Department of Chemistry.]
DNA Sequencing Technologies Are Advancing Rapidly
The billions of base pairs in a complete human genome can now be sequenced in a day or two, the millions in a bacterial genome in a few hours. With modest expense, a personal genomic sequence can be routinely included in each individual’s medical record. These advances have been made possible by methods sometimes referred to as next-generation, or “next-gen,” sequencing. The sequencing strategies have some similarities to the Sanger method. Innovations have allowed a miniaturization of the procedure, a massive increase in scale, and a corresponding decrease in cost. Two widely used approaches, reversible terminator sequencing and single molecule real time (SMRT) sequencing, both developed commercially, are described.
In both approaches, large genomes are sequenced by first collecting the DNA from many cells of the organism or individual. The DNA is sheared at random locations to generate fragments of a particular average size. The individual fragments — many with overlapping sequences — are immobilized on a solid support, and each is sequenced in place. Fluorescent dyes linked to the nucleotides and powerful optical systems that can detect incorporation of each new nucleotide by DNA polymerase allow the sequencing process to be monitored directly. The fluorescent dyes and the design of the methods solve both problems in DNA sequencing at once, identifying each nucleotide and fixing its location in the large sequence. Individual regions of a genome may be sequenced hundreds, even thousands, of times. The entire genomic sequence is reconstructed by computer programs that align the sequences of overlapping fragments.
In the reversible terminator sequencing method developed by Illumina, the genomic DNA to be sequenced is sheared so as to generate fragments a few hundred base pairs long. Synthetic oligonucleotides of known sequence are ligated to each end of each fragment, providing a point of reference on every DNA molecule. The individual fragments are then immobilized on a solid surface, and each is amplified in place by PCR to form a tight cluster of identical fragments. The solid surface is part of a channel on a flow cell that allows liquid solutions to stream over the samples. The result is a solid surface just a few centimeters wide with millions of attached DNA clusters, each cluster containing multiple copies of a single DNA sequence derived from a random genomic DNA fragment. To provide a starting point for DNA polymerase, an oligonucleotide primer is then added that is complementary to the oligonucleotides of known sequence ligated to the various fragment ends. All of these millions of clusters are sequenced at the same time, with the data from each cluster captured and stored by a computer.
The actual sequencing of each cluster employs reversible terminator sequencing (Fig. 8-36). Four different modified deoxynucleotides (A, T, G, and C), each with a particular fluorescent label that identifies the nucleotide by color, are added to the sequencing reaction, along with the DNA polymerase. The labeled nucleotides also incorporate blocking groups attached to their ends that permit only one nucleotide to be added to each strand. The polymerase adds the appropriate nucleotide to the strands in each cluster, giving each cluster a color that corresponds to the added nucleotide. Next, lasers excite all the fluorescent labels, and an image of the entire surface reveals the color (and thus the identity) of the base added to each cluster. The fluorescent label and the blocking groups are then chemically or photolytically removed. The surface goes dark until the solution with labeled nucleotides and DNA polymerase is again introduced to the surface, allowing the next nucleotide to be added to each cluster. The sequencing proceeds stepwise. Read lengths obtained with this technology (that is, the length of individual DNA sequences that can be accurately determined) are typically 100 to 300 nucleotides. Read length is limited by constraints on cluster density on the flow cell surface and by small inefficiencies in the PCR reactions needed to amplify each cluster accurately. Accuracy is high, with error rates as low as 0.1%.
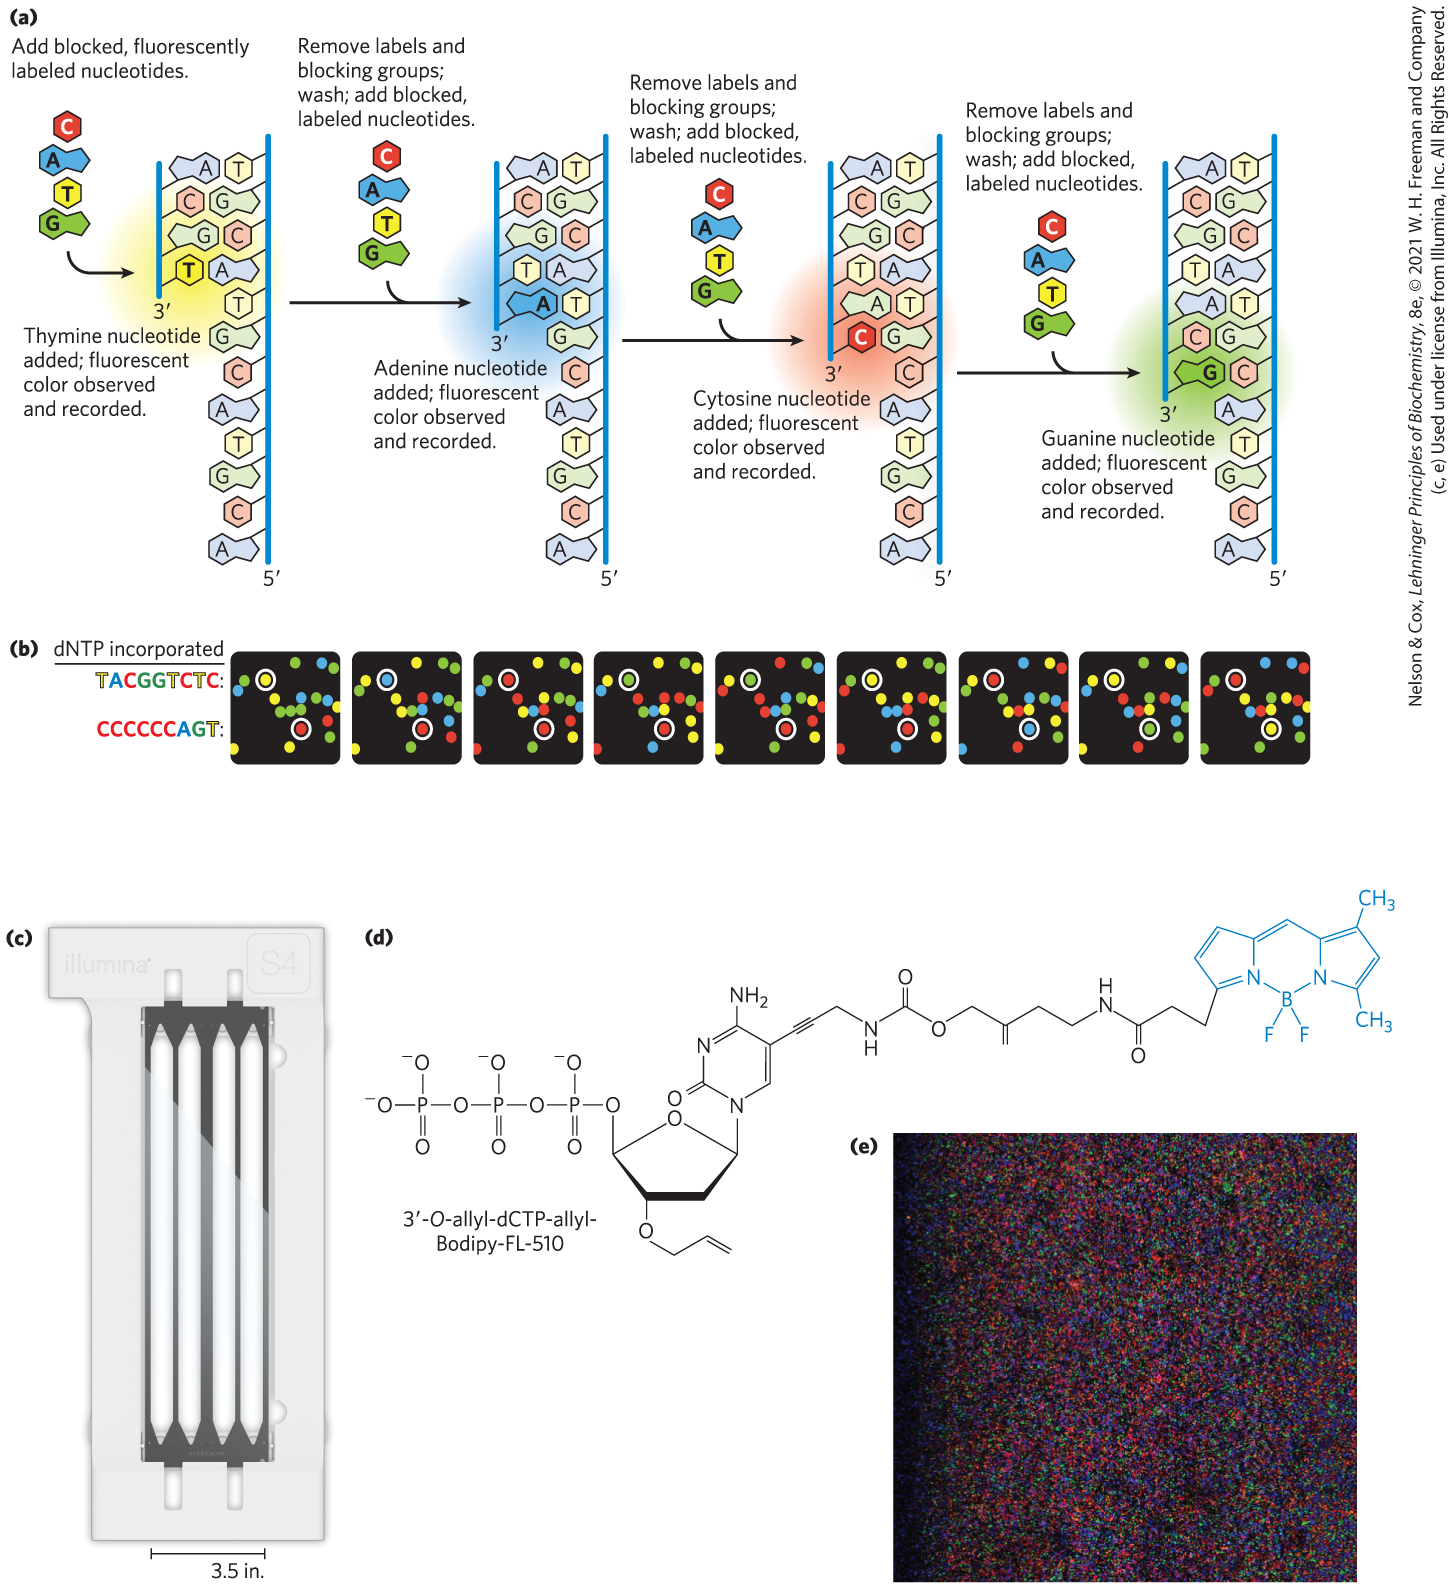
FIGURE 8-36 Next-generation reversible terminator sequencing. (a) Blocking groups on each fluorescently labeled nucleotide prevent multiple nucleotides from being added in a single cycle. (b) Artist’s rendition of nine successive cycles from one very small part of an Illumina sequencing run. Each colored spot represents the location of a cluster of immobilized identical oligonucleotides affixed to the surface of the flow cell. The white-circled spots represent the same two clusters on the surface over successive cycles, with the sequences indicated. Data are recorded and analyzed digitally. (c) Typical flow cell used for a next-generation sequencer. Millions of DNA fragments can be sequenced simultaneously in each of the four channels. (d) A dCTP molecule modified with a fluorescent dye and a blocking group for use in reversible terminator sequencing. Both the dye and the -end-blocking group can be removed, either chemically or photolytically, leaving a free -OH group for addition of the next nucleotide. The modified nucleotides currently used in reversible terminator sequencing are proprietary. (e) Part of the surface of one channel during a sequencing reaction.
The relatively short read lengths produced by the Illumina technology are problematic in some situations, such as the sequencing of long stretches of DNA where short sequences are repeated over and over. Pacific Biosciences has pioneered the single-molecule real time (SMRT) sequencing method that allows read lengths averaging up to 30,000 to 40,000 bp (Fig. 8-37). The SMRT technology has a lower throughput, a higher cost, and a higher error rate than the Illumina approach. However, the very long read lengths are essential in some applications, particularly to reconstruct the complete genomes of higher organisms that may contain extensive regions of repeated DNA sequences. They also facilitate the detection of genomic alterations — deletions, duplications, or rearrangements of genomic segments — that arise in some cells, such as those in cancerous tumors (see Box 24-2).
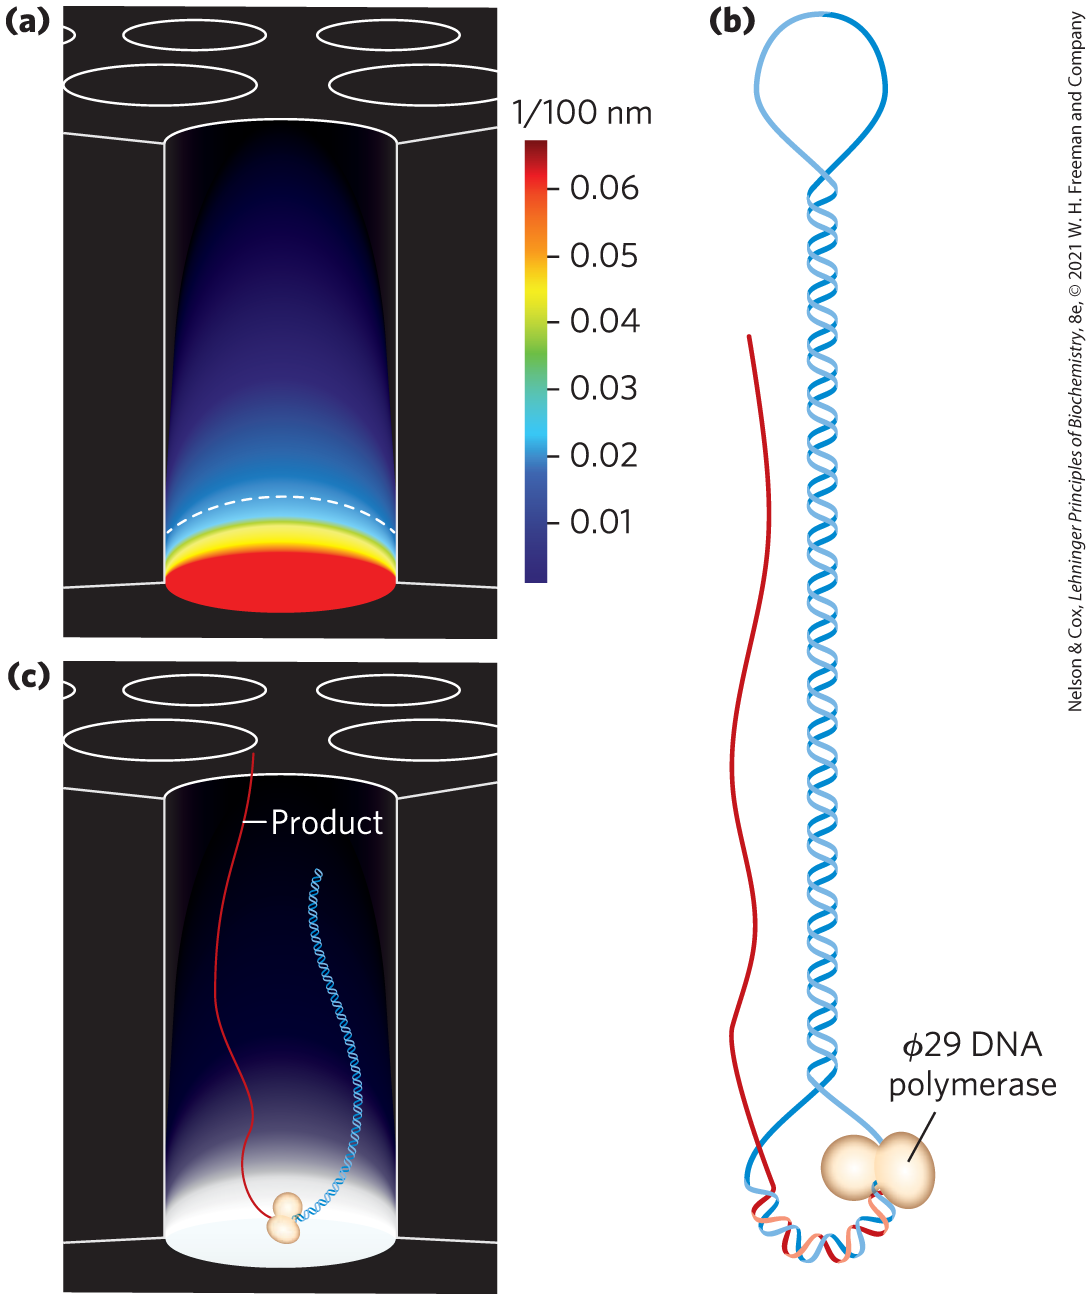
FIGURE 8-37 SMRT sequencing. (a) One pore in an SMRT cell. The pore is smaller in diameter than the wavelength of visible light, so that light projected at the bottom penetrates only a short distance into the pore. (b) DNA fragments sequenced by SMRT technology. Hairpin oligonucleotides are ligated to both ends. A primer for DNA synthesis is annealed to one and sometimes both single-stranded regions in the hairpin ends. (c) DNA synthesis by a DNA polymerase immobilized within a SMRT pore. A fluorescent dye is attached to the triphosphate of the nucleoside triphosphates used. The dye is released from each nucleotide incorporated into the growing DNA strand and its wavelength recorded.
SMRT sequencing utilizes SMRT cells with 150,000 pores, each pore smaller in diameter (~70 nm) than the wavelength of visible light. Attenuated light from an excitation beam penetrates only the lower 20 to 30 nm in each pore, producing a light volume small enough to accommodate just one DNA polymerase molecule (Fig. 8-37a). A single DNA polymerase is immobilized at the bottom of each pore. Genomic DNA is sheared to generate random fragments that are tens of thousands of base pairs in length. Hairpin oligonucleotides are ligated to both ends of each fragment, so that the two DNA strands are joined in one continuous circle (Fig. 8-37b). A primer is annealed to the open single-stranded DNA at one end of the fragment, and this is captured by a DNA polymerase in one of the pores to initiate DNA synthesis.
Fluorescent nucleotides are introduced, with A, T, G, and C each having a specific colored dye attached to the triphosphate. When a nucleotide binds to the DNA polymerase in the pore, it is immobilized long enough to produce a brief fluorescent light pulse that can be read by a detector (Fig. 8-37c). The fluorescent dye is released with the pyrophosphate as each new phosphodiester bond is formed. The error rate is high, about 10% to 15%. However, as the DNA template is a continuous circle, one DNA polymerase can replicate the same fragment over and over. The light pulses continue without interruption as new nucleotides are added in real time, and each pore thus generates a movie of light pulses (sometimes several hours long) that corresponds to the repeated sequencing of the DNA fragment bound in that pore. A computer program deletes the known sequences of the hairpin ends. Error is reduced by compiling a consensus sequence of the fragment by automated alignment of the many repeated sequencing passes and acceptance of the most common nucleotide signal detected at each position.
Translating the sequences of millions of short DNA fragments into a complex and contiguous genomic sequence requires the computerized alignment of overlapping fragments (Fig. 8-38). The number of times that a particular nucleotide in a genome is sequenced, on average, is referred to as the sequencing depth or sequencing coverage. In many cases, a sufficiently large number of random fragments are sequenced so that each nucleotide in the genome is sequenced an average of hundreds to thousands of times (100× to 1,000× coverage). Although the coverage of particular nucleotides may vary, a high level of coverage ensures that most sequencing errors will be detected and eliminated. The overlaps allow the computer to trace the sequence through a chromosome, from one overlapping fragment to another, permitting the assembly of long, contiguous sequences called contigs. In a successful genomic sequencing exercise, many contigs can extend over millions of base pairs.
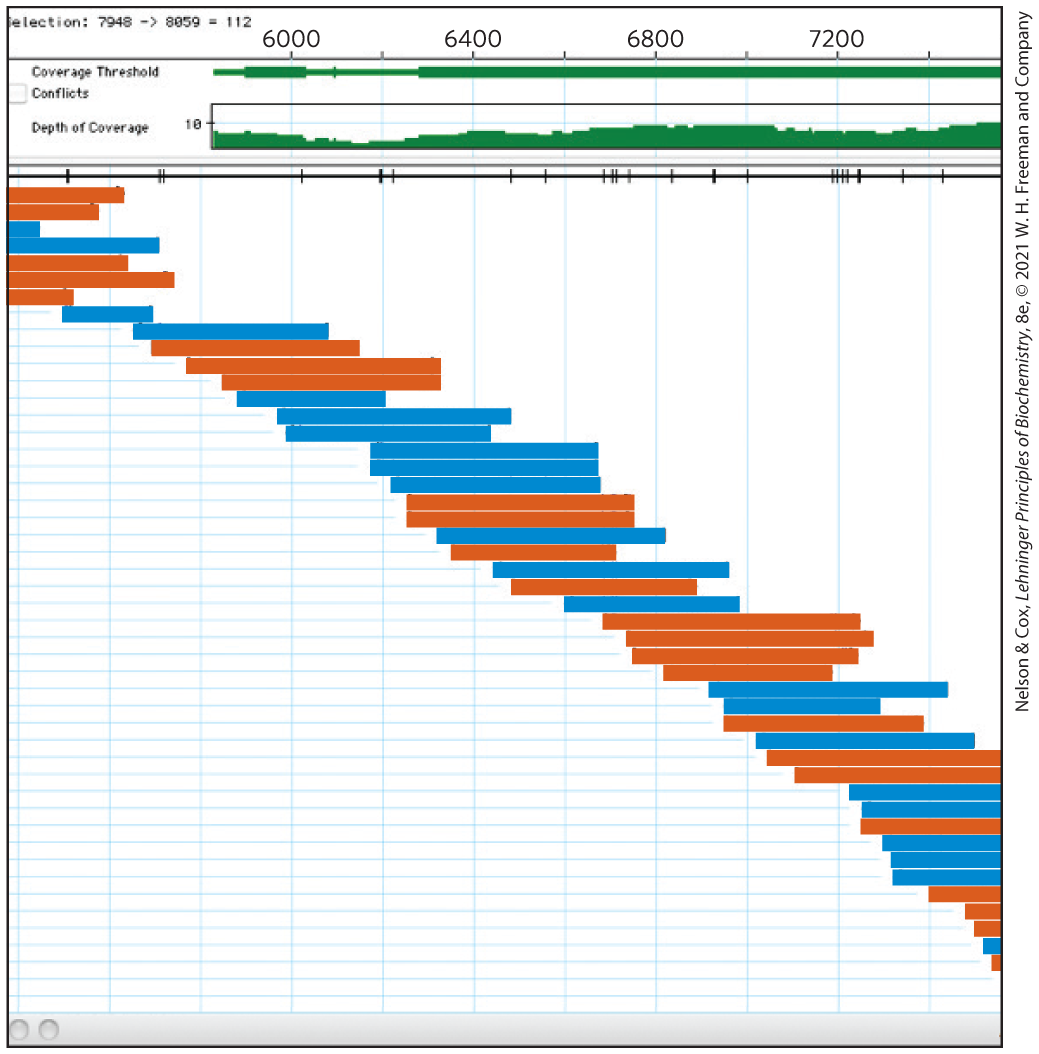
FIGURE 8-38 Sequence assembly. In a genomic sequence, each base pair of the genome is usually represented in multiple sequenced fragments, referred to as reads. This schematic shows how the overlaps between reads are used to assemble a contiguous segment of the genomic sequence, or contig. The numbers at the top represent base-pair positions in the genome, relative to an arbitrarily defined reference point. All sequence fragments come from a particular long contig. The reads are represented by horizontal colored bars. DNA strand segments are sequenced at random, with sequences obtained from one strand ( to , left to right) or the other strand ( to , right to left) represented by blue lines or red lines, respectively. The coverage bar at the top indicates how many times the sequence at a particular position has appeared in a sequenced read, with higher numbers corresponding to increased quality of the output sequence data.
The rapid evolution of DNA sequencing technologies shows no signs of slowing. As costs plummet and sensitivity increases, new applications come online to enhance medicine, forensics, archaeology, and many other fields. We present some of those applications in Chapter 9.
SUMMARY 8.3 Nucleic Acid Chemistry
- Native DNA undergoes reversible unwinding and separation of strands (melting) upon heating or at extremes of pH. DNAs rich in pairs have higher melting points than DNAs rich in pairs.
- DNA is a relatively stable polymer. Spontaneous reactions such as deamination of certain bases, hydrolysis of base-sugar N-glycosyl bonds, radiation-induced formation of pyrimidine dimers, and oxidative damage occur at very low rates, yet are important because of a cell’s very low tolerance for changes in its genetic material.
- DNA is subject to enzymatic modification of nucleotide bases at particular locations. Methylated bases are common.
- Oligonucleotides of known sequence can be synthesized rapidly and accurately.
- The polymerase chain reaction (PCR) provides a convenient and rapid method for amplifying segments of DNA if the sequences of the ends of the targeted DNA segment are known.
- Routine DNA sequencing of genes or short DNA segments is carried out using an automated variation of Sanger dideoxy sequencing.
- DNA sequences, including entire genomes, can be efficiently determined in hours or days using commercial next-gen sequencing technologies.
 Native DNA undergoes reversible unwinding and separation of strands (melting) upon heating or at extremes of pH. DNAs rich in pairs have higher melting points than DNAs rich in pairs.