9.3 Genomics and the Human Story
Since the report of the first complete human genomes in 2001, human genome sequencing has become routine. The genomes of tens of thousands of other species have now been sequenced and made publicly available, providing a look at genomic complexity throughout the three domains of living organisms: Bacteria, Archaea, and Eukarya. Whereas many early sequencing projects focused on species commonly used in research laboratories, the projects now include species of practical, medical, agricultural, and evolutionary interest. Genomes from every known bacterial family have been sequenced. Completed eukaryotic genome sequences number in the tens of thousands. Genomes of extinct species such as Homo neanderthalensis and of humans who died in past millennia have also been sequenced. Personal genomes are playing an ever-increasing role in medicine.
Each genome sequence becomes an international resource for researchers. Collectively, the sequences provide a source for broad comparisons that help pinpoint both variable and highly conserved gene segments, and they allow the identification of genes that are unique to a species or group of species. Efforts to map genes, identify new proteins and disease-related genes, elucidate genetic patterns of medical interest, and trace our evolutionary history are among the many initiatives under way.
The Human Genome Contains Many Types of Sequences
The rapidly growing genome databases have the potential not only to fuel advances in all realms of biochemistry but also to change the way we think about ourselves. What does our own genome, and comparisons with those of other organisms, tell us?
In some ways, we are not as complicated as we once imagined. Humans have only about 20,000 protein-coding genes — less than twice the number in a fruit fly (13,600 genes), not many more than in a nematode worm (19,700 genes), and fewer than in a rice plant (38,000 genes).
In other ways, we are more complex than we previously realized. Many, if not most, eukaryotic genes contain one or more segments of DNA that do not code for the amino acid sequence of a polypeptide product. These nontranslated segments interrupt the otherwise colinear relationship between the gene’s nucleotide sequence and the amino acid sequence of the encoded polypeptide. Such nontranslated DNA segments are called introns, and the coding segments are called exons (Fig. 9-24). Few bacterial genes contain introns. The introns are spliced from a precursor RNA transcript to generate a transcript that can be translated contiguously into a protein product (see Chapter 26). An exon often (but not always) encodes a single domain of a larger, multidomain protein. Humans share many protein domain types with plants, worms, and flies, but the domains in the human genome are mixed and matched in more complex ways, increasing the variety of proteins found in our proteome. Alternative modes of gene expression and RNA splicing permit alternative combinations of exons, leading to the production of more than one protein from a single gene. Alternative splicing (Chapter 26) is far more common in humans and other vertebrates than in worms or bacteria, allowing greater complexity in the number and kinds of proteins generated.
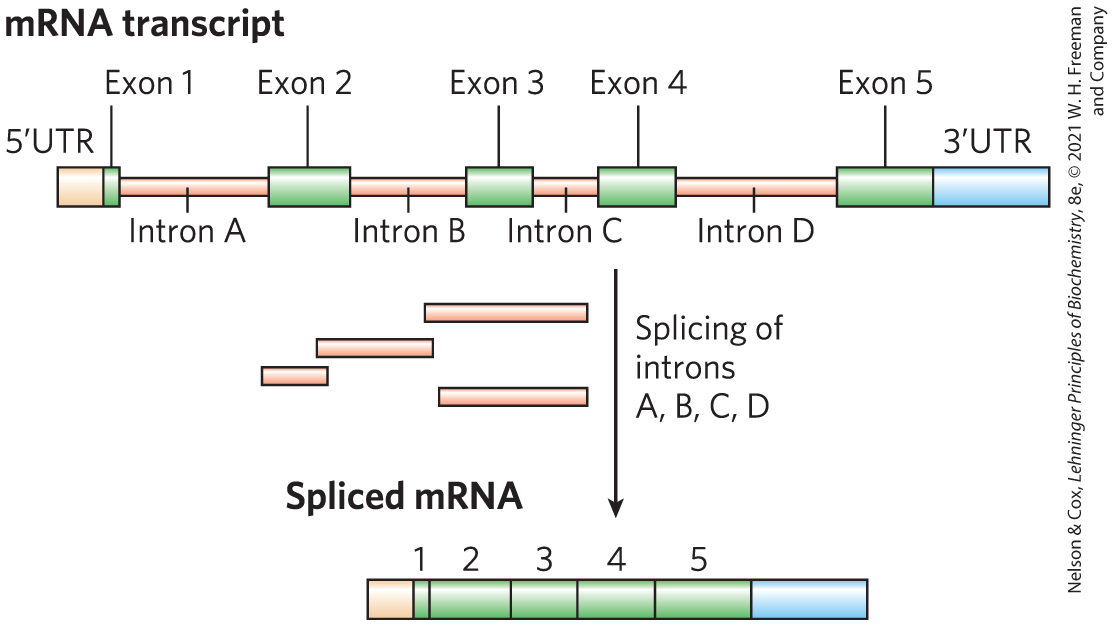
FIGURE 9-24 Introns and exons. This gene transcript contains five exons and four introns, along with and untranslated regions (UTR and UTR). Splicing removes the introns to create an mRNA product for translation into protein.
In mammals and some other eukaryotes, the typical gene has a much higher proportion of intron DNA than exon DNA; in most cases, the function of introns is not clear. Less than 1.5% of human DNA is “protein-coding” or exon DNA, carrying information for protein products (Fig. 9-25a). However, when introns are included in the accounting, as much as 30% of the human genome consists of genes that encode proteins. Several efforts are under way to categorize protein-coding genes by type of function (Fig. 9-25b).
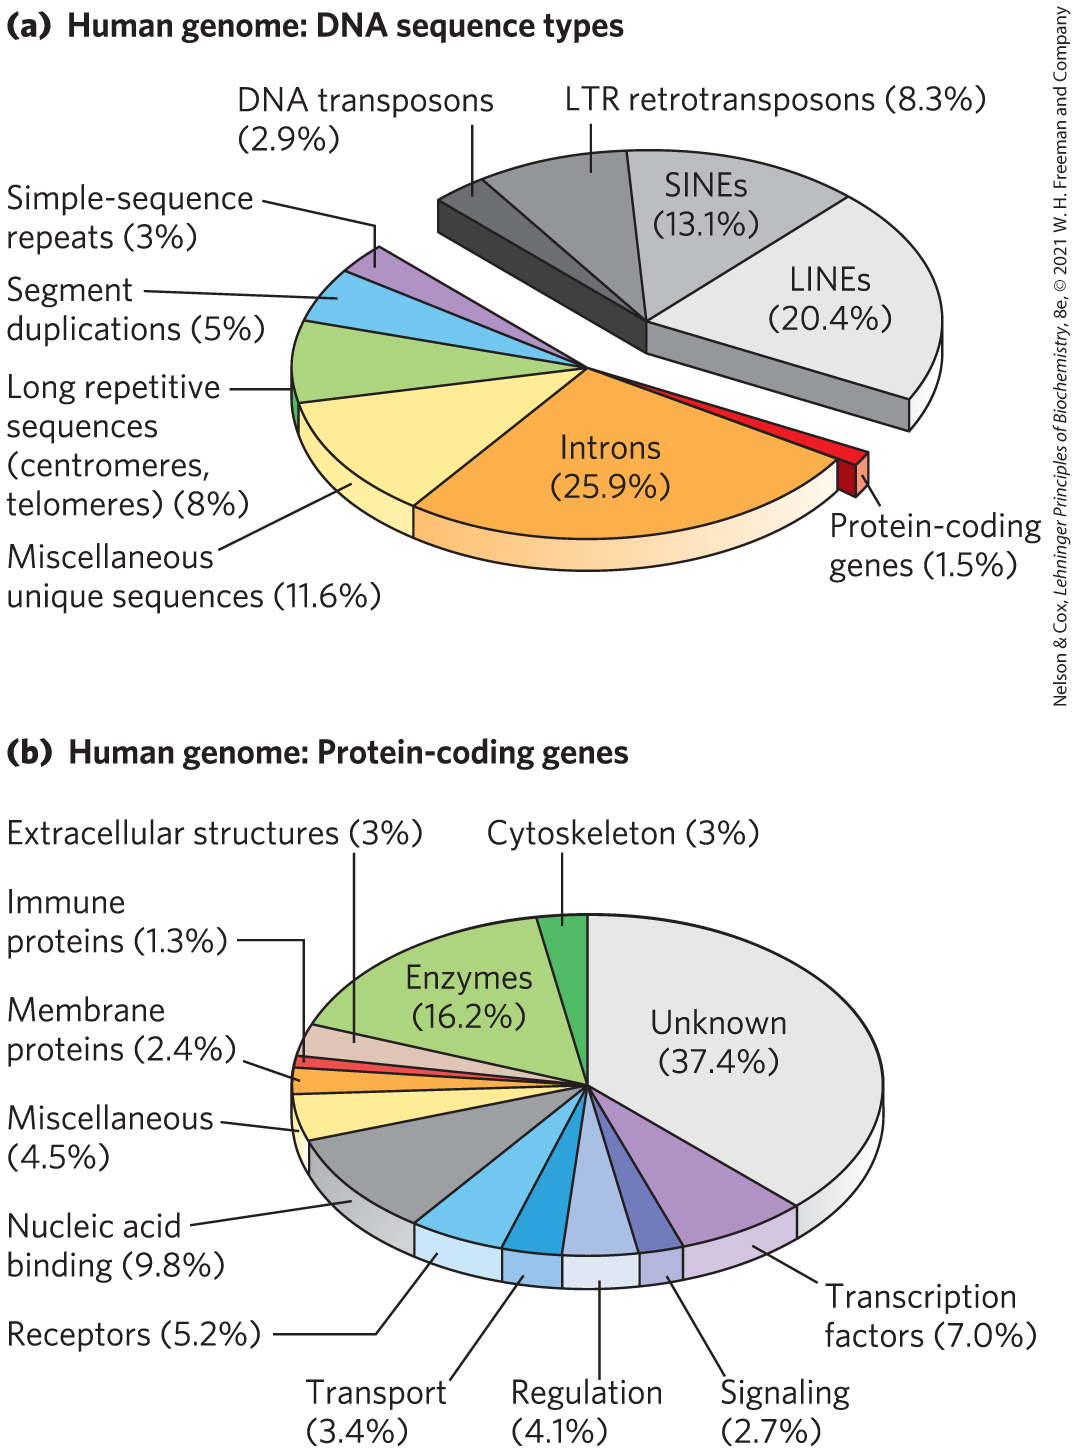
FIGURE 9-25 A snapshot of the human genome. (a) This pie chart shows the proportions of various types of sequences in our genome. The classes of transposons that represent nearly half of the total genomic DNA are indicated in shades of gray. LTR retrotransposons are retrotransposons with long terminal repeats (see Fig. 26-33). Long interspersed nuclear elements (LINEs) and short interspersed nuclear elements (SINEs) are special classes of particularly common DNA transposons. (b) The approximately 20,000 protein-coding genes in the human genome can be classified by the type of protein encoded. [Information from (a) T. R. Gregory, Nature Rev. Genet. 6:699, 2005; (b) www.pantherdb.org.]
The relative paucity of protein-coding genes in the human genome leaves a lot of DNA unaccounted for. Much of the DNA that does not encode proteins (exons or introns) is in the form of repeated sequences of several kinds. Perhaps most surprising is that about half the human genome is made up of moderately repeated sequences that are derived from transposons, segments of DNA, ranging from a few hundred to several thousand base pairs long, that can move from one location to another in the genome. Originally discovered in corn by Barbara McClintock, who called them transposable elements, transposons are a kind of molecular parasite. They make their home in the genomes of essentially every organism. Many transposons contain genes encoding the proteins that catalyze the transposition process itself, as described in more detail in Chapters 25 and 26. There are several classes of transposons in the human genome. Many are strictly DNA segments, which have slowly increased in number over the millennia as a result of replication events coupled to the transposition process. Some, called retrotransposons, are closely related to retroviruses, transposing from one genomic location to another through RNA intermediates that are reconverted to DNA by reverse transcription. Some transposons in the human genome are active elements, moving at a low frequency, but most are inactive, evolutionary relics altered by mutations. Transposon movement can lead to the redistribution of other genomic sequences, and this has played a major role in human evolution.
Once the protein-coding genes (including exons and introns) and transposons are accounted for, perhaps 25% of the total DNA remains. As a follow-up to the Human Genome Project, the ENCODE initiative was launched by the National Human Genome Research Institute in 2003 to identify functional elements in the human genome. The work of the worldwide consortium of research groups engaged in the ENCODE initiative has revealed that the vast majority (>80%, including protein-coding genes, most transposons, and more) of the DNA in the human genome is either transcribed into RNA in at least one type of cell or tissue or is involved in some functional aspect of chromatin structure. Much of the noncoding (nontranscribed) DNA in the remaining 20% contains regulatory elements that affect the expression of the 20,000 protein-coding genes and the many additional genes encoding functional RNAs. Many mutations (SNPs; described below) associated with human genetic diseases lie in this noncoding DNA, probably affecting regulation of one or more genes. As described in Chapters 26 and 27, new classes of functional RNAs are being discovered at a rapid pace. Many of these functional RNAs, now being identified by a variety of screening methods, are produced by RNA-coding genes whose existence was previously unsuspected.
 The work of the worldwide consortium of research groups engaged in the ENCODE initiative has revealed that the vast majority (>80%, including protein-coding genes, most transposons, and more) of the DNA in the human genome is either transcribed into RNA in at least one type of cell or tissue or is involved in some functional aspect of chromatin structure. Much of the noncoding (nontranscribed) DNA in the remaining 20% contains regulatory elements that affect the expression of the 20,000 protein-coding genes and the many additional genes encoding functional RNAs. Many mutations (SNPs; described below) associated with human genetic diseases lie in this noncoding DNA, probably affecting regulation of one or more genes. As described in
 About 3% or so of the human genome consists of highly repetitive sequences referred to as simple-sequence repeats (SSRs). Generally less than 10 bp long, an SSR is sometimes repeated millions of times per cell, distributed in short segments of tandem repeats. The most prominent examples of SSR DNA are found in centromeres and telomeres (see Chapter 24). Human telomeres, for example, consist of up to 2,000 contiguous repeats of the sequence GGTTAG. Additional, shorter repeats of simple sequences also occur throughout the genome. These isolated segments of repeated sequences, often containing up to a few dozen tandem repeats of a simple sequence, are called short tandem repeats (STRs). Such sequences are the targets of the technologies used in forensic DNA analysis (see Box 8-1).
What does all this information tell us about the similarities and differences among individual humans? Within the human population there are millions of single-base variations, called single nucleotide polymorphisms, or SNPs (pronounced “snips”). Each person differs from the next by, on average, 1 in every 1,000 bp. Many of these variations are in the form of SNPs, but the human population also has a wide range of larger deletions, insertions, and small rearrangements. From these often subtle genetic differences comes the human variety we are all aware of — such as differences in hair color, stature, foot size, eyesight, allergies to medication, and (to some unknown degree) behavior.
The process of genetic recombination during meiosis tends to mix and match these small genetic variations so that different combinations of genes are inherited (see Chapter 25). However, groups of SNPs and other genetic differences that are close together on a chromosome are rarely affected by recombination and are usually inherited together; such a grouping of multiple SNPs is known as a haplotype. Haplotypes provide convenient markers for certain human populations and for individuals within populations.
Defining a haplotype requires several steps. First, positions that contain SNPs in the human population are identified in genomic DNA samples from multiple individuals (Fig. 9-26a). Each SNP in a prospective haplotype may be separated from the next SNP by several thousand base pairs and still be regarded as “nearby” in the context of chromosomes that extend for millions of base pairs. Second, a set of SNPs typically inherited together is chosen as a defined haplotype (Fig. 9-26b); each haplotype consists of the particular bases found at the various SNP positions within the defined set. Finally, tag SNPs — a subset of SNPs that define an entire haplotype — are chosen to uniquely identify each haplotype (Fig. 9-26c). By sequencing just these tag positions in genomic samples from human populations, researchers can quickly identify which of the haplotypes are present in each individual. Especially stable haplotypes exist in the mitochondrial genome (which does not undergo meiotic recombination) and on the Y chromosome (only 3% of which is homologous to the X chromosome and thus subject to recombination). As we will see, haplotypes can be used as markers to trace human migrations.
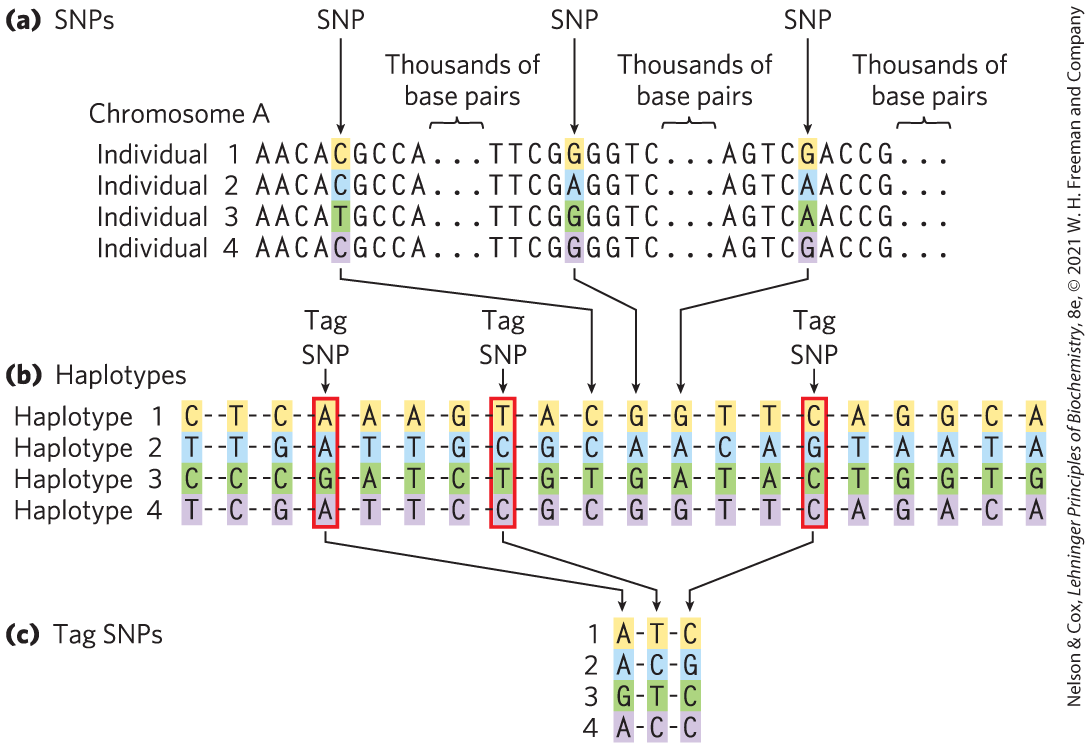
FIGURE 9-26 Haplotype identification. (a) The positions of SNPs in the human genome can be identified in genomic samples. The SNPs can be in any part of the genome, whether or not it is part of a known gene. (b) Groups of SNPs are compiled into a haplotype. The SNPs vary in the overall human population, as in the four fictitious individuals shown here, but the SNPs chosen to define a haplotype are often the same in most individuals of a particular population. (c) A few SNPs are chosen as haplotype-defining (tag SNPs, outlined in red), and these are used to simplify the process of identifying an individual’s haplotype (by sequencing 3 instead of 20 loci). (c) For example, if the positions shown here were sequenced, an A–T–C haplotype might be characteristic of a population native to one location in northern Europe, whereas G–T–C might be the prevailing sequence in a population in Asia. Multiple haplotypes of this kind are used to trace prehistoric human migrations. [Information from International HapMap Consortium, Nature 426:789, 2003, Fig. 1.]
Genome Sequencing Informs Us about Our Humanity
The human genome is very closely related to other mammalian genomes over large segments of every chromosome. However, for a genome measured in billions of base pairs, differences of just a few percent can add up to millions of genetic distinctions. Searching among these, and making use of comparative genomics techniques, researchers can begin to explore the molecular basis of definably human characteristics.
The genome sequences of our closest biological relatives, the chimpanzee (Pan troglodytes) and bonobo (Pan paniscus), offer some important clues, and we can use them to illustrate the comparative process. Human and chimpanzee shared a common ancestor about 7 million years ago. Genomic differences between the species, including SNPs and larger genomic rearrangements such as inversions, deletions, and fusions, can be used to construct a phylogenetic tree (Fig. 9-27a). Over the course of evolution, segments of chromosomes may become inverted as a result of a segmental duplication, transposition of one copy to another arm of the same chromosome, and recombination between them (Fig. 9-27b); such inversions have occurred in the human lineage on chromosomes 1, 12, 15, 16, and 18. Two chromosomes found in other primate lineages have been fused to form human chromosome 2 (Fig. 9-27c). The human lineage thus has 23 chromosome pairs rather than the 24 pairs typical of simians. Once this fusion appeared in the line leading to humans, it would have represented a major barrier to interbreeding with other primates that lacked it.
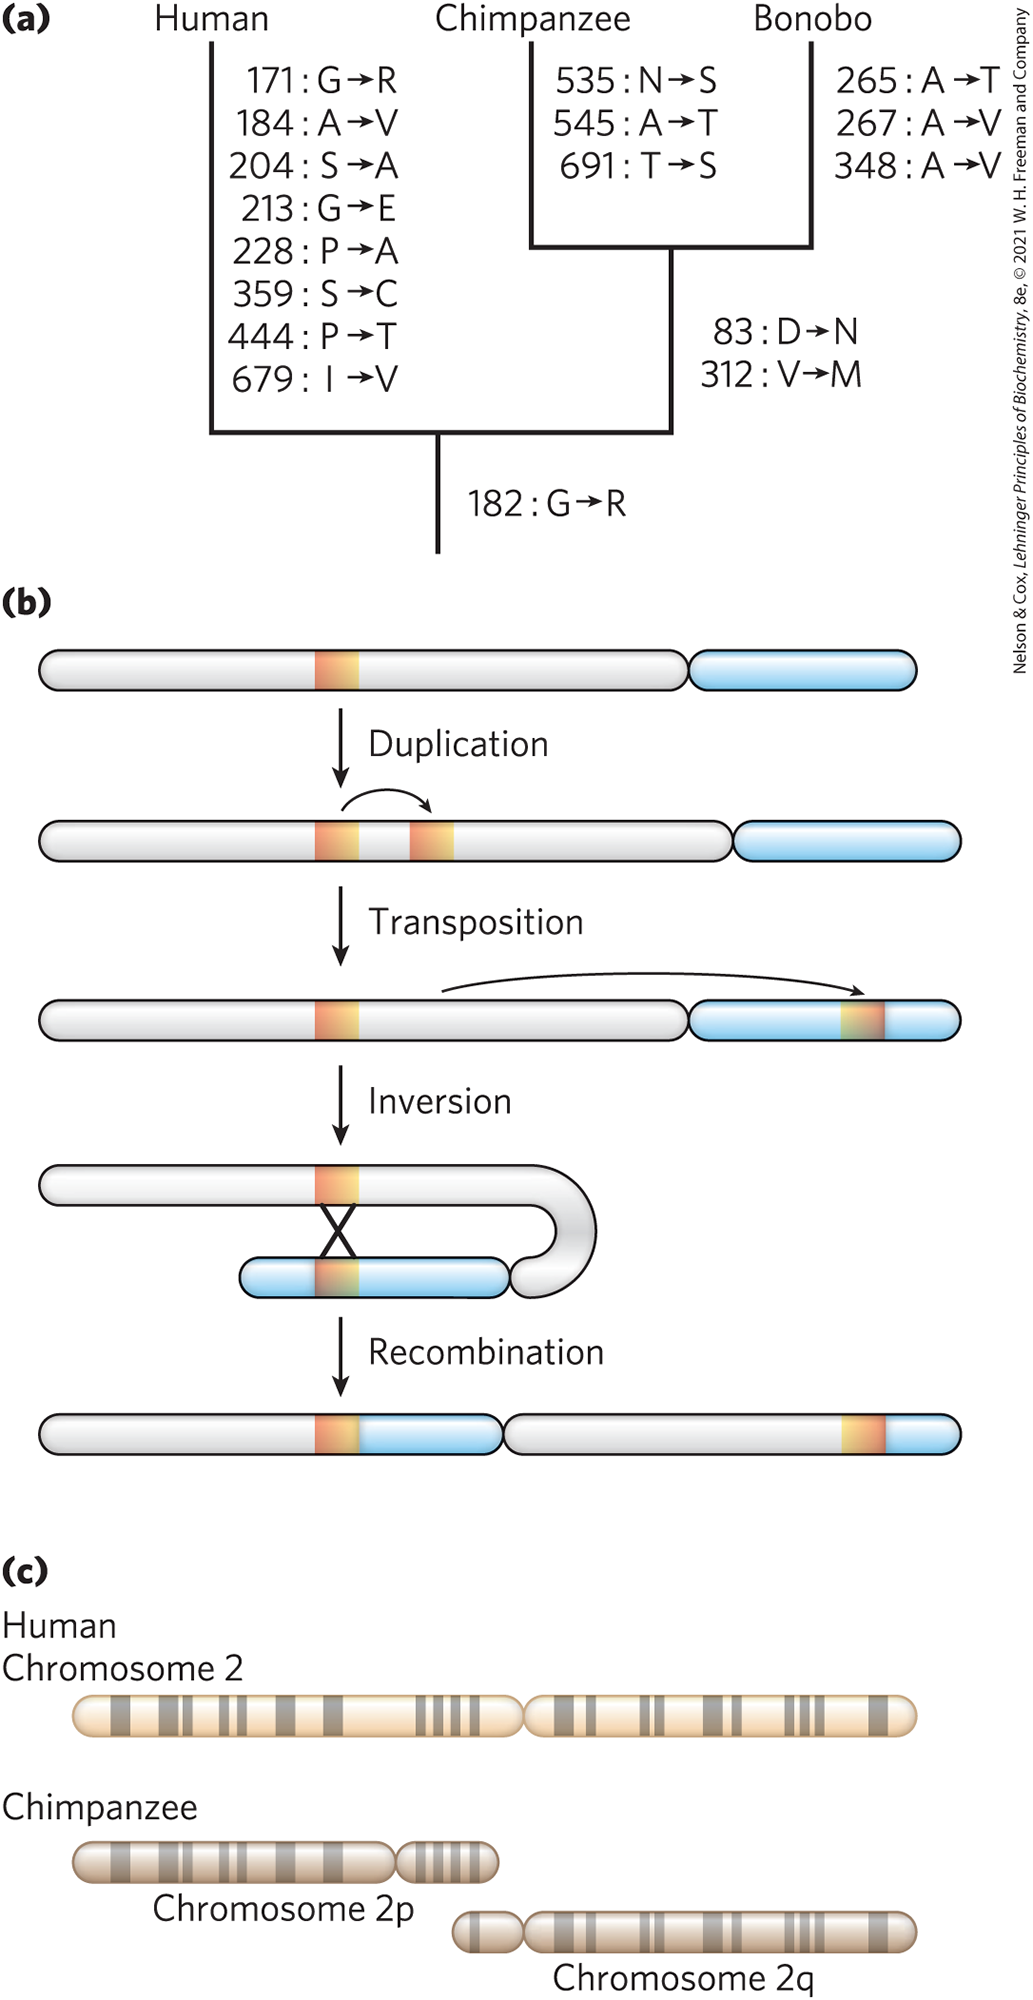
FIGURE 9-27 Genomic alterations in the human lineage. (a) This evolutionary tree is for the progesterone receptor, which helps regulate many events in reproduction. The gene encoding this protein has undergone more evolutionary alterations than most. Amino acid changes associated uniquely with human, chimpanzee, and bonobo are listed beside each branch (with the residue number). (b) One of the multistep processes that can lead to the inversion of a chromosome segment. A gene or a chromosome segment is duplicated, then moved to another chromosomal location by transposition. Recombination of the two segments may result in inversion of the DNA between them. (c) The genes on chimpanzee chromosomes 2p and 2q are homologous to those on human chromosome 2, implying that two chromosomes fused at some point in the line leading to humans. Homologous regions can be visualized as bands created in metaphase by certain dyes, as shown here. [(a) Information from C. Chen, Mol. Phylogenet. Evol. 47:637, 2008.]
If we look only at base-pair changes, the published human and chimpanzee genomes differ by only 1.23% (compared with the 0.1% variance from one human to another). Some variations are at positions where there is a known polymorphism in either the human population or the chimpanzee population, and these are unlikely to reflect a species-defining evolutionary change. When we ignore these positions, the differences amount to about 1.06%, or about 1 in 100 bp. This small fraction translates into more than 30 million base-pair differences, some of which affect protein function and gene regulation. Humans are approximately as closely related to bonobos as to chimpanzees.
The genomic rearrangements that help distinguish chimpanzee and human include 5 million short insertions or deletions involving a few base pairs each, as well as a substantial number of larger insertions, deletions, inversions, and duplications that can involve many thousands of base pairs. When transposon insertions — a major source of genomic variation — are added to the list, the differences between the human and chimpanzee genomes increase. The chimpanzee genome has two classes of retrotransposons that are not present in the human genome (see Chapter 26). Other types of rearrangements, especially segmental duplications, are also common in primate lineages. Duplications of chromosomal segments can lead to changes in the expression of genes contained in these segments. There are about 90 million bp of such differences between human and chimpanzee, representing another 3% of these genomes. Each species has segments of DNA, constituting 40 million to 45 million bp, that are entirely unique to that particular genome, with larger chromosomal insertions, duplications, and other rearrangements affecting more base pairs than do single-nucleotide changes. Thus, in all, chimpanzee and human differ over about 4% of their genomes.
Sorting out which genomic distinctions are relevant to features that are uniquely human is a daunting task. If one assumes a similar rate of evolution in the chimpanzee and human lines after they diverged from their common ancestor, half the changes represent chimpanzee lineage changes and half represent human lineage changes. By comparing both genome sequences with those of more distantly related species referred to as outgroups, we can determine which variant was present in the common ancestor. Consider a locus, X, where there is a difference between the human and chimpanzee genomes (Fig. 9-28a). The lineage of the orangutan, an outgroup, diverged from that of chimpanzee and human prior to the common ancestor of chimpanzee and human (Fig. 9-28b). If the sequence at locus X is identical in orangutan and chimpanzee, this sequence was probably present in the chimpanzee and human ancestor, and the sequence seen in humans is specific to the human lineage. Sequences that are identical in human and orangutan can be eliminated as candidates for human-specific genomic features. The importance of comparisons with closely related outgroups has given rise to new efforts to sequence the genomes of orangutan, macaque, and many other primate species. Comparison of the human and bonobo genomes is refining the analysis of genes and alleles of special significance to humans.
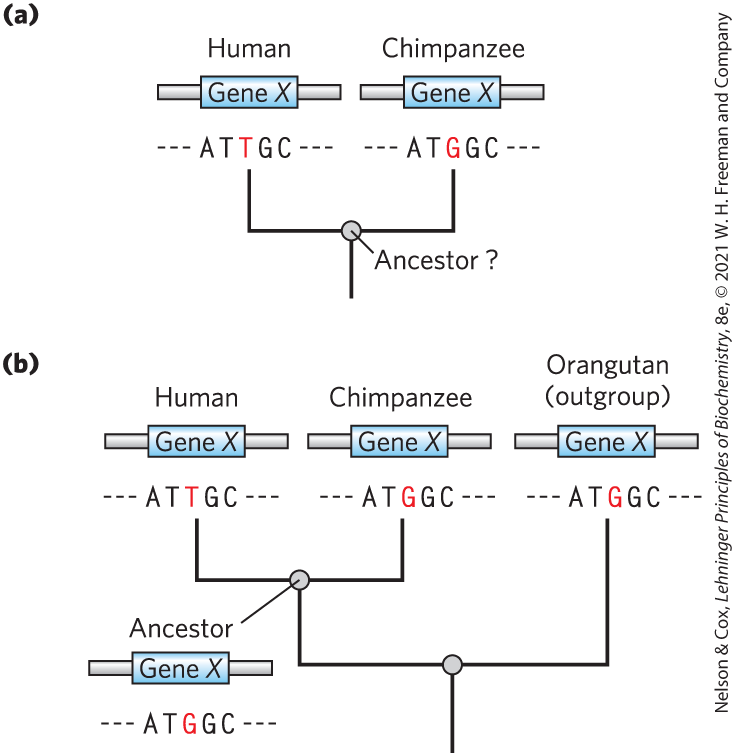
FIGURE 9-28 Determination of sequence alterations unique to one ancestral line. (a) Sequences from the same hypothetical gene in human and chimpanzee are compared. The sequence of this gene in the two species’ last common ancestor is unknown. (b) The orangutan genome is used as an outgroup. Because the sequence of the orangutan gene is identical to that of the chimpanzee gene, the mutation causing the difference between human and chimpanzee almost certainly occurred in the line leading to modern humans, and the common ancestor of human and chimpanzee (and orangutan) had the variant now found in chimpanzees.
The search for the genetic underpinnings of special human characteristics, such as our enhanced brain function, can benefit from two complementary approaches. The first approach searches for genomic regions where extreme changes have occurred, such as genes that have been duplicated many times or large genomic segments not present in other primates. The second approach looks at genes known to be involved in relevant human disease conditions. For brain function, for example, one would examine genes that, when mutated, contribute to cognitive or mental disorders.
Notably, analyses of the human lineage have not detected an increased rate of genetic change in protein-coding genes involved in brain development or size. In primates, most genes that function uniquely in the brain are even more highly conserved than genes functioning in other tissues, perhaps due to some special constraints related to brain biochemistry. However, there are some differences in gene expression patterns between humans and other primates that may affect brain function. For example, the gene encoding the enzyme glutamate dehydrogenase, which plays an important role in neurotransmitter synthesis, has been subjected to gene duplication events, so that there are now multiple copies of it. Genomic regions related to gene regulation have disproportionately high numbers of changes in genes involved in neural development and nutrition. Our brains have become larger as a result, and additional functional effects may eventually be defined. A variety of RNA-coding genes, some with expression concentrated in the brain, also show evidence of accelerated evolution (Fig. 9-29). Many of these are probably involved in regulating the expression of other genes. As we continue to discover many new classes of RNA (see Chapter 26), we are likely to radically change our perspective on how evolution alters the workings of living systems.
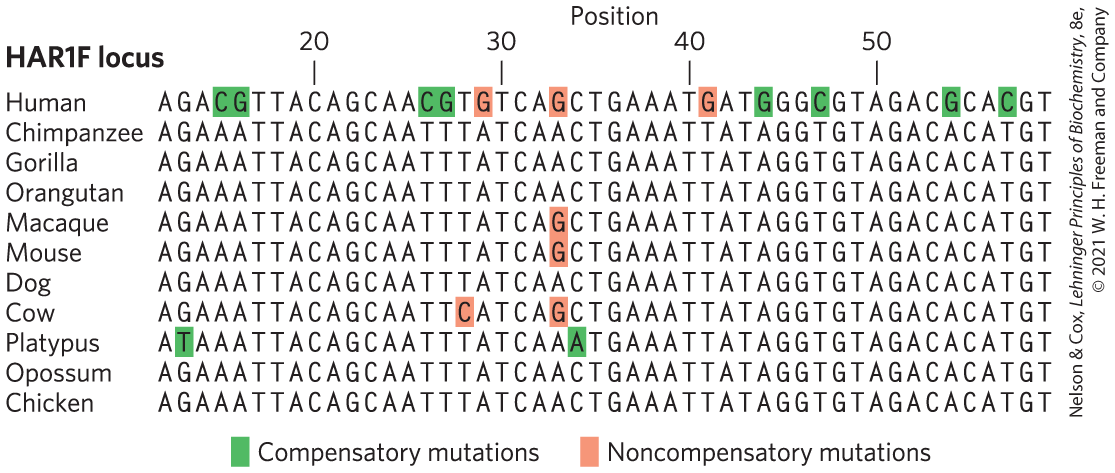
FIGURE 9-29 Accelerated evolution in some human genes. The HAR1F locus specifies a noncoding RNA that is highly conserved in vertebrates. The human HAR1F gene has an unusual number of substitutions (highlighted by color shading), providing evidence of accelerated evolution. HAR1F RNA functions in the brain during neurodevelopment. Compensatory substitutions are those that retain complementarity where strand segments are paired. [Information from T. Marques-Bonet, Annu. Rev. Genomics Hum. Genet. 10:355, 2009.]
Genome Comparisons Help Locate Genes Involved in Disease
One of the motivations for the Human Genome Project was its potential for accelerating the discovery of genes underlying genetic diseases. That promise has been fulfilled: more than 6,000 human mutation phenotypes, mostly associated with genetic diseases, have been mapped to particular genes or groups of genes.
 One of the motivations for the Human Genome Project was its potential for accelerating the discovery of genes underlying genetic diseases. That promise has been fulfilled:
 For the last two decades, the main approach to gene mapping has been linkage analysis, yet another approach derived from evolutionary biology. In brief, the gene involved in a disease condition is mapped relative to well-characterized genetic polymorphisms that occur throughout the human genome. We can illustrate this approach by describing the search for one gene involved in early-onset Alzheimer disease.
About 10% of all cases of Alzheimer disease in the United States result from an inherited predisposition. Several different genes have been discovered that, when mutated, can lead to early onset of the disease. One such gene, PS1, encodes the protein presenilin-1, and its discovery made heavy use of linkage analysis. The search begins with large families having multiple individuals affected by a particular disease — in this case, Alzheimer disease. Two of the many family pedigrees used to search for this gene in the early 1990s are shown in Figure 9-30a. In studies of this type, DNA samples are collected from both affected and unaffected family members. Researchers first localize the region associated with a disease to a specific chromosome by comparing the genotypes of individuals with and without the disease, focusing especially on close family members. The specific points of comparison are sets of well-characterized SNP loci mapped to each chromosome, as identified by the Human Genome Project. By identifying the SNPs that are most often inherited with the disease-causing gene, investigators can gradually localize the responsible gene to a single chromosome. In the case of the PS1 gene, co-inheritance was strongest with markers on chromosome 14 (Fig. 9-30b).
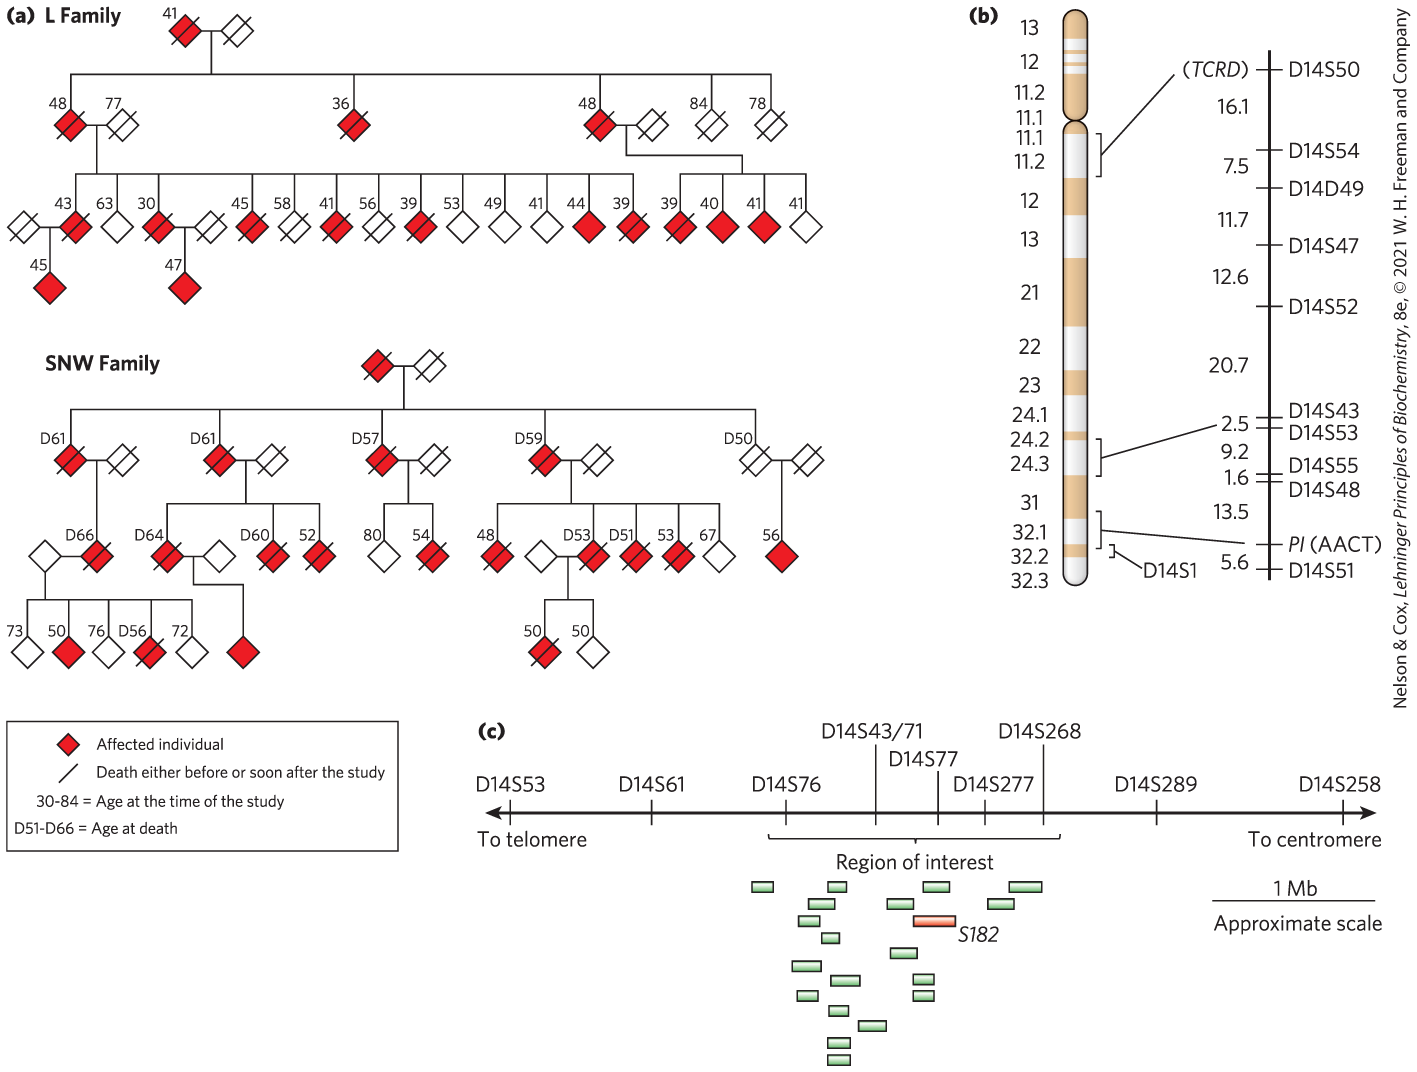
FIGURE 9-30 Linkage analysis in the discovery of disease genes. (a) These pedigrees for two families affected by early-onset Alzheimer disease are based on the data available at the time of the study. To protect family privacy, gender is not indicated. (b) Chromosome 14, with bands created by certain dyes. Chromosome marker positions are shown at the right, with the genetic distance between them in centimorgans, a genetic distance measurement that reflects the frequency of recombination between markers. TCRD (T-cell receptor delta) and PI (AACT (α1-antichymotrypsin)), two genes with alterations in the human population, were used along with SNPs as markers in chromosome mapping. (c) By comparing DNA from affected and unaffected family members, researchers eventually defined a region of interest near marker D14S43 that contains 19 expressed genes. The gene labeled S182 (red) encodes presenilin-1. ( base pairs.) [Information from (a, b) G. D. Schellenberg et al., Science 258:668, 1992; (c) R. Sherrington et al., Nature 375:754, 1995.]
Chromosomes are very large DNA molecules, and localizing the gene to one chromosome is only a small part of the battle. Localizing the gene to one chromosome (in this case, chromosome 14) is only the beginning of narrowing the search for a gene. Chromosomes are very large molecules; each one houses thousands of SNPs and other changes. Simply sequencing the entire chromosome would be unlikely to reveal the SNP or other change associated with the disease. Instead, investigators rely on statistical methods that correlate the inheritance of additional, more closely spaced polymorphisms with the occurrence of the disease, focusing on a denser panel of polymorphisms known to occur on the chromosome of interest. The more closely a marker is located to a disease gene, the more likely it is to be inherited along with that gene. This process can pinpoint a region of the chromosome that contains the gene. However, the region may still encompass many genes. In our example, linkage analysis indicated that the disease-causing gene, PS1, was somewhere near the SNP locus D14S43 (Fig. 9-30c).
The final steps in identifying the gene use the human genome databases. The local region containing the gene is examined, and the genes within it are identified. DNA from many individuals, some who have the disease and some who do not, is sequenced over this region. As the DNA in this region is sequenced from increasing numbers of individuals, gene variants that are consistently present in individuals with the disease and absent in unaffected individuals can be identified. An understanding of the function of the genes in the target region can aid the search, because particular metabolic pathways may be more likely than others to produce the disease state. In 1995, the chromosome 14 gene associated with Alzheimer disease was identified as S182. The product of this gene was given the name presenilin-1, and the gene was subsequently renamed PS1.
Many human genetic diseases are caused by mutations in a single gene or in sequences involved in regulation of that gene. Several different mutations in a particular gene, all leading to the same or related genetic condition, may be present in the human population. For example, there are several variants of PS1, all giving rise to a much-increased risk of early-onset Alzheimer disease. Another, more extreme example is the several genes encoding different hemoglobins: more than 1,000 known mutational variants are present in the human population. Some of these variants are innocuous; some cause diseases ranging from sickle cell disease to thalassaemias. The inheritance of particular mutant genes may be concentrated in families or in isolated populations.
More complex are cases in which a disease condition is caused by mutations in two different genes (neither of which, alone, causes the disease), or in which a particular condition is enhanced by an otherwise innocuous mutation in another gene. Identifying the genes and mutations responsible for these digenic diseases is exceedingly difficult, and sometimes such diseases can be documented only within small, isolated, and highly inbred populations.
Genome databases provide alternative paths to the identification of disease genes. In many cases, we already have biochemical information about the disease. In the case of early-onset Alzheimer disease, an accumulation of the amyloid-β protein in limbic and association cortices of the brain is at least partly responsible for the symptoms. Defects in presenilin-1 (and in a related protein, presenilin-2, encoded by a gene on chromosome 1) lead to the elevated cortical levels of amyloid-β protein. Focused databases are being developed that catalog such functional information on the protein products of genes and on protein-interaction networks and SNP locations, along with other data. The result is a streamlined path to the identification of candidate genes for a particular disease. If a researcher knows a little about the kinds of enzymes or other proteins likely to contribute to disease symptoms, these databases can quickly generate a list of genes known to encode proteins with relevant functions, a list of additional uncharacterized genes with orthologous or paralogous relationships to these genes, a list of proteins known to interact with the target proteins or orthologs in other organisms, and a map of gene positions. Often, with the aid of data from some selected family pedigrees, a short list of potentially relevant genes can be rapidly determined.
These approaches are not limited to human diseases. The same methods can be used to identify the genes involved in diseases — or genes that produce desirable characteristics — in other animals and in plants. Of course, they can also be used to track down genes involved in any observable trait that a researcher might be interested in.

Genome Sequences Inform Us about Our Past and Provide Opportunities for the Future
Anatomically modern humans arose in Africa between 250,000 and 350,000 years ago. About 100,000 to 120,000 years ago, humans in Africa looked out across the Red Sea to Asia. Perhaps encouraged by some innovation in small boat construction, or driven by conflict or famine, or simply curious, they crossed the water barrier. That initial colonization began a journey that did not stop until humans reached Tierra del Fuego (at the southern tip of South America), many thousands of years later. As Homo sapiens populations moved into more northern parts of Europe and Asia about 45,000 years ago, established populations from previous hominid expansions into Eurasia, including Homo neanderthalensis and a group now called the Denisovans, were displaced. The Neanderthals and Denisovans disappeared, just as other hominid lines had disappeared before them.
The story of how modern humans first appeared in Africa a few hundred thousand years ago, and their migrations as they eventually radiated out of Africa, is written in our DNA. Genomic sequences from multiple species have brought both primate and hominid evolution into sharper focus. Using haplotypes present in extant human populations, we can trace the migrations of our intrepid ancestors across the planet (Fig. 9-31a). The Neanderthals were not simply displaced. Some mingling occurred (Fig. 9-31b). Using sensitive PCR-based methods, we now possess multiple complete sequences of the Neanderthal genome (Box 9-2). We know that up to 5% of the genome of most non-African humans is derived from Neanderthals. Anatomically modern human remains up to 45,000 years old have been sequenced, beginning an effort to pinpoint the period of interbreeding. Human populations native to Melanesia and Australia acquired up to 6% of their genomic DNA from the Denisovans. Neanderthal DNA gave humans a more complex immune system, making us more resistant to infection but also a little more susceptible to autoimmune diseases. The story of our past is gradually taking shape as more genomes, of humans alive today and those who lived in past millennia, are being assembled.
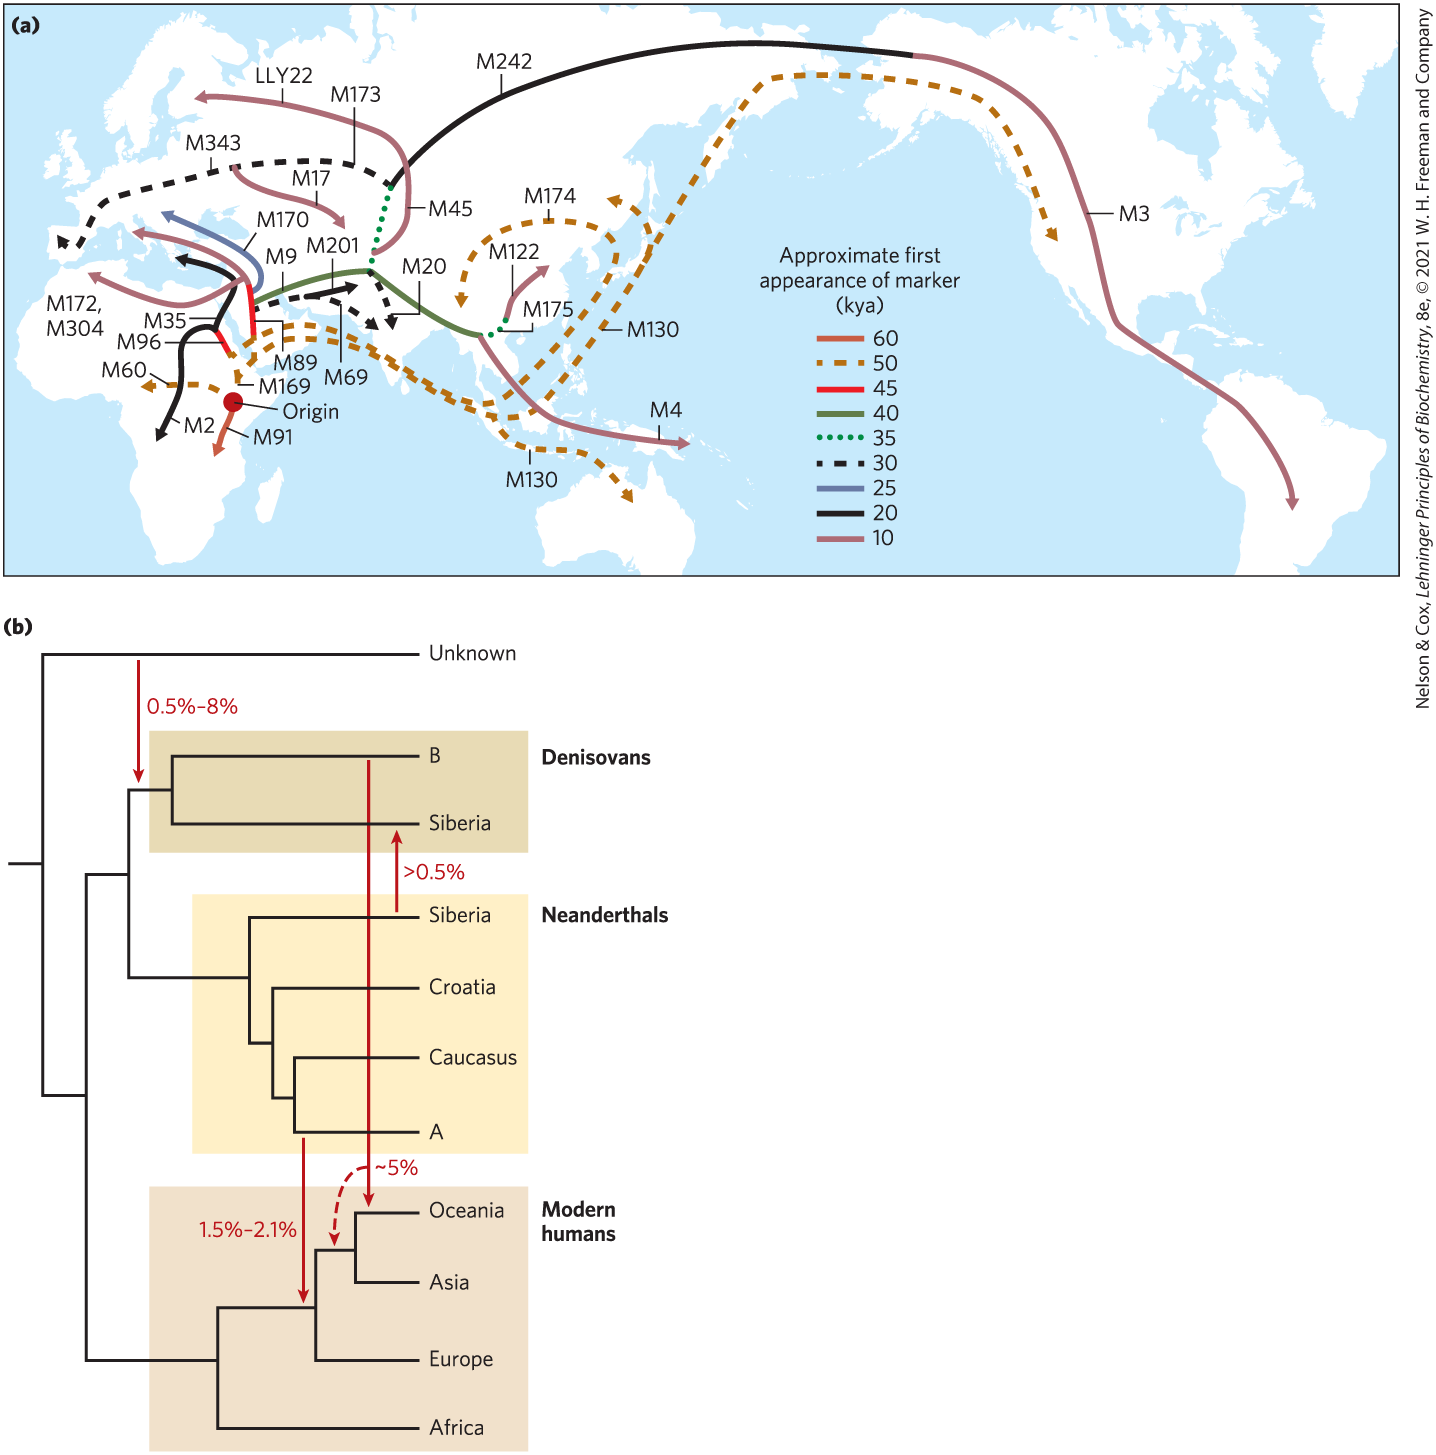
FIGURE 9-31 The paths of human migrations. (a) When a small part of a human population migrates away from a larger group, it takes only part of the population’s overall genetic diversity with it. Thus, some haplotypes are present in the migrating group but many are not. At the same time, mutations can create novel haplotypes over time. This map was generated from an analysis of genetic markers (defined haplotypes with M or LLY numbers) on the Y chromosome. The genetic samples were taken from indigenous populations long established at geographic points along the routes shown. The abbreviation kya means “thousand years ago.” (b) Human migrations eventually displaced several closely related hominid groups, but not before some intermingling occurred. This tree illustrates gene-flow events documented from detailed genomic sequences of modern and ancient humans, as well as of Neanderthals and Denisovans. DNA from an unknown group of Neanderthals (A) is recorded in the genomes of all humans with some Eurasian heritage. A transfer of DNA from an unknown ancestor to the Denisovan line (B) contributed to ancestors of present-day individuals native to Australia and Pacific islands (Oceania). [Information from (a) G. Stix, Sci. Am. 299 (July):56, 2008; (b) S. Pääbo, Cell 157:216, 2014.]
The medical promise of personal genomic sequences grows as sequencing costs continue to decline and more genes underlying inherited diseases are defined. Knowledge of genomic sequences also provides the prospect of altering them. It is now commonplace to engineer the DNA sequences of organisms ranging from bacteria and yeast to plants and mammals, for research and commercial purposes. Efforts to cure inherited human diseases by human gene therapy have not yet lived up to their potential, but technologies for gene delivery are constantly being improved. Few scientific disciplines will affect the future of our species more than modern genomics.
 Knowledge of genomic sequences also provides the prospect of altering them. It is now commonplace to engineer the DNA sequences of organisms ranging from bacteria and yeast to plants and mammals, for research and commercial purposes. Efforts to cure inherited human diseases by human gene therapy have not yet lived up to their potential, but technologies for gene delivery are constantly being improved. Few scientific disciplines will affect the future of our species more than modern genomics.
SUMMARY 9.3 Genomics and the Human Story
- About 30% of the DNA in the human genome is in the exons and introns of genes that encode proteins. Nearly half of the DNA is derived from parasitic transposons. Much of the rest encodes RNAs of many types. Simple-sequence repeats make up the centromere and telomeres.
- The gene alterations that define humanity can be discerned in part through comparative genomics, using other primates.
- Comparative genomics is also used to locate the gene alterations that define inherited diseases.
- Human genomics can be used to study the evolution and migration of our human ancestors over many millennia.
 About 30% of the DNA in the human genome is in the exons and introns of genes that encode proteins. Nearly half of the DNA is derived from parasitic transposons. Much of the rest encodes RNAs of many types. Simple-sequence repeats make up the centromere and telomeres.