3.4 The Structure of Proteins: Primary Structure
Purification of a protein is usually only a prelude to a detailed biochemical dissection of its structure and function. What is it that makes one protein an enzyme, another a hormone, another a structural protein, and still another an antibody? How do they differ chemically? The most obvious distinctions are structural, and to protein structure we now turn.
We can describe the structure of large molecules such as proteins at several levels of complexity, arranged in a kind of conceptual hierarchy. Four levels of protein structure are commonly defined (Fig. 3-23). A description of all covalent bonds (mainly peptide bonds and disulfide bonds) linking amino acid residues in a polypeptide chain is its primary structure. The most important element of primary structure is the sequence of amino acid residues. Secondary structure refers to particularly stable arrangements of amino acid residues giving rise to recurring structural patterns. Tertiary structure describes all aspects of the three-dimensional folding of a polypeptide. When a protein has two or more polypeptide subunits, their arrangement in space is referred to as quaternary structure. Our exploration of proteins will eventually include complex protein machines consisting of dozens to thousands of subunits. Primary structure is the focus of the remainder of this chapter; we discuss the higher levels of structure in Chapter 4.
 A description of all covalent bonds (mainly peptide bonds and disulfide bonds) linking amino acid residues in a polypeptide chain is its
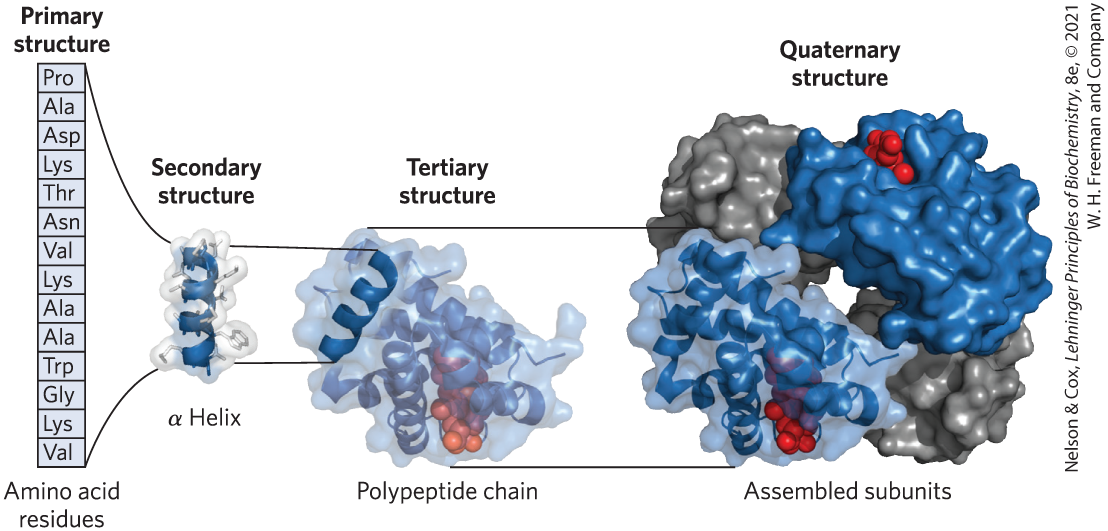
FIGURE 3-23 Levels of structure in proteins. The primary structure consists of a sequence of amino acids linked together by peptide bonds, and it includes any disulfide bonds. The resulting polypeptide can be arranged into units of secondary structure, such as an α helix. The helix is a part of the tertiary structure of the folded polypeptide, which is itself one of the subunits that make up the quaternary structure of the multisubunit protein, in this case hemoglobin. [Data from PDB ID 1HGA, R. Liddington et al., J. Mol. Biol. 228:551, 1992.]
Primary structure now becomes our focus. We first consider empirical clues that amino acid sequence and protein function are closely linked, then describe how amino acid sequence is determined; finally, we outline the many uses to which this information can be put.
The Function of a Protein Depends on Its Amino Acid Sequence
The bacterium Escherichia coli produces more than 3,000 different proteins; a human has ~20,000 genes that may produce over a million different proteins (through genetic processes discussed in Part III of this text). In both species, each type of protein has a unique amino acid sequence that confers a particular three-dimensional structure. This structure in turn confers a unique function.
Amino acid sequences are important elements of the broader realm of biological information. They are a major functional expression of information stored in DNA in the form of genes. The sequences are not at all random. Each protein has a distinctive number and sequence of amino acid residues. As we shall see in Chapter 4, the primary structure of a protein determines how it folds up into its unique three-dimensional structure, and this in turn determines the function of the protein.
 the primary structure of a protein determines how it folds up into its unique three-dimensional structure, and this in turn determines the function of the protein.
Some simple observations illustrate the functional importance of primary structure, or the amino acid sequence of a protein. First, as we have already noted, proteins with different functions always have different amino acid sequences. Second, thousands of human genetic diseases have been traced to the production of proteins with less activity or altered activity. The alteration can range from a single change in the amino acid sequence (as in sickle cell disease, described in Chapter 5) to deletion of a larger portion of the polypeptide chain (as in most cases of Duchenne muscular dystrophy: a large deletion in the gene encoding the protein dystrophin leads to production of a shortened, inactive protein). Finally, on comparing functionally similar proteins from different species, we find that these proteins often have similar amino acid sequences. Thus, a close link between protein primary structure and function is evident.
The amino acid sequence for a particular protein is not absolutely fixed, or invariant. Virtually all of the proteins in humans are polymorphic, having amino acid sequence variants in the human population. Many human proteins are polymorphic even within an individual, with amino acid variations occurring due to processes that will be described in Part III of this text. Some of these variations have little or no effect on the function of the protein; others may affect function dramatically. Furthermore, proteins that carry out a broadly similar function in distantly related species can differ greatly in overall size and amino acid sequence.
Although the amino acid sequence in some regions of the primary structure might vary considerably without affecting biological function, most proteins contain crucial regions that are essential to their function and thus have sequences that are conserved. The fraction of the overall sequence that is critical varies from protein to protein, complicating the task of relating sequence to three-dimensional structure, and structure to function. Before we can consider this problem further, however, we must examine how sequence information is obtained.
In 1953, Frederick Sanger worked out the sequence of amino acid residues in the polypeptide chains of the hormone insulin (Fig. 3-24), surprising many researchers who had long thought that determining the amino acid sequence of a polypeptide would be a hopelessly difficult task. The elucidation of DNA structure in that same year by Watson and Crick telegraphed a likely relationship between DNA and protein sequences. Barely a decade after these discoveries, the genetic code relating the nucleotide sequence of DNA to the amino acid sequence of protein molecules was elucidated (Chapter 27).
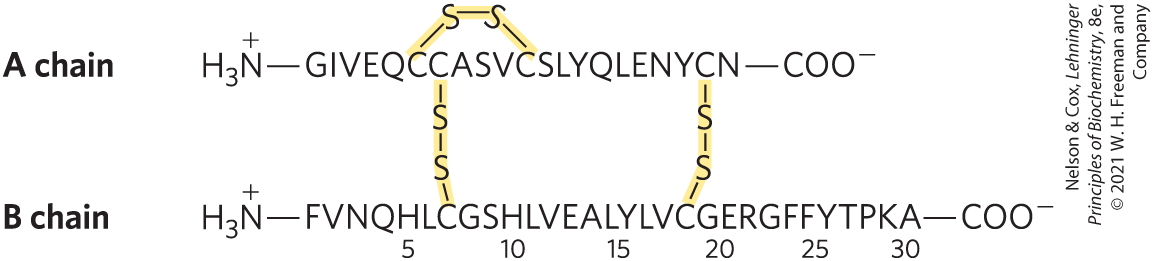
FIGURE 3-24 Amino acid sequence of bovine insulin. The two polypeptide chains are joined by disulfide cross-linkages (yellow). The A chain of insulin is identical in human, pig, dog, rabbit, and sperm whale insulins. The B chains of the cow, pig, dog, goat, and horse are identical.
The amino acid sequences of proteins are now most often derived indirectly from the DNA sequences in genome databases. However, an array of techniques derived from traditional methods of polypeptide sequencing made important contributions to the broader field of protein chemistry. The method used by Sanger to sequence insulin is based on the classical method for direct chemical sequencing of proteins from the amino terminus, the two-step Edman degradation developed by Pehr Edman.
Protein Structure Is Studied Using Methods That Exploit Protein Chemistry
The sequence of a protein can be predicted from the sequence of the gene encoding it, which is usually available in genomic databases. Direct sequencing can also be provided by mass spectrometry. Many methods used in traditional protein sequencing protocols remain valuable for labeling proteins or breaking them into parts for functional and structural analysis.
For example, the amino-terminal α-amino group of a protein can be labeled with 1-fluoro-2,4-dinitrobenzene (FDNB), dansyl chloride, or dabsyl chloride (Fig. 3-25). These reagents also label the ε-amino group of lysine residues. Disulfide bonds within a polypeptide or between polypeptide subunits can be broken irreversibly (Fig. 3-26).
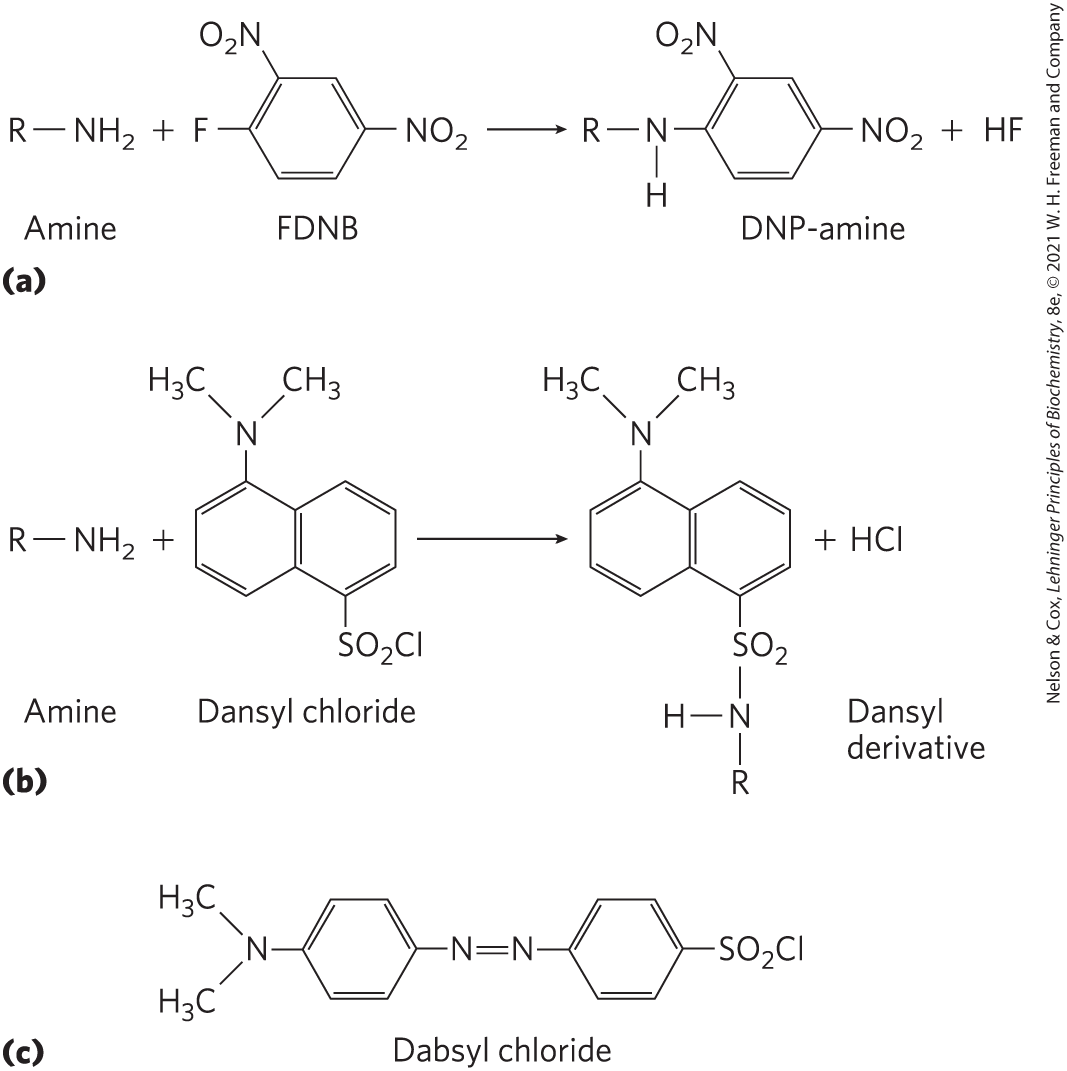
FIGURE 3-25 Modification of the α-amino group at the amino terminus. The reaction is a nucleophilic displacement of the halide ion as shown for (a) FDNB and (b) dansyl chloride. The ε-amino group of lysine will also be labeled. Dansyl chloride and (c) dabsyl chloride, another labeling reagent, have useful absorbance and/or fluorescent properties at visible wavelengths.
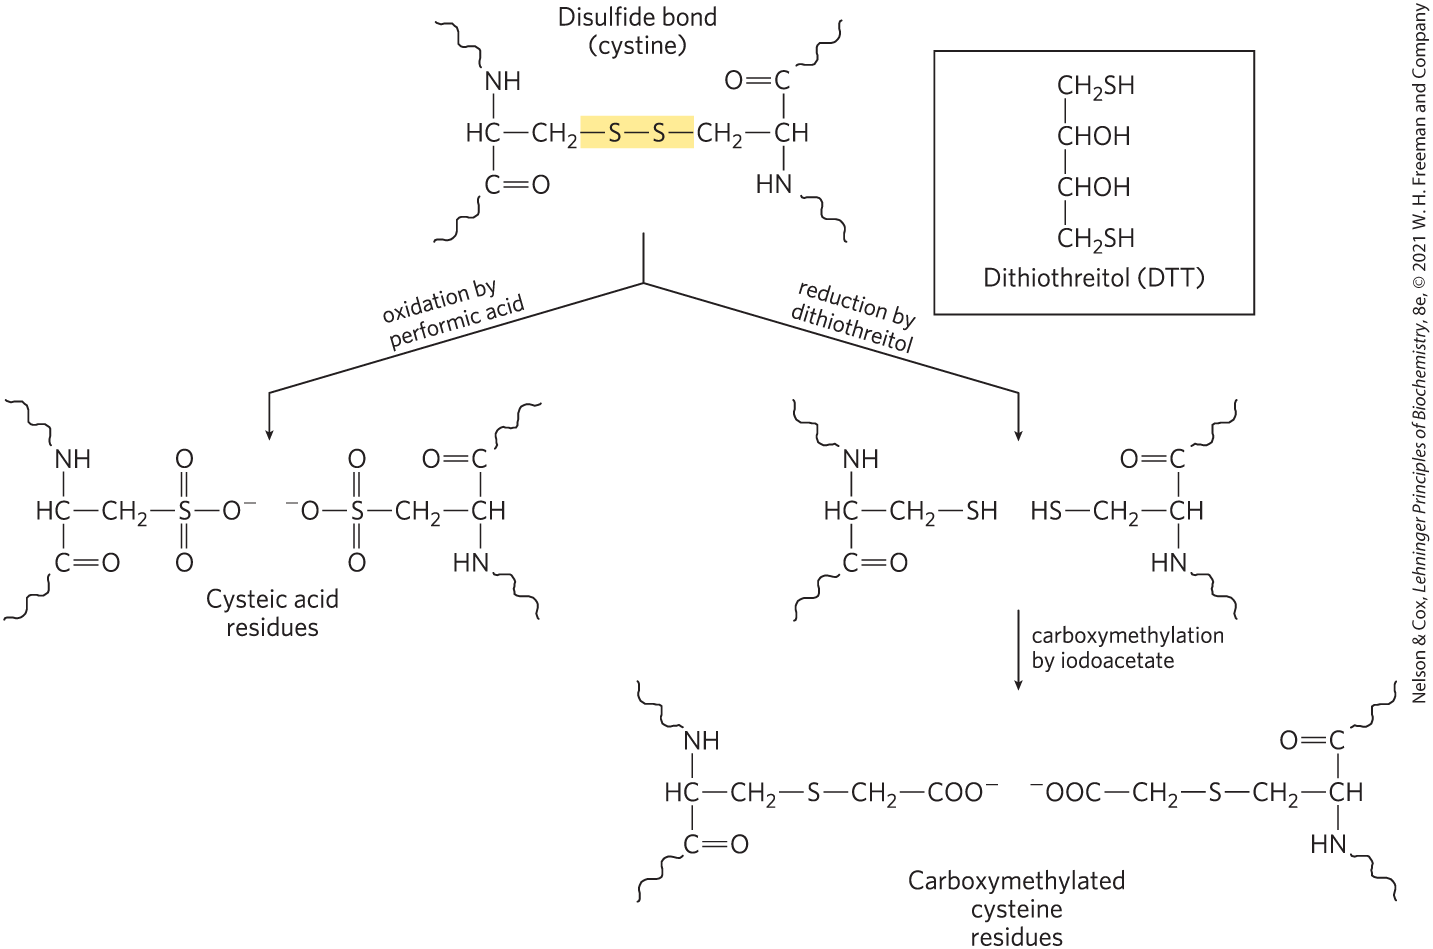
FIGURE 3-26 Breaking disulfide bonds in proteins. Two common methods are illustrated. Oxidation of a cystine residue with performic acid produces two cysteic acid residues. Reduction by dithiothreitol (or β-mercaptoethanol) to form Cys residues must be followed by further modification of the reactive —SH groups to prevent re-formation of the disulfide bond. Carboxymethylation by iodoacetate serves this purpose.
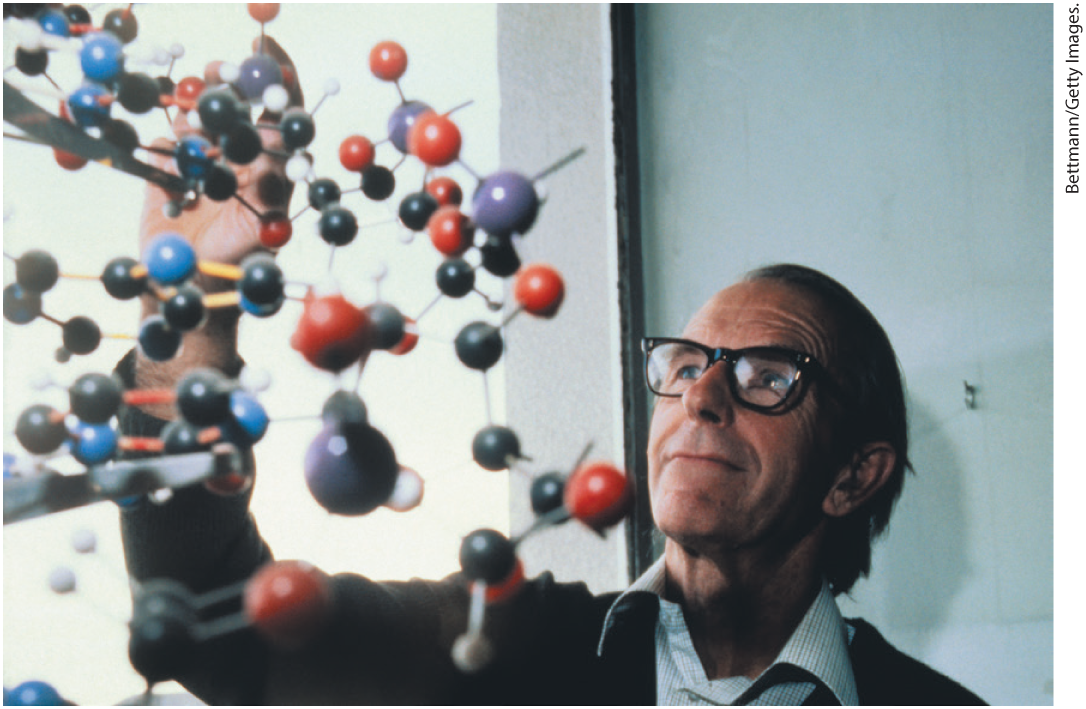
Frederick Sanger, 1918–2013
Enzymes called proteases catalyze the hydrolytic cleavage of peptide bonds and provide the most common method to break a protein into parts. Some proteases cleave only the peptide bond adjacent to particular amino acid residues (Table 3-6) and thus fragment a polypeptide chain in a predictable and reproducible way. A few chemical reagents also cleave the peptide bond adjacent to specific residues. Among proteases, the digestive enzyme trypsin catalyzes the hydrolysis of only those peptide bonds in which the carbonyl group is contributed by either a Lys or an Arg residue, regardless of the length or amino acid sequence of the chain. A polypeptide with three Lys and/or Arg residues will usually yield four smaller peptides upon cleavage with trypsin. Moreover, all except one of these will have a carboxyl-terminal Lys or Arg.
| Reagent (biological source)a | Cleavage pointsb |
|---|---|
Trypsin (bovine pancreas) |
Lys, Arg (C) |
Chymotrypsin (bovine pancreas) |
Phe, Trp, Tyr (C) |
Staphylococcus aureus V8 protease (bacterium S. aureus) |
Asp, Glu (C) |
Asp-N-protease (bacterium Pseudomonas fragi) |
Asp, Glu (N) |
Pepsin (porcine stomach) |
Leu, Phe, Trp, Tyr (N) |
Endoproteinase Lys C (bacterium Lysobacter enzymogenes) |
Lys (C) |
Cyanogen bromide |
Met (C) |
|
aAll reagents except cyanogen bromide are proteases. bResidues furnishing the primary recognition point for the protease or reagent; peptide bond cleavage occurs on either the carbonyl (C) side or the amino (N) side of the indicated amino acid residues. |
|
The capacity to modify proteins in specific ways has many applications in the lab. The methods used to break disulfide bonds can also be used to denature proteins when that is required. The development of reagents to label the amino-terminal amino acid residue led eventually to the development of an array of reagents that could react with specific groups at many locations on a protein. For example, the sulfhydryl group on Cys residues can be modified with iodoacetamides, maleimides, benzyl halides, and bromomethyl ketones (Fig. 3-27). Other amino acid residues can be modified by reagents linked to a dye or other molecule to aid in protein detection or functional studies. The cleavage of proteins into smaller parts with proteases has numerous applications that will be explored in subsequent chapters of this book.

FIGURE 3-27 Reagents used to modify the sulfhydryl groups of Cys residues. (See also Fig. 3-26.)
Mass Spectrometry Provides Information on Molecular Mass, Amino Acid Sequence, and Entire Proteomes
Mass spectrometry can provide a highly accurate measure of the molecular mass of a protein, readily distinguishing between single proton differences. However, this technology can do much more. The sequences of multiple short polypeptide segments (20 to 30 amino acid residues each) in a protein sample can be obtained within seconds. Unknown purified proteins can be identified, and their mass can be accurately determined. When coupled to powerful peptide separation protocols, mass spectrometry can document a complete cellular proteome — defined as the entire complement of proteins in a cell, including estimates of their relative abundance — in just an hour.
The mass spectrometer has been an indispensable tool in chemistry for more than a century. Molecules to be analyzed, referred to as analytes, are first ionized in a vacuum. When the newly charged molecules are introduced into an electric and/or magnetic field, their paths through the field are a function of their mass-to-charge ratio, m/z. This measured property of the ionized species can be used to deduce the mass (m) of the analyte with very high precision.
As the m/z measurements are made in the gas phase, the technique was long limited to relatively small molecules. In 1988, two different techniques were introduced to permit transfer of macromolecules to the gas phase while limiting decomposition; these new capabilities revolutionized protein sequencing. In one technique, proteins are placed in a light-absorbing matrix. With a short pulse of laser light, the proteins are ionized and then desorbed from the matrix into the vacuum system. This process, known as matrix-assisted laser desorption/ionization mass spectrometry, or MALDI MS, is used to measure the mass of macromolecules. In a second method, macromolecules in solution are forced directly from the liquid phase to the gas phase. A solution of analytes is passed through a charged needle that is kept at a high electrical potential, dispersing the solution into a fine mist of charged microdroplets. The solvent surrounding the macromolecules rapidly evaporates, leaving multiply charged macromolecular ions in the gas phase. This technique is called electrospray ionization mass spectrometry, or ESI MS. Protons added during passage through the needle give additional charge to the macromolecule. The m/z of the molecule can then be analyzed in the vacuum chamber. One method for analyzing m/z is called time of flight or TOF, in which ion acceleration in an electric field depends on m/z. A newer, more-efficient method is the Orbitrap, in which ions are trapped in orbit between an outer barrel-shaped electrode and an inner spindle electrode. The trajectory of the electrons, related to their mass and charge, is detected and converted to m/z by a Fourier transform.
The process for determining the molecular mass of a protein with ESI MS is illustrated in Figure 3-28. As a protein is injected into the gas phase, it acquires a variable number of protons, and thus positive charges, from the solvent. The variable addition of these charges creates a spectrum of species with different mass-to-charge ratios. Each successive peak corresponds to a species that differs from that of its neighboring peak by a charge of 1 and a mass of 1 (one proton). The mass of the protein can be determined from any two neighboring peaks.
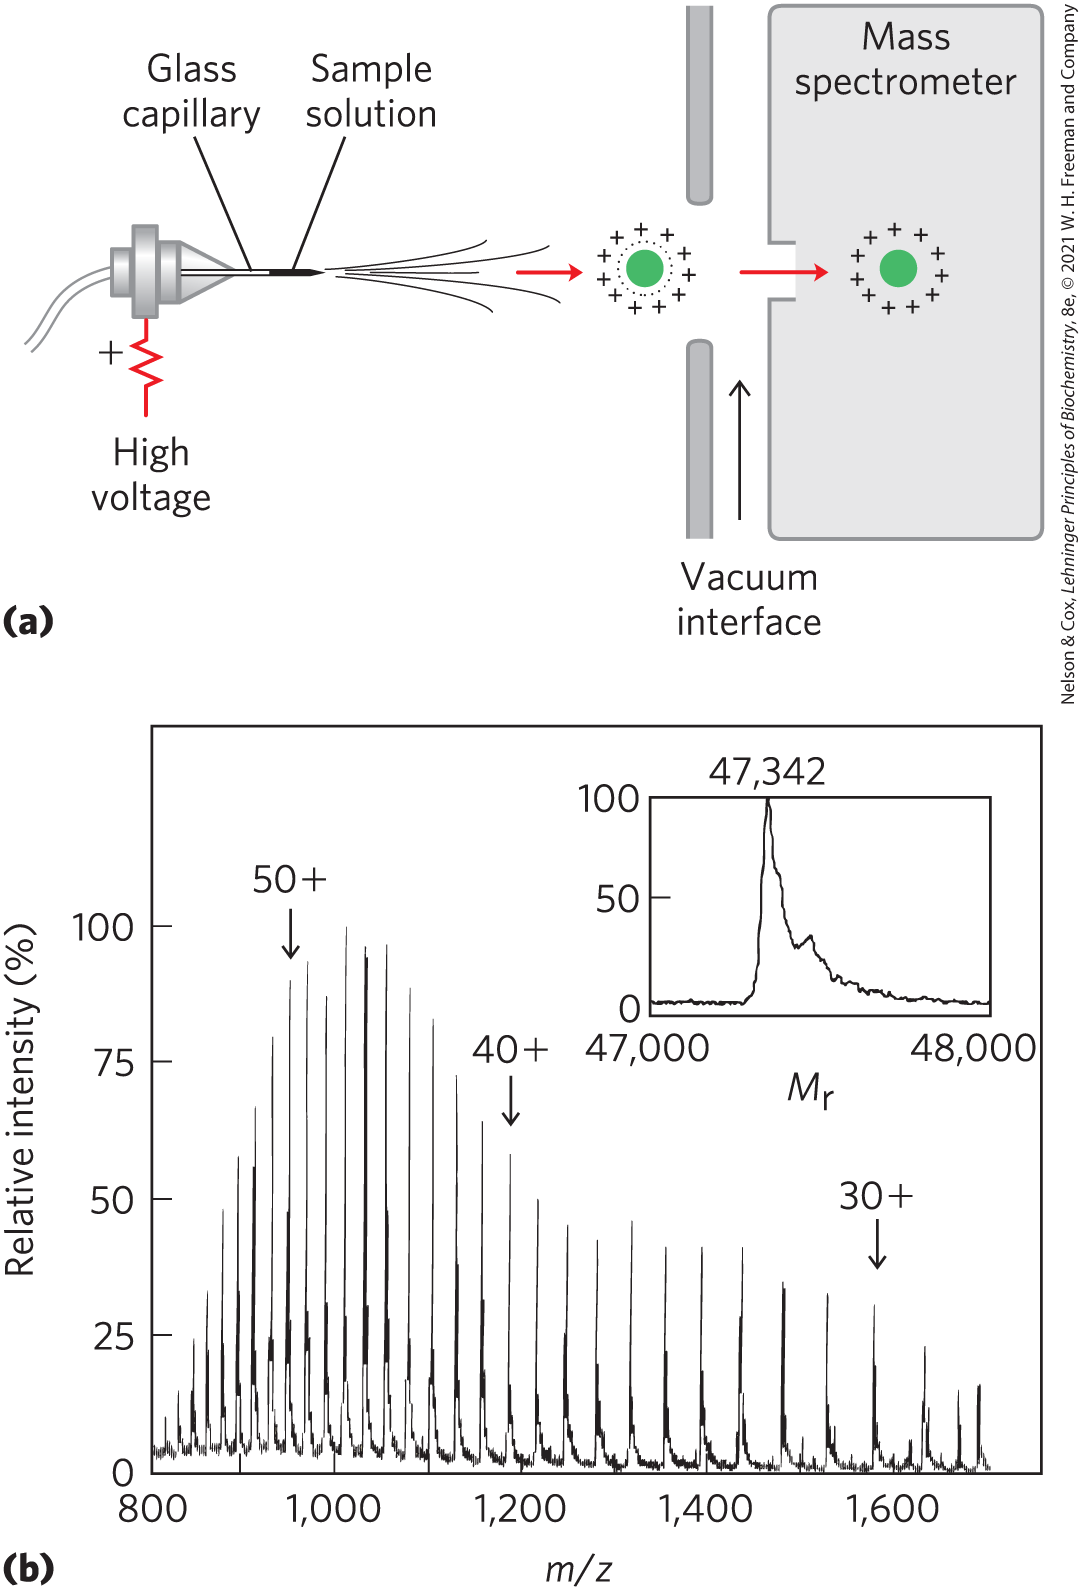
FIGURE 3-28 Electrospray ionization mass spectrometry of a protein. (a) A protein solution is dispersed into highly charged droplets by passage through a needle under the influence of a high-voltage electric field. The droplets evaporate, and the ions (with added protons in this case) enter the mass spectrometer for m/z measurement. (b) The spectrum generated is a family of peaks, with each successive peak (from right to left) corresponding to a charged species with both mass and charge increased by 1. The inset shows a computer-generated transformation of this spectrum. [Information from M. Mann and M. Wilm, Trends Biochem. Sci. 20:219, 1995.]
Amino acid sequence information is extracted using a technique called tandem MS, or MS/MS. A solution containing the protein or multiple proteins under investigation is first treated with a protease (often trypsin, due to its high specificity) to hydrolyze it to a mixture of shorter peptides. The mixture is then injected into a mass spectrometer that has two mass filters in tandem (Fig. 3-29a, top). In the first, the peptide mixture is sorted so that only one of the several types of peptides produced by cleavage emerges at the other end. The sample of the selected peptide, each molecule of which has a charge somewhere along its length, then travels through a vacuum chamber between the two mass spectrometers. In this collision cell, the peptide is further fragmented by high-energy impact with a “collision gas” such as helium or argon that is bled into the vacuum chamber. Each individual peptide is broken in only one place, on average. Although the breaks are not hydrolytic, most occur at the peptide bonds.
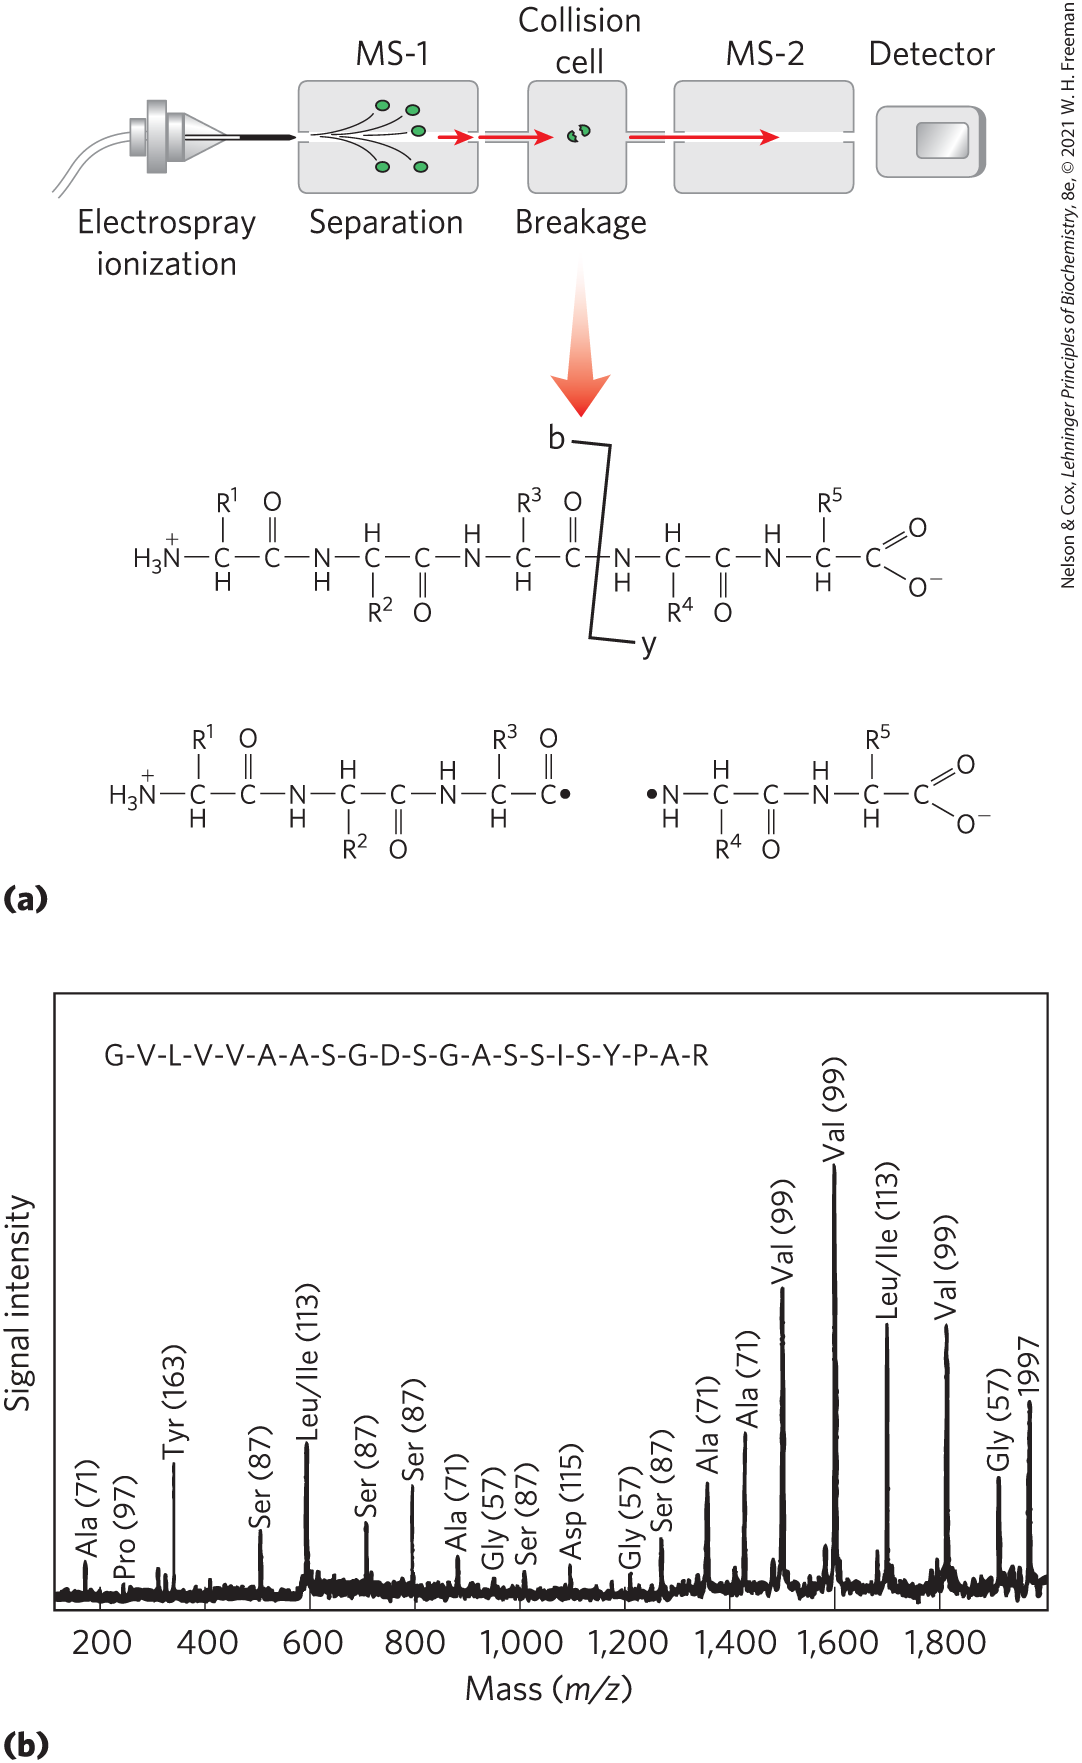
FIGURE 3-29 Obtaining protein sequence information with tandem MS. (a) After proteolytic hydrolysis, a protein solution is injected into a mass spectrometer (MS-1). The different peptides are sorted so that only one type is selected for further analysis. The selected peptide is further fragmented in a chamber between the two mass spectrometers, and m/z for each fragment is measured in the second mass spectrometer (MS-2). Many of the ions generated during this second fragmentation result from breakage of the peptide bond, as shown. These are called b-type or y-type ions, depending on whether the charge is retained on the amino- or carboxyl-terminal side, respectively. (b) A typical spectrum with peaks representing the peptide fragments generated from a sample of one small peptide (21 residues). The labeled peaks are y-type ions derived from amino acid residues. The number in parentheses over each peak is the molecular weight of the amino acid ion. The successive peaks differ by the mass of a particular amino acid in the original peptide. The deduced sequence is shown at the top. [Information from T. Keough et al., Proc. Natl. Acad. Sci. USA 96:7131, 1999, Fig. 3.]
The second mass filter then measures the m/z ratios of all the charged fragments. This process generates one or more sets of peaks. A given set of peaks (Fig. 3-29b) consists of all the charged fragments that were generated by breaking the same type of bond (but at different points in the peptide). One set of peaks includes only the fragments in which the charge was retained on the amino-terminal side of the broken bonds; another includes only the fragments in which the charge was retained on the carboxyl-terminal side of the broken bonds. Each successive peak in a given set has one less amino acid than the peak before. The difference in mass from peak to peak identifies the amino acid that was lost in each case, thus revealing the sequence of the peptide. The only ambiguities involve leucine and isoleucine, which have the same mass. Although multiple sets of peaks usually are generated, the two most prominent sets generally consist of charged fragments derived from breakage of the peptide bonds. The amino acid sequence derived from one set can be confirmed by the other, improving the confidence in the sequence information obtained.
The analysis of complex mixtures of proteins — even entire cellular proteomes — is facilitated by liquid chromatography (LC) that is integrated into the instrument (LC-MS/MS). The organism of interest is generally one in which the genomic sequence is known. Cellular proteins are first isolated in an extract, then digested into relatively short peptides by a protease such as trypsin. The very complex mixture of peptides is subjected to chromatography, so that resolved peptides are introduced to the mass spectrometer successively. Transfer from the liquid phase to the gas phase is facilitated by MALDI or ESI. Each peptide is analyzed for amino acid sequence, and that sequence is compared to the known genomic sequence available in databases to identify the protein it came from. Because more peptides are generated from the more common proteins in the mixture, the exercise also provides a measure of protein abundance. MS/MS scans of dozens of different peptides can be generated in less than a second. The entire proteome of a yeast cell can be analyzed in less than an hour.
Mass spectrometry provides a wealth of information for proteomics research, enzymology, and protein chemistry in general. The accurately measured molecular mass of a protein is critical to its identification. Changes in the cellular proteome can be monitored as a function of metabolic state or environmental conditions. Mass changes in the peptides scanned during a proteome analysis can reveal protein modifications of all kinds. Amino acid sequencing can reveal changes in protein sequence that result from the editing of messenger RNA in eukaryotes (Chapter 26). These methods, along with modern DNA sequencing processes (Chapter 8), are all part of a robust toolbox used to probe biological information at many levels.
Small Peptides and Proteins Can Be Chemically Synthesized
Many peptides are potentially useful as pharmacologic agents, and their production is of considerable commercial importance. In addition to its commercial applications, the synthesis of specific peptide portions of larger proteins is an increasingly important tool for the study of protein structure and function. There are three ways to obtain a peptide: (1) purification from tissue, a task often made difficult by the vanishingly low concentrations of some peptides; (2) genetic engineering (Chapter 9); and (3) direct chemical synthesis. Powerful techniques now make direct chemical synthesis an attractive option in many cases.
The complexity of proteins makes the traditional synthetic approaches of organic chemistry impractical for peptides with more than four or five amino acid residues. One problem is the difficulty of purifying the product after each step.
The major breakthrough in this technology was provided by R. Bruce Merrifield in 1962. His innovation was to synthesize a peptide while keeping one end attached to a solid support. The support is an insoluble polymer (resin) contained within a column, similar to that used for chromatographic procedures. The peptide is built up on this support one amino acid at a time, through a standard set of reactions in a repeating cycle (Fig. 3-30). At each successive step in the cycle, protective chemical groups block unwanted reactions.
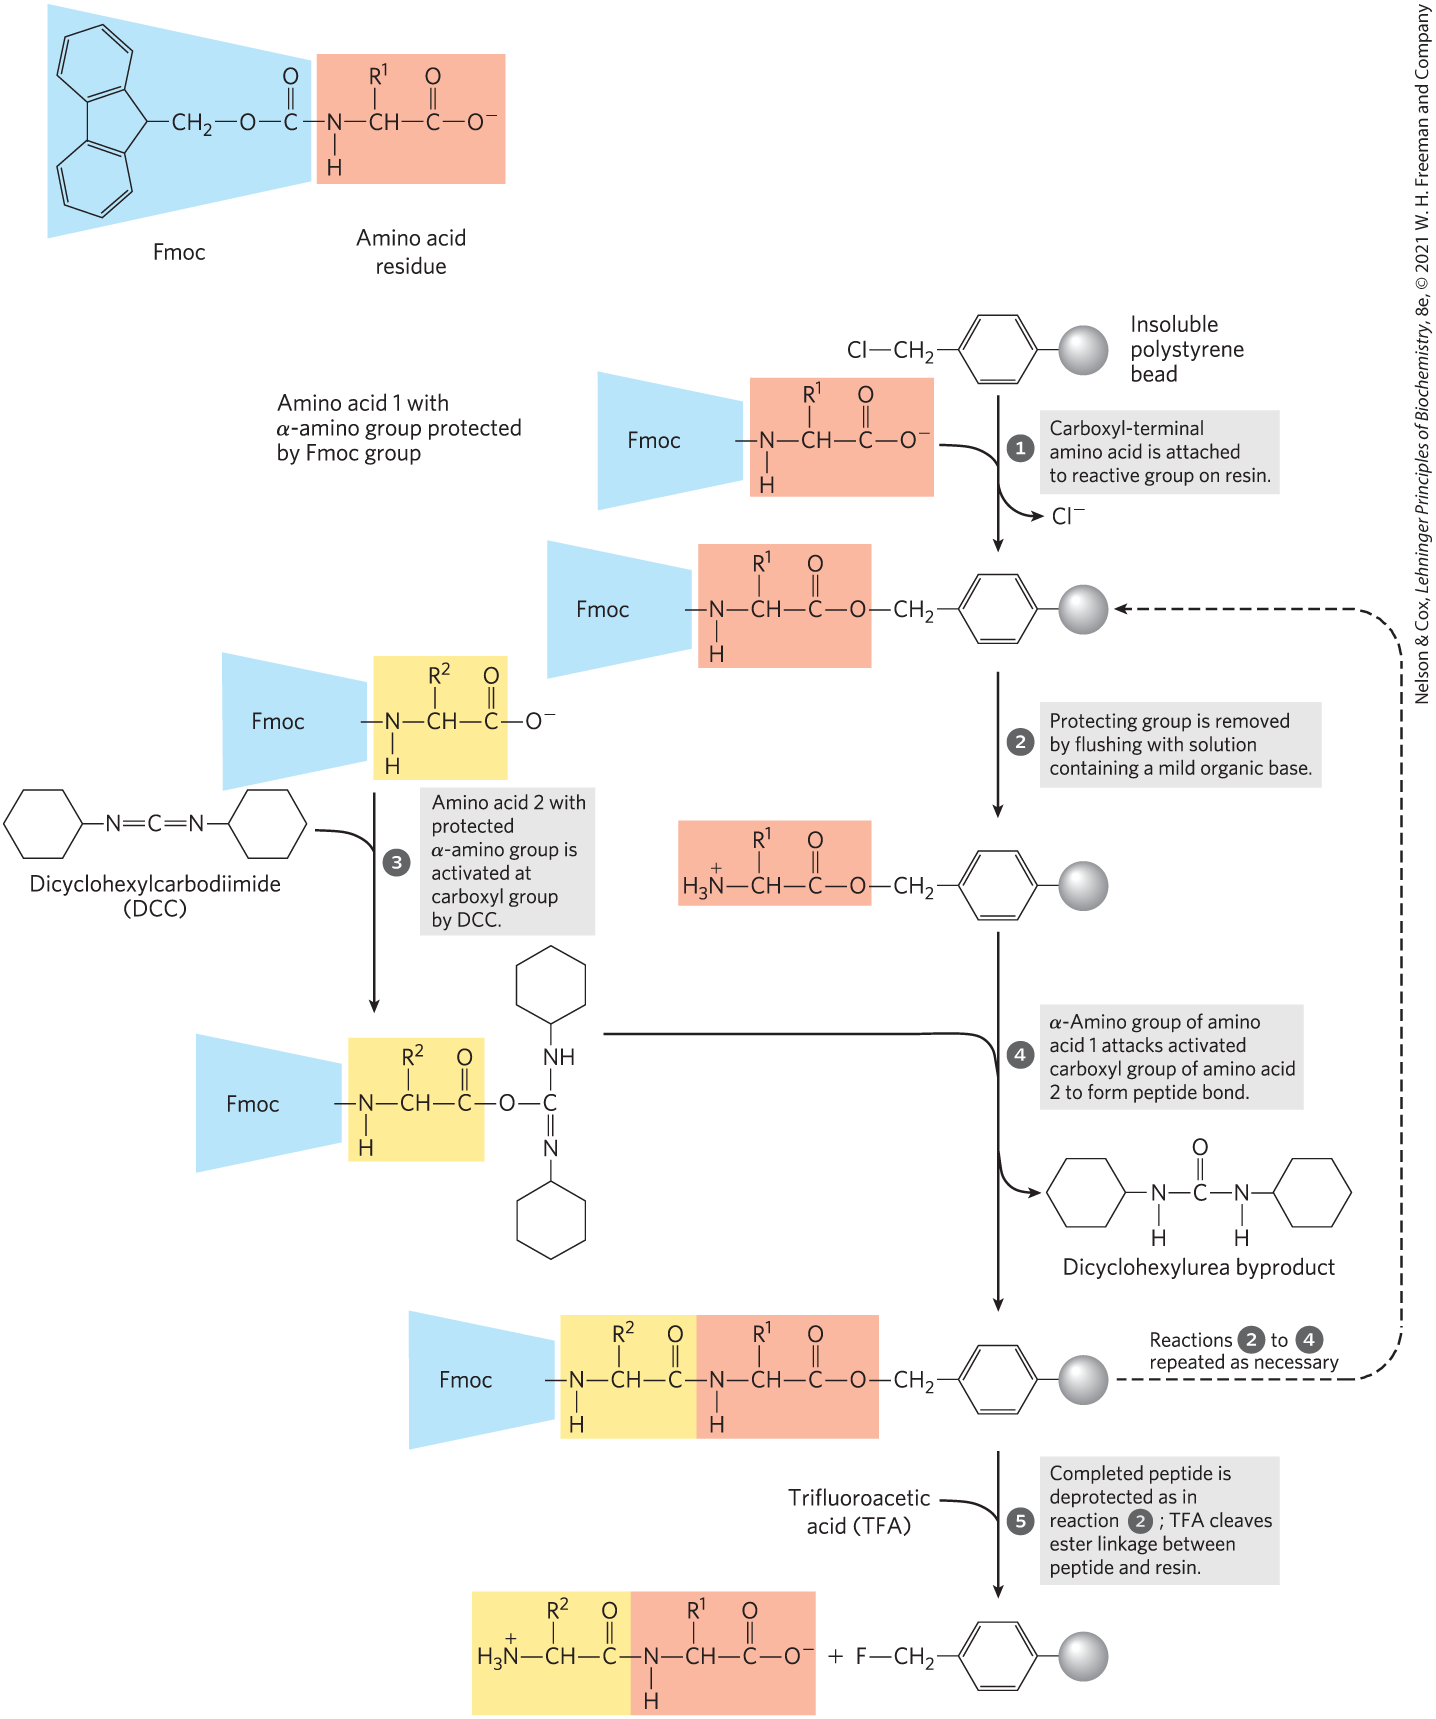
FIGURE 3-30 Chemical synthesis of a peptide on an insoluble polymer support. Reactions through are necessary for the formation of each peptide bond. The 9-fluorenylmethoxycarbonyl (Fmoc) group (shaded blue) prevents unwanted reactions at the α-amino group of the residue (shaded light red). Chemical synthesis proceeds from the carboxyl terminus to the amino terminus, the reverse of the direction of protein synthesis in vivo.
 through
  are necessary for the formation of each peptide bond. The 9-fluorenylmethoxycarbonyl (Fmoc) group (shaded blue) prevents unwanted reactions at the α-amino group of the residue (shaded light red). Chemical synthesis proceeds from the carboxyl terminus to the amino terminus, the reverse of the direction of protein synthesis in vivo.
The technology for chemical peptide synthesis has been automated. An important limitation of the process is the efficiency of each chemical cycle. Incomplete reaction at one stage can lead to formation of an impurity (in the form of a shorter peptide) in the next. The chemistry has been optimized to permit the synthesis of proteins of 100 amino acid residues in a few days in reasonable yield. A very similar approach is used to synthesize nucleic acids (see Fig. 8-33). It is worth noting that this technology, impressive as it is, still pales when compared with biological processes. The same 100-residue protein would be synthesized with exquisite fidelity in about 5 seconds in a bacterial cell.
Methods for the efficient ligation (joining together) of peptides allow the assembly of synthetic peptides into larger polypeptides and proteins. Novel forms of proteins can be created with precisely positioned chemical groups, including those that might not normally be found in a cellular protein. This provides one approach to test theories of enzyme catalysis, to create proteins with altered chemical properties, and to design protein sequences that will fold into particular structures. This last application provides the ultimate test of our ability to relate the primary structure of a peptide to the three-dimensional structure that it takes up in solution.
Amino Acid Sequences Provide Important Biochemical Information
Knowledge of the sequence of amino acids in a protein can offer insights into its three-dimensional structure and its function, cellular location, and evolution. Most of these insights are derived by searching for similarities between a protein of interest and previously studied proteins. Comparison of a newly obtained sequence with sequence data in international repositories often reveals relationships both surprising and enlightening.
We do not understand in detail exactly how the amino acid sequence determines three-dimensional structure, nor can we always predict function from sequence. However, protein families that have some shared structural or functional features can be readily identified on the basis of amino acid sequence similarities. Individual proteins are assigned to families based on the degree of similarity in amino acid sequence. Members of a family are usually identical across 25% or more of their sequences, and proteins in these families generally share at least some structural and functional characteristics. Some families, however, are defined by identities involving only a few amino acid residues that are critical to a certain function. A number of similar substructures, or “domains” (to be defined more fully in Chapter 4), occur in many functionally unrelated proteins. These domains often fold into structural configurations that have an unusual degree of stability or that are specialized for a certain environment. Evolutionary relationships can also be inferred from the structural and functional similarities within protein families.
Certain amino acid sequences serve as signals that determine the cellular location, chemical modification, and half-life of a protein. Special signal sequences, usually at the amino terminus, are used to target certain proteins for export from the cell; other proteins are targeted for distribution to the nucleus, the cell surface, the cytosol, or other cellular locations. Other sequences act as attachment sites for prosthetic groups, such as sugar groups in glycoproteins and lipids in lipoproteins. Some of these signals are well characterized and are easily recognized in the sequence of a newly characterized protein (Chapter 27).
Key convention
Much of the functional information encapsulated in protein sequences comes in the form of consensus sequences. This term is applied to such sequences in DNA, RNA, or protein. When a series of related nucleic acid sequences or protein sequences are compared, a consensus sequence is the one that reflects the most common base or amino acid at each position. Parts of the sequence that have particularly good agreement often represent evolutionarily conserved functional domains. Mathematical tools available online can generate consensus sequences or identify them in sequence databases. Box 3-2 illustrates common conventions for displaying consensus sequences.

Protein Sequences Help Elucidate the History of Life on Earth
The simple string of letters denoting the amino acid sequence of a protein holds a surprising wealth of information, which is being unlocked by applying the tools of bioinformatics to genomic and protein sequence data.
Each protein’s function relies on its three-dimensional structure, which in turn is determined largely by its primary structure. Thus, the biochemical information conveyed by a protein sequence is limited only by our understanding of structural and functional principles. The constantly evolving tools of bioinformatics make it possible to identify functional segments in new proteins and also help to establish both their sequence and their structural relationships to proteins already in the databases. On a different level of inquiry, protein sequences are beginning to tell us how the proteins evolved and, ultimately, how life evolved on this planet.
The field of molecular evolution is often traced to Emile Zuckerkandl and Linus Pauling, whose work in the mid-1960s advanced the use of nucleotide and protein sequences to explore evolution. The premise is deceptively straightforward. If two organisms are closely related, the sequences of their genes and proteins should be similar. The sequences increasingly diverge as the evolutionary distance between two organisms increases. The promise of this approach began to be realized in the 1970s, when Carl Woese used ribosomal RNA sequences to define the Archaea as a group of living organisms distinct from the Bacteria and Eukarya. The information in genome and protein sequence databases can be used to trace biological history if we can learn to read the genetic hieroglyphics.
Evolution has not taken a simple linear path. For a given protein, the amino acid residues essential for the activity of the protein are conserved over evolutionary time. The residues that are less important to function may vary over time — that is, one amino acid may substitute for another — and these variable residues can provide the information to trace evolution. Some proteins have more variable amino acid residues than others. For these and other reasons, different proteins evolve at different rates.
Another complicating factor in tracing evolutionary history is the rare transfer of a gene or a group of genes from one organism to another, a process called horizontal gene transfer. The transferred genes may be similar to the genes they were derived from in the original organism, whereas most other genes in the two organisms may be only distantly related. An example of horizontal gene transfer is the recent rapid spread of antibiotic-resistance genes in bacterial populations. The proteins derived from these transferred genes would not be good candidates for the study of bacterial evolution, because they share only a very limited evolutionary history with their “host” organisms.
The study of molecular evolution generally focuses on families of closely related proteins. In most cases, the families chosen for analysis have essential functions in cellular metabolism that must have been present in the earliest viable cells, thus greatly reducing the chance that they were introduced relatively recently by horizontal gene transfer. For example, a protein called EF-1α (elongation factor 1α) is involved in the synthesis of proteins in all eukaryotes. A similar protein, EF-Tu, with the same function, is found in bacteria. Similarities in sequence and function indicate that EF-1α and EF-Tu are members of a family of proteins that share a common ancestor. The members of protein families are called homologous proteins, or homologs. The concept of a homolog can be further refined. If two proteins in a family (that is, two homologs) are present in the same species, they are referred to as paralogs. Homologs from different species are called orthologs. The process of tracing evolution involves first identifying suitable families of homologous proteins and then using them to reconstruct evolutionary paths.
Homologs are identified using computer programs that can directly compare specific protein sequences or that can search databases to identify any protein with an amino acid that matches within defined parameters. The electronic search process can be thought of as sliding one sequence past the other until a section with a good match is found. Within this sequence alignment, a positive score is assigned for each position where the two sequences are identical, and a negative score is introduced wherever gaps need to be introduced in one sequence or the other to bring them into register. The overall score provides a measure of the quality of the alignment (Fig. 3-31). The program selects the alignment with the optimal score that maximizes identical amino acid residues while minimizing the introduction of gaps.

FIGURE 3-31 Aligning protein sequences with the use of gaps. Shown here is the sequence alignment of a short section of the Hsp70 proteins (a widespread class of protein-folding chaperones) from two well-studied bacterial species, E. coli and Bacillus subtilis. Introduction of a gap in the B. subtilis sequence allows a better alignment of amino acid residues on either side of the gap. Identical amino acid residues are shaded. [Information from R. S. Gupta, Microbiol. Mol. Biol. Rev. 62:1435, 1998, Fig. 2.]
Finding identical amino acids is often inadequate in attempts to identify related proteins or, more importantly, to determine how closely related the proteins are on an evolutionary time scale. A more useful analysis also considers the chemical properties of substituted amino acids. Many of the amino acid differences within a protein family may be conservative — that is, an amino acid residue is replaced by a residue that has similar chemical properties. For example, a Glu residue may substitute in one family member for the Asp residue found in another; both amino acids are negatively charged. Logically, such a conservative substitution should receive a higher score in a sequence alignment than a nonconservative substitution does — for example, in replacement of the Asp residue with a hydrophobic Phe residue.
For most efforts to find homologies and explore evolutionary relationships, protein sequences are superior to nucleic acid sequences that do not encode a protein or functional RNA. For a nucleic acid, with its four different types of residues, random alignment of nonhomologous sequences will generally yield matches for at least 25% of the positions. Introduction of a few gaps can often increase the fraction of matched residues to 40% or more, and the probability of chance alignment of unrelated sequences becomes quite high. The 20 different amino acid residues in proteins greatly lower the probability of uninformative chance alignments of this type.
The programs used to generate a sequence alignment are complemented by methods that test the reliability of the alignments. A common computerized test is to shuffle the amino acid sequence of one of the proteins being compared in order to produce a random sequence, then to instruct the program to align the shuffled sequence with the other, unshuffled one. Scores are assigned to the new alignment, and the shuffling and alignment process is repeated many times. The original alignment, before shuffling, should have a score significantly higher than any of those within the distribution of scores generated by the random alignments; this increases the confidence that the sequence alignment has identified a pair of homologs. Note that the absence of a significant alignment score does not necessarily mean that no evolutionary relationship exists between two proteins. As we shall see in Chapter 4, three-dimensional structural similarities sometimes reveal evolutionary relationships where sequence homology has been wiped away by time.
To use a protein family to explore evolution, researchers identify family members with similar molecular functions in the widest possible range of organisms. The sequence divergence in these protein families allows segregation of organisms into classes based on their evolutionary relationships. Certain segments of a protein sequence may be found in the organisms of one taxonomic group but not in other groups; these segments can be used as signature sequences for the group in which they are found. An example of a signature sequence is an insertion of 12 amino acids near the amino terminus of the EF-1α/EF-Tu proteins in all archaea and eukaryotes but not in bacteria (Fig. 3-32). This particular signature is one of many biochemical clues that can help establish the evolutionary relatedness of eukaryotes and archaea.

FIGURE 3-32 A signature sequence in the EF-1α/EF-Tu protein family. The signature sequence (boxed) is a 12-residue insertion near the amino terminus of the sequence. Residues that align in all species are shaded. Both archaea and eukaryotes have the signature, although the sequences of the insertions are distinct for the two groups. The variation in the signature sequence reflects the significant evolutionary divergence that has occurred at this site since it first appeared in a common ancestor of both groups. [Information from R. S. Gupta, Microbiol. Mol. Biol. Rev. 62:1435, 1998, Fig. 7.]
By considering the sequences of multiple proteins, researchers can construct elaborate evolutionary trees. Figure 3-33 presents one such tree for 10,462 bacterial species, based on the sequences of 120 proteins ubiquitous in bacteria. In Figure 3-33, the free end points of lines are called “external nodes”; each represents an extant species, and each is so labeled. The points where two lines come together, the “internal nodes,” represent extinct ancestor species. In most representations (including Fig. 3-33), the lengths of the lines connecting the nodes reflect amino acid substitutions in the selected proteins that separate one species from another. The use of 120 different proteins permits calibration and a more accurate determination of the time required for the various species to diverge.
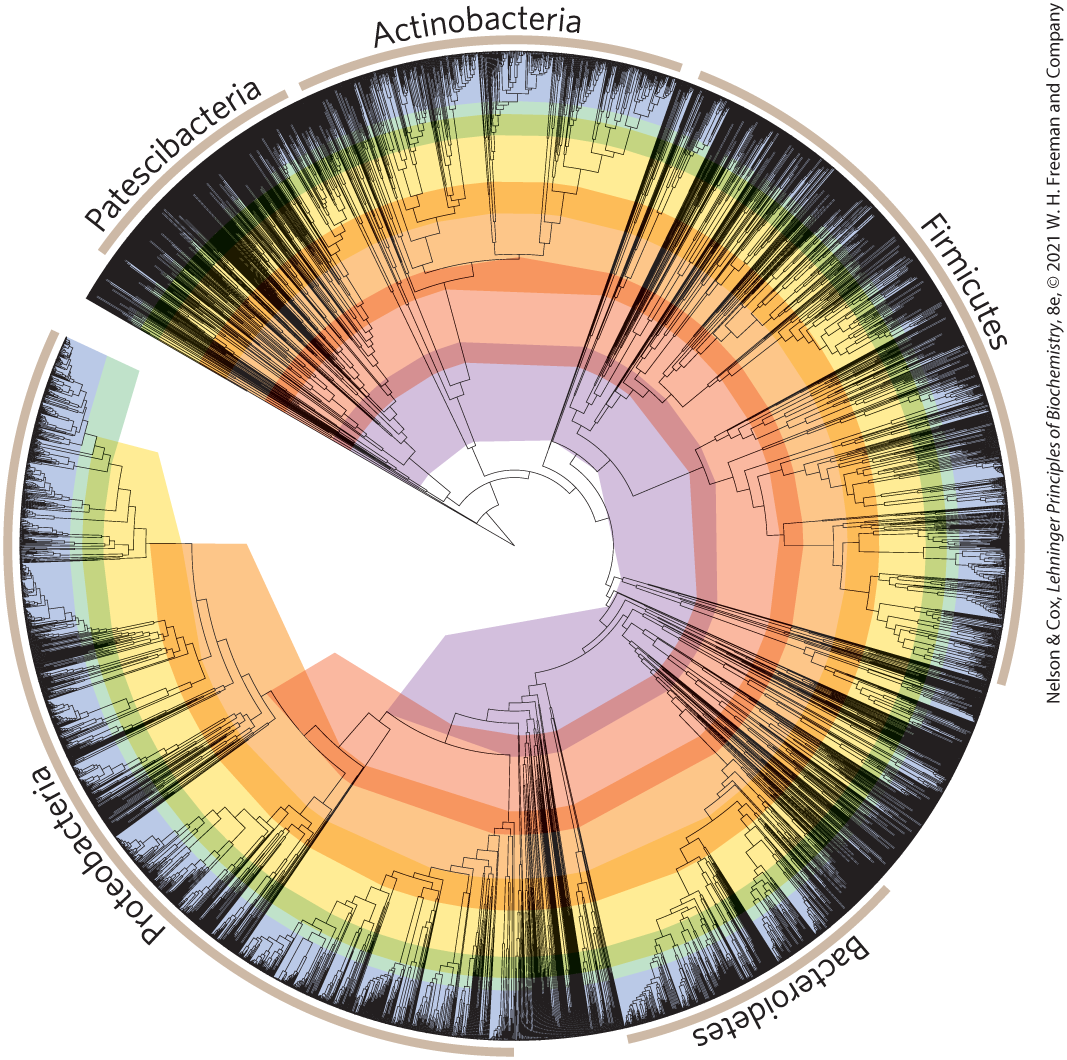
FIGURE 3-33 Evolutionary tree derived from amino acid sequence comparisons. This tree includes data from 10,462 bacterial species. The leaf nodes (points of intersection with the outer circle) represent extant species. Inner nodes (points where lines emanating from the leaf nodes come together) represent extinct ancestral species. Line lengths correspond to evolutionary time, as measured by sequence divergence in 120 proteins common to all bacteria. The major bacterial phyla are denoted by lines encompassing parts of the outer circle. [Information from D. H. Parks, Nat. Biotechnol. 36:996, 2018, Fig. 1c.].
As more sequence information is made available in databases, we move toward one of the core goals of biology — creating a detailed tree of life that describes the evolution and relationship of every organism on Earth. The story is a work in progress. The questions being asked and answered are fundamental to how humans view themselves and the world around them.
SUMMARY 3.4 The Structure of Proteins: Primary Structure
- Differences in protein function result from differences in amino acid composition and sequence. The chemical properties of particular amino acid residues are often critical to the function of a protein.
- Most amino acid sequences are deduced from genomic sequences and by mass spectrometry. Methods derived from classical approaches to protein sequencing remain important in protein chemistry.
- Short proteins and peptides (up to about 100 residues) can be chemically synthesized. The peptide is built up, one amino acid residue at a time, while tethered to a solid support.
- Protein sequences are a rich source of information about protein structure and function. Bioinformatics can analyze changes in the amino acid sequences of homologous proteins over time to trace the evolution of life on Earth.
 Differences in protein function result from differences in amino acid composition and sequence. The chemical properties of particular amino acid residues are often critical to the function of a protein.