Chapter Review
KEY TERMS
Terms in bold are defined in the glossary.
- deoxyribonucleic acid (DNA)
- ribonucleic acid (RNA)
- gene
- ribosomal RNA (rRNA)
- messenger RNA (mRNA)
- transfer RNA (tRNA)
- nucleotide
- nucleoside
- pyrimidine
- purine
- deoxyribonucleotides
- ribonucleotide
- phosphodiester linkage
- end
- end
- oligonucleotide
- polynucleotide
- tautomers
- base pair
- major groove
- minor groove
- B-form DNA
- A-form DNA
- Z-form DNA
- palindrome
- hairpin
- cruciform
- triplex DNA
- G tetraplex
- transcription
- monocistronic mRNA
- polycistronic mRNA
- mutation
- polymerase chain reaction (PCR)
- DNA polymerases
- primer
- Sanger sequencing
- sequence polymorphisms
- short tandem repeat (STR)
- reversible terminator sequencing
- single-molecule real-time (SMRT) sequencing
- sequencing depth
- contig
- nucleotide-binding fold
- second messenger
- adenosine ,-cyclic monophosphate (cyclic AMP, cAMP)
Problems
1. Nucleotide Structure Which positions in the purine ring of a purine nucleotide in DNA have the potential to form hydrogen bonds but are not involved in Watson-Crick base pairing?
2. Base Sequence of Complementary DNA Strands One strand of a double-helical DNA has the sequence ()GCG CAATATTTCTCAAAATATTGCGC(). Write the base sequence of the complementary strand. What special type of sequence is contained in this DNA segment? Does the double-stranded DNA have the potential to form any alternative structures?
3. DNA of the Human Body If completely unraveled, all of a human’s DNA would be able to reach a distance of nearly , the distance from Earth to the moon. Given that each base pair in a DNA helix extends a distance of 3.4 Å, calculate the number of base pairs found within the entirety of a human’s DNA.
4. Nucleic Acids A damaged tetranucleotide structure is shown below. (a) Name each of the nucleotides (or the type of damaged site as appropriate), proceeding from top left to lower right. (b) Indicate which end (upper left or lower right) is the end and which is the end. (c) Is this tetranucleotide DNA or RNA?

5. Distinction between DNA Structure and RNA Structure Secondary structures called hairpins may form at palindromic sequences in single strands of either RNA or DNA. The fully base-paired portions of hairpins form helices. How do RNA hairpins differ from DNA hairpins?
6. Nucleotide Chemistry The cells of many eukaryotic organisms have highly specialized systems that specifically repair G–T mismatches in DNA. The mismatch is repaired to form a , not , base pair. This G–T mismatch repair mechanism occurs in addition to a more general system that repairs virtually all mismatches. Suggest why cells might require a specialized system to repair G–T mismatches.
7. Denaturation of Nucleic Acids A duplex DNA oligonucleotide in which one of the strands has the sequence TAATACGACT CACTATAGGG has a melting temperature () of . If an RNA duplex oligonucleotide of identical sequence (substituting U for T) is constructed, will its melting temperature be higher or lower?
8. Spontaneous DNA Damage Hydrolysis of the N-glycosyl bond between deoxyribose and a purine in DNA creates an apurinic (AP) site. An AP site is more thermodynamically destabilizing to a DNA molecule than is a mismatched base pair. Examine the structure of an AP site (see Fig. 8-29b) and describe some chemical consequences of base loss.
9. Prediction of Nucleic Acid Structure from Its Sequence A part of a sequenced chromosome has the sequence (on one strand) ATTGCATCCGCGCGTGCGCGCGCGATCCCGT TACTTTCCG. What is the longest part of this sequence that is likely to take up the Z conformation?
10. Nucleic Acid Identity Explain how RNA nucleotides differ from DNA nucleotides.
11. Nucleic Acid Structure Explain why the absorption of UV light by double-stranded DNA increases (the hyperchromic effect) when the DNA is denatured.
12. Solubility of the Components of DNA Draw the structures of deoxyribose, guanine, and phosphate and rate their relative solubilities in water (most soluble to least soluble). How are these solubilities consistent with the three-dimensional structure of double-stranded DNA?
13. Polymerase Chain Reaction An investigator has one strand of a chromosomal DNA whose sequence is shown. She wants to use polymerase chain reaction (PCR) to amplify and isolate the DNA fragment defined by the segment shown in boldface. Her first step is to design two PCR primers, each 20 nucleotides long, that can be used to amplify this DNA segment. The final PCR product generated from the primers should include no sequences outside the segment in boldface.
–––AATGCCGTCAGCCGATCTGCCTCGAGTCAATCGAT
GCTGGTAACTTGGGGTATAAAGCTTACCCATGGTATCGTAGT
TAGATTGATTGTTAGGTTCTTAGGTTTAGGTTTCTGGTATTG
GTTTAGGGTCTTTGATGCTATTAATTGTTTGGTTTTGATTTG
GTCTTTATATGGTTTATGTTTTAAGCCGGGTTTTGTCTGG
GATGGTTCGTCTGATGTGCGCGTAGCGTGCGGCG–––
What are the sequences of the investigator’s forward primer and reverse primer? Recall that the forward primer binds to the strand of DNA running in the to direction, whereas the reverse primer binds to the opposite strand.
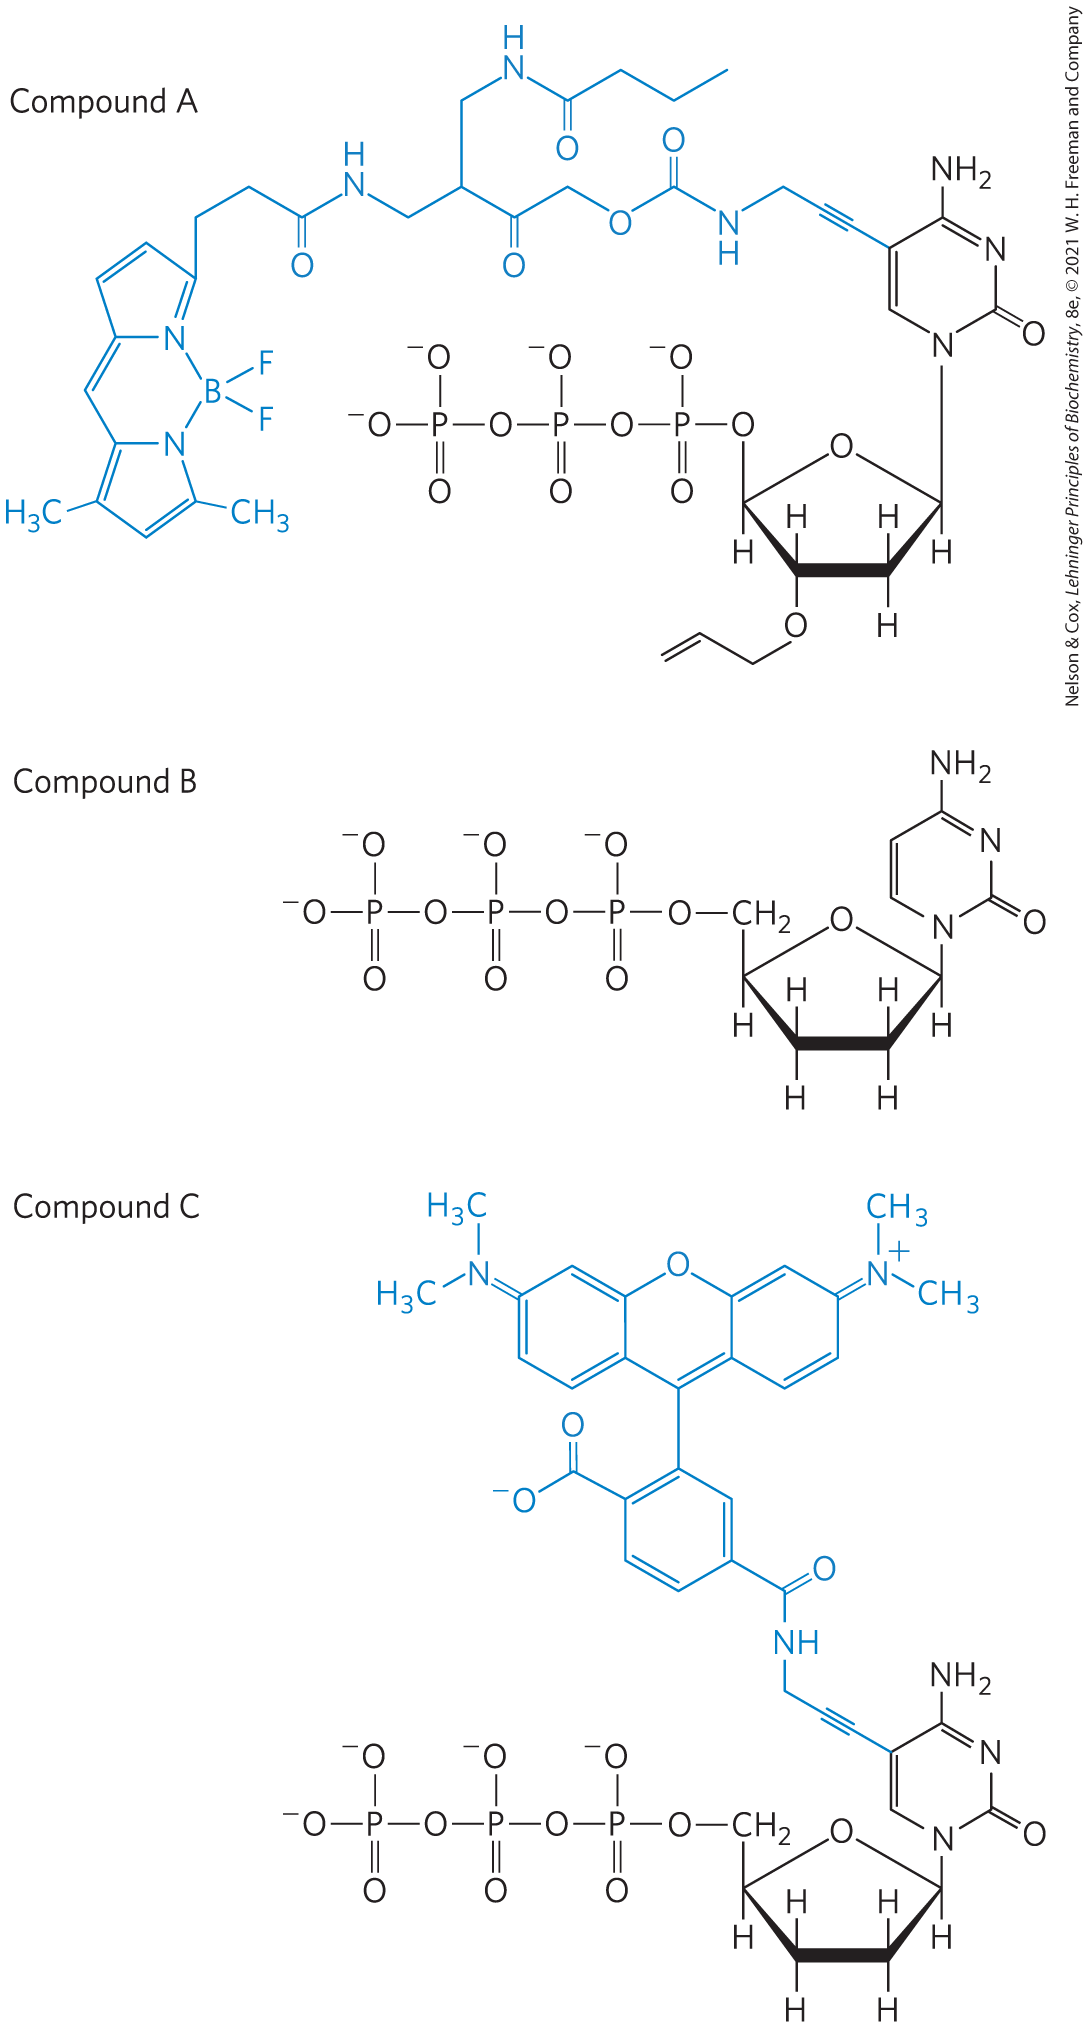
14. DNA Sequencing Reagents Indicate which of the modified cytidine nucleotide triphosphates shown might be used for each procedure: (a) Classical Sanger sequencing (b) Automated Sanger sequencing (c) Next-generation DNA sequencing (Illumina). Linked fluorescent dyes, where present, are highlighted.
15. Genomic Sequencing In large-genome sequencing projects, the initial data usually reveal gaps between contigs where no sequence information has been obtained. To close the gaps, DNA primers complementary to the -ending strand at the end of each contig are especially useful. Explain how researchers could use these primers to close the gaps between contigs.
16. Next-Generation Sequencing In reversible terminator sequencing, how would the sequencing process be affected if the -end-blocking group of each nucleotide were replaced with the -H present in the dideoxynucleotides used in Sanger sequencing?
17. Sanger Sequencing Logic In the Sanger (dideoxy) method for DNA sequencing, researchers add a small amount of a dideoxynucleoside triphosphate, such as ddCTP, to the sequencing reaction along with a larger amount of the corresponding deoxynucleoside, such as dCTP. What result would researchers observe if they omitted dCTP from the sequencing reaction?
18. DNA Sequencing A researcher used the Sanger method to sequence the DNA fragment shown. The red asterisk indicates a fluorescent label.
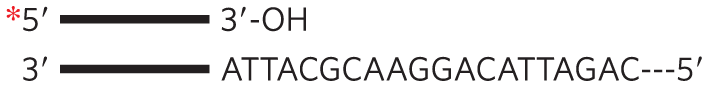
She reacted a sample of the DNA with DNA polymerase and each of the four nucleotide mixtures (in an appropriate buffer) listed. Some of the mixtures included dideoxynucleotides (ddNTPs) in relatively small amounts.
- dATP, dTTP, dCTP, dGTP, ddTTP
- dATP, dTTP, dCTP, dGTP, ddGTP
- dATP, dCTP, dGTP, ddTTP
- dATP, dTTP, dCTP, dGTP
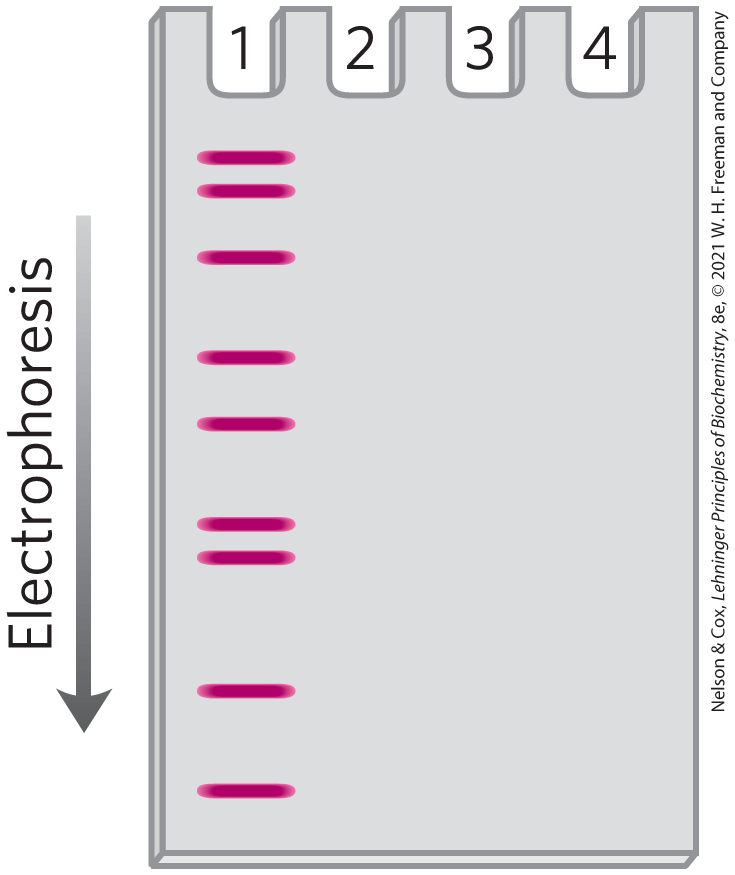
The researcher then separated the resulting DNA by electrophoresis on a polyacrylamide gel and located the fluorescent bands on the gel. The image of the gel shows the band pattern resulting from nucleotide mixture 1. Assuming that all mixtures were run on the same gel, what did the remaining lanes of the gel look like?
19. Snake Venom Phosphodiesterase An exonuclease is an enzyme that sequentially cleaves nucleotides from the end of a polynucleotide strand. Snake venom phosphodiesterase, which hydrolyzes nucleotides from the end of any oligonucleotide with a free -hydroxyl group, cleaves between the hydroxyl of the ribose or deoxyribose and the phosphoryl group of the next nucleotide. It acts on single-stranded DNA or RNA and has no base specificity. This enzyme was used in sequence determination experiments before the development of modern nucleic acid sequencing techniques. What are the products of partial digestion by snake venom phosphodiesterase of an oligonucleotide with the sequence ()GCGCCAUUGC()—OH?
20. Preserving DNA in Bacterial Endospores Bacterial endospores form when the environment is no longer conducive to active cell metabolism. The soil bacterium Bacillus subtilis, for example, begins the process of sporulation when one or more nutrients are depleted. The end product is a small, metabolically dormant structure that can survive almost indefinitely with no detectable metabolism. Spores have mechanisms to prevent accumulation of potentially lethal mutations in their DNA over periods of dormancy that can exceed 1,000 years. B. subtilis spores are much more resistant than are the organism’s growing cells to heat, UV radiation, and oxidizing agents, all of which promote mutations.
- One factor that prevents potential DNA damage in spores is their greatly decreased water content. How would this affect some types of mutations?
- Endospores have a category of proteins called small acid-soluble proteins (SASPs) that bind to their DNA, preventing formation of cyclobutane-type dimers. What causes cyclobutane dimers, and why do bacterial endospores need mechanisms to prevent their formation?
21. Oligonucleotide Synthesis As shown in the scheme of Figure 8-34, oligonucleotide synthesis involves adding modified bases, one at a time, to a growing chain. The modified bases contain an activated hydroxyl and have a dimethoxytrityl (DMT) group attached to the hydroxyl. What is the function of the DMT group on the incoming base?
BIOCHEMISTRY ONLINE
22. The Structure of DNA Elucidation of the three-dimensional structure of DNA helped researchers understand how this molecule conveys information that can be faithfully replicated from one generation to the next. To see the secondary structure of double-stranded DNA, go to the Protein Data Bank website (www.rcsb.org). Use the PDB identifiers provided in parts (a) and (b) below to retrieve the structure summary for a double-stranded DNA segment. View the 3D structure using JSmol. The viewer select menu is below the right corner of the image box. Once in JSmol, you will need to use both the display menus on the screen and the scripting controls in the JSmol menu. Access the JSmol menu by clicking on the JSmol logo in the lower right corner of the image screen. Refer to the JSmol help links as needed.
- Access PDB ID 141D, a highly conserved, repeated DNA sequence from the end of the genome of HIV-1 (the virus that causes AIDS). Set the Style to Ball and Stick. Then use the scripting controls to color by element (Color > Atoms > By Scheme > Element (CPK)). Identify the sugar–phosphate backbone for each strand of the DNA duplex. Locate and identify individual bases. Identify the end of each strand. Locate the major and minor grooves. Is this a right- or left-handed helix?
- Access PDB ID 145D, a DNA with the Z conformation. Set the Style to Ball and Stick. Then use the scripting controls to color by element (Main Menu > Color > Atoms > By Scheme > Element (CPK)). Identify the sugar–phosphate backbone for each strand of the DNA duplex. Is this a right- or left-handed helix?
- To fully appreciate the secondary structure of DNA, view the molecules in stereo. From the scripting control Main Menu select Style > Stereographic > Cross-eyed viewing or Wall-eyed viewing. (If you have stereographic glasses available, select the appropriate option.) You will see two images of the DNA molecule. Sit with your nose approximately 10 inches from the screen and focus on the tip of your nose (cross-eyed) or on the opposite edges of the screen (wall-eyed). In the background you should see three images of the DNA helix. Shift your focus to the middle image, which should appear three-dimensional. (Note that only one of the authors can make this work.)
DATA ANALYSIS PROBLEM
23. Chargaff’s Studies of DNA Structure The main findings of Erwin Chargaff and his coworkers (“Chargaff’s rules”) are summarized on page 270. In this problem, you will examine the data Chargaff collected in support of his conclusions.
In one paper, Chargaff (1950) described his analytical methods and some early results. Briefly, he treated DNA samples with acid to remove the bases, separated the bases by paper chromatography, and measured the amount of each base with UV spectroscopy. His results are shown in the three tables below. The molar ratio is the ratio of the number of moles of each base in the sample to the number of moles of phosphate in the sample — this gives the fraction of the total number of bases represented by each particular base. The recovery is the sum of all four bases (the sum of the molar ratios); full recovery of all bases in the DNA would give a recovery of 1.0.
Molar ratios in ox DNA Thymus Spleen Liver Base Prep. 1 Prep. 2 Prep. 3 Prep. 1 Prep. 2 Prep. 1 Adenine
0.26
0.28
0.30
0.25
0.26
0.26
Guanine
0.21
0.24
0.22
0.20
0.21
0.20
Cytosine
0.16
0.18
0.17
0.15
0.17
Thymine
0.25
0.24
0.25
0.24
0.24
Recovery
0.88
0.94
0.94
0.84
0.88
Molar ratios in human DNA Sperm Thymus Liver Base Prep. 1 Prep. 2 Prep. 1 Normal Carcinoma Adenine
0.29
0.27
0.28
0.27
0.27
Guanine
0.18
0.17
0.19
0.19
0.18
Cytosine
0.18
0.18
0.16
0.15
Thymine
0.31
0.30
0.28
0.27
Recovery
0.96
0.92
0.91
0.87
Molar ratios in DNA of microorganisms Yeast Avian tubercle bacilli Base Prep. 1 Prep. 2 Prep. 1 Adenine
0.24
0.30
0.12
Guanine
0.14
0.18
0.28
Cytosine
0.13
0.15
0.26
Thymine
0.25
0.29
0.11
Recovery
0.76
0.92
0.77
- Based on these data, Chargaff concluded that “no differences in composition have so far been found in DNA from different tissues of the same species.” However, a skeptic looking at the data might say, “They certainly look different to me!” If you were Chargaff, how would you use the data to change the skeptic’s mind?
- The base composition of DNA from normal and cancerous liver cells (hepatocarcinoma) was not distinguishably different. Would you expect Chargaff’s technique to be capable of detecting a difference between the DNA of normal and cancerous cells? Explain your reasoning.
As you might expect, Chargaff’s data were not completely convincing. He went on to improve his techniques, as described in his 1951 paper, in which he reported molar ratios of bases in DNA from a variety of organisms.
Source A:G T:C A:T G:C Purine:pyrimidine Ox
1.29
1.43
1.04
1.00
1.1
Human
1.56
1.75
1.00
1.00
1.0
Hen
1.45
1.29
1.06
0.91
0.99
Salmon
1.43
1.43
1.02
1.02
1.02
Wheat
1.22
1.18
1.00
0.97
0.99
Yeast
1.67
1.92
1.03
1.20
1.0
Haemophilus influenzae type c
1.74
1.54
1.07
0.91
1.0
E. coli K-12
1.05
0.95
1.09
0.99
1.0
Avian tubercle bacillus
0.4
0.4
1.09
1.08
1.1
Serratia marcescens
0.7
0.7
0.95
0.86
0.9
Bacillus schatz
0.7
0.6
1.12
0.89
1.0
- According to Chargaff, “The base composition of DNA generally varies from one species to another.” Provide an argument, based on the data presented so far, that supports this conclusion.
- According to Chargaff’s rules, “In all cellular DNAs, regardless of the species, … A + G = T + C.” Provide an argument, based on the data presented, that supports this conclusion.
References
- Chargaff, E. 1950. Chemical specificity of nucleic acids and mechanism of their enzymatic degradation. Experientia 6:201–209.
- Chargaff, E. 1951. Structure and function of nucleic acids as cell constituents. Fed. Proc. 10:654–659.