4.2 Protein Secondary Structure
The term secondary structure refers to any chosen segment of a polypeptide chain and describes the local spatial arrangement of its main-chain atoms, without regard to the positioning of its side chains or its relationship to other segments. A regular secondary structure occurs when each dihedral angle, ϕ and ψ, remains the same or nearly the same throughout the segment. A few types of secondary structure are particularly stable and occur widely in proteins. The most prominent are the α helix and β conformation; another common type is the β turn. Secondary structures without a regular pattern are sometimes referred to as undefined or as random coils. Random coil, however, does not properly describe the structure of these segments. The path of most of the polypeptide backbone in a typical protein is not random; rather, it is highly specific to the structure and function of that particular protein. Our discussion here focuses on the regular structures that are most common.
 A few types of secondary structure are particularly stable and occur widely in proteins. The most prominent are the α helix and β conformation; another common type is the β turn. Secondary structures without a regular pattern are sometimes referred to as undefined or as random coils. Random coil, however, does not properly describe the structure of these segments. The path of most of the polypeptide backbone in a typical protein is not random; rather, it is highly specific to the structure and function of that particular protein. Our discussion here focuses on the regular structures that are most common.
The α Helix Is a Common Protein Secondary Structure
Pauling and Corey were aware of the importance of hydrogen bonds in orienting polar chemical groups such as the and groups of the peptide bond. They also had the experimental results of William Astbury, who in the 1930s had conducted pioneering x-ray studies of proteins. Astbury demonstrated that the protein that makes up hair and porcupine quills (the fibrous protein α-keratin) has a regular structure that repeats every 5.15 to 5.20 Å. (The angstrom, Å, named after the physicist Anders J. Ångström, is equal to 0.1 nm. Although not an SI unit, it is used universally by structural biologists to describe atomic distances — it is approximately the length of a typical bond.) With this information and their data on the peptide bond, and with the help of precisely constructed models, Pauling and Corey set out to determine the likely conformations of protein molecules.
The first breakthrough came in 1948. Pauling, at that time a visiting lecturer at Oxford University, became ill and retired to his apartment for several days of rest. Bored with the reading available, Pauling grabbed some paper and pencils to work out a plausible stable structure that could be taken up by a polypeptide chain. The model he developed, and later confirmed in work with Corey and coworker Herman Branson, was the simplest arrangement the polypeptide chain can assume that maximizes the use of internal hydrogen bonding. It is a helical structure, and Pauling and Corey called it the α helix (Fig. 4-3). In this structure, the polypeptide backbone is tightly wound around an imaginary axis drawn longitudinally through the middle of the helix, and the R groups of the amino acid residues protrude outward from the helical backbone (Fig. 4-3b, c). The repeating unit is a single turn of the helix, which extends about 5.4 Å along the long axis, slightly greater than the periodicity that Astbury observed on x-ray analysis of hair keratin. The backbone atoms of the amino acid residues in the prototypical α helix have a characteristic set of dihedral angles that define the conformation of the α helix (Table 4-1), and each helical turn includes 3.6 amino acid residues. The α-helical segments in proteins often deviate slightly from these dihedral angles, and they even vary somewhat within a single, continuous segment so as to produce subtle bends or kinks in the helical axis.
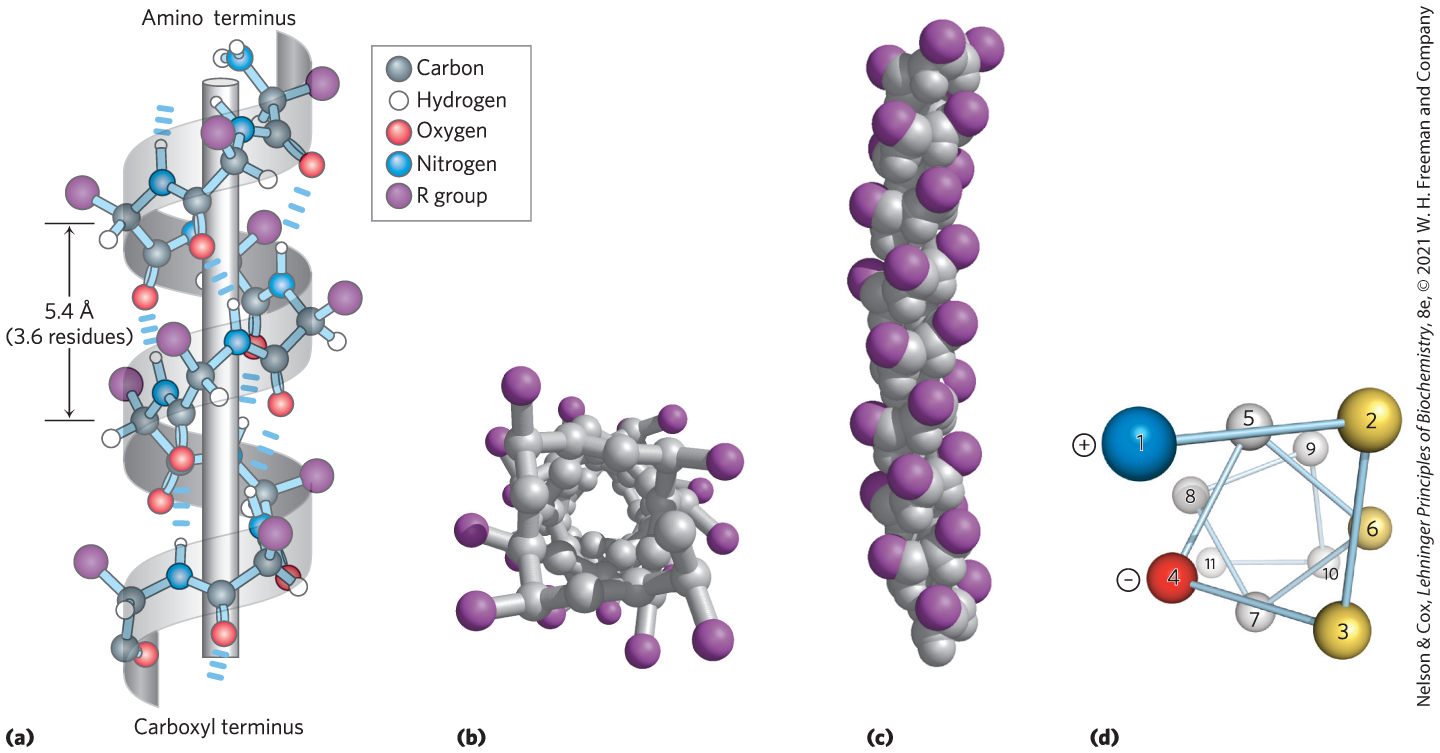
FIGURE 4-3 Models of the α helix, showing different aspects of its structure. (a) Ball-and-stick model showing the intrachain hydrogen bonds. The repeat unit is a single turn of the helix, 3.6 residues. (b) The α helix viewed from one end, looking down the longitudinal axis. Note the positions of the R groups, represented by purple spheres. This ball-and-stick model, which emphasizes the helical arrangement, gives the false impression that the helix is hollow, because the balls do not represent the van der Waals radii of the individual atoms. (c) As this space-filling model shows, the atoms in the center of the α helix are in very close contact. (d) Helical wheel projection of an α helix. This representation can be colored to identify surfaces with particular properties. The yellow residues, for example, could be hydrophobic and conform to an interface between the helix shown here and another part of the same or another polypeptide. The red (negative) and blue (positive) residues illustrate the potential for interaction of oppositely charged side chains separated by two residues in the helix. [(b, c) Data from PDB ID 4TNC, K. A. Satyshur et al., J. Biol. Chem. 263:1628, 1988.]
| Structure | ϕ | ψ |
|---|---|---|
α Helix |
|
|
β Conformation |
||
Antiparallel |
||
Parallel |
||
Collagen triple helix |
|
|
β Turn type I |
||
i + 1a |
|
|
i + 2a |
|
|
β Turn type II |
||
i + 1 |
|
|
i + 2 |
|
|
|
Note: In real proteins, dihedral angles often vary somewhat from these idealized values. aThe i + 1 and i + 2 angles are those for the second and third amino acid residues in the β turn, respectively. |
||
Pauling and Corey considered both right-handed and left-handed variants of the α helix. The subsequent elucidation of the three-dimensional structure of myoglobin and other proteins showed that the right-handed α helix is the common form (Box 4-1). Extended left-handed α helices are theoretically less stable and have not been observed in proteins. The α helix proved to be the predominant structure in α-keratins. More generally, about one-fourth of all amino acid residues in proteins are found in α helices, the exact fraction varying greatly from one protein to another.
Why does the α helix form more readily than many other possible conformations? The answer lies, in part, in its optimal use of intrahelical hydrogen bonds. The structure is stabilized by a hydrogen bond between the hydrogen atom attached to the electronegative nitrogen atom of a peptide linkage and the electronegative carbonyl oxygen atom of the fourth amino acid on the amino-terminal side of that peptide bond (Fig. 4-3a). Within the α helix, every peptide bond (except those close to each end of the helix) participates in such hydrogen bonding. Each successive turn of the α helix is held to adjacent turns by three to four hydrogen bonds, conferring significant stability on the overall structure. At the ends of an α-helical segment, there are always three or four amide carbonyl or amino groups that cannot participate in this helical pattern of hydrogen bonding. These may be exposed to the surrounding solvent, where they hydrogen-bond with water, or other parts of the protein may cap the helix to provide the needed hydrogen-bonding partners.
WORKED EXAMPLE 4-1 Secondary Structure and Protein Dimensions
What is the length, in both Å and nm, of a polypeptide with 80 amino acid residues in a single, continuous α helix?
SOLUTION:
An idealized α helix has 3.6 residues per turn, and the rise along the helical axis is 5.4 Å. Thus, the rise along the axis for each amino acid residue is 1.5 Å. The length of the polypeptide is therefore or 12 nm
Amino Acid Sequence Affects Stability of the α Helix
Not all polypeptides can form a stable α helix. Each amino acid residue in a polypeptide has an intrinsic propensity to form an α helix, reflecting the properties of the R group and how they affect the capacity of the adjoining main-chain atoms to take up the characteristic ϕ and ψ angles. Alanine shows the greatest tendency to form α helices in most experimental model systems.
The position of an amino acid residue relative to its neighbors is also important. Interactions between amino acid side chains can stabilize or destabilize the α-helical structure. For example, if a polypeptide chain has a long block of Glu residues, this segment of the chain will not form an α helix at pH 7.0. The negatively charged carboxyl groups of adjacent Glu residues repel each other so strongly that they prevent formation of the α helix. For the same reason, if there are many adjacent Lys and/or Arg residues, with positively charged R groups at pH 7.0, they also repel each other and prevent formation of the α helix. The size and shape of Asn, Ser, Thr, and Cys residues can also destabilize an α helix if they are close together in the chain.
The twist of an α helix ensures that critical interactions occur between an amino acid side chain and the side chain three (and sometimes four) residues away on either side of it. This is made clear when the α helix is depicted as a helical wheel (Fig. 4-3d). Positively charged amino acids are often found three residues away from negatively charged amino acids, permitting the formation of an ion pair. Two aromatic amino acid residues are often similarly spaced, resulting in a juxtaposition stabilized by the hydrophobic effect.
A constraint on the formation of the α helix is the presence of Pro or Gly residues, which have the least likelihood of forming α helices. In proline, the nitrogen atom is part of a rigid ring (see Fig. 4-7), and rotation about the bond is not possible. Thus, a Pro residue introduces a destabilizing kink in an α helix. In addition, the nitrogen atom of a Pro residue in a peptide linkage has no substituent hydrogen to participate in hydrogen bonds with other residues. For these reasons, proline is found only rarely in an α helix. Glycine occurs infrequently in α helices for a different reason: it has more conformational flexibility than the other amino acid residues. Polymers of glycine tend to take up coiled structures quite different from an α helix.
A final factor affecting the stability of an α helix is the identity of the amino acid residues near the ends of the α-helical segment of the polypeptide. A small electric dipole exists in each peptide bond (Fig. 4-2a). These dipoles are aligned through the hydrogen bonds of the helix, resulting in a net dipole along the helical axis that increases with helix length (Fig. 4-4). The partial positive and negative charges of the helix dipole reside on the peptide amino and carbonyl groups near the amino-terminal and carboxyl-terminal ends, respectively. For this reason, negatively charged amino acids are often found near the amino terminus of the helical segment, where they have a stabilizing interaction with the positive charge of the helix dipole; a positively charged amino acid at the amino-terminal end is destabilizing. The opposite is true at the carboxyl-terminal end of the helical segment.
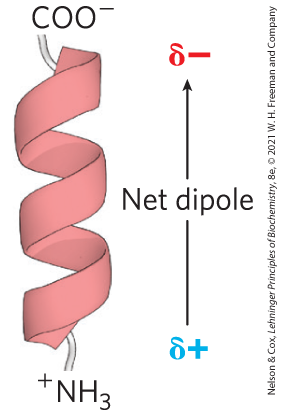
FIGURE 4-4 Helix dipole. The electric dipole of a peptide bond (see Fig. 4-2a) is transmitted along an α-helical segment through the intrachain hydrogen bonds, resulting in an overall helix dipole.
In summary, five types of constraints affect the stability of an α helix: (1) the intrinsic propensity of an amino acid residue to form an α helix; (2) the interactions between R groups, particularly those spaced three (or four) residues apart; (3) the bulkiness of adjacent R groups; (4) the occurrence of Pro and Gly residues; and (5) interactions between amino acid residues at the ends of the helical segment and the electric dipole inherent to the α helix. The tendency of a given segment of a polypeptide chain to form an α helix therefore depends on the identity and sequence of amino acid residues within the segment.
The β Conformation Organizes Polypeptide Chains into Sheets
In 1951, Pauling and Corey predicted a second type of repetitive structure, the β conformation. This is a more extended conformation of polypeptide chains, and its structure is again defined by backbone atoms arranged according to a characteristic set of dihedral angles (Table 4-1). In the β conformation, the backbone of the polypeptide chain is extended into a zigzag rather than helical structure (Fig. 4-5). A single protein segment in the β conformation is often called a β strand. The arrangement of several strands side by side, all in the β conformation, is called a β sheet. The zigzag structure of the individual polypeptide segments gives rise to a pleated appearance of the overall sheet. Hydrogen bonds form between backbone atoms of adjacent segments of polypeptide chain within the sheet. The individual segments that form a β sheet are usually nearby on the polypeptide chain but can also be quite distant from each other in the linear sequence of the polypeptide; they may even be in different polypeptide chains. The R groups of adjacent amino acids protrude from the zigzag structure in opposite directions, creating the alternating pattern seen in the side view in Figure 4-5.
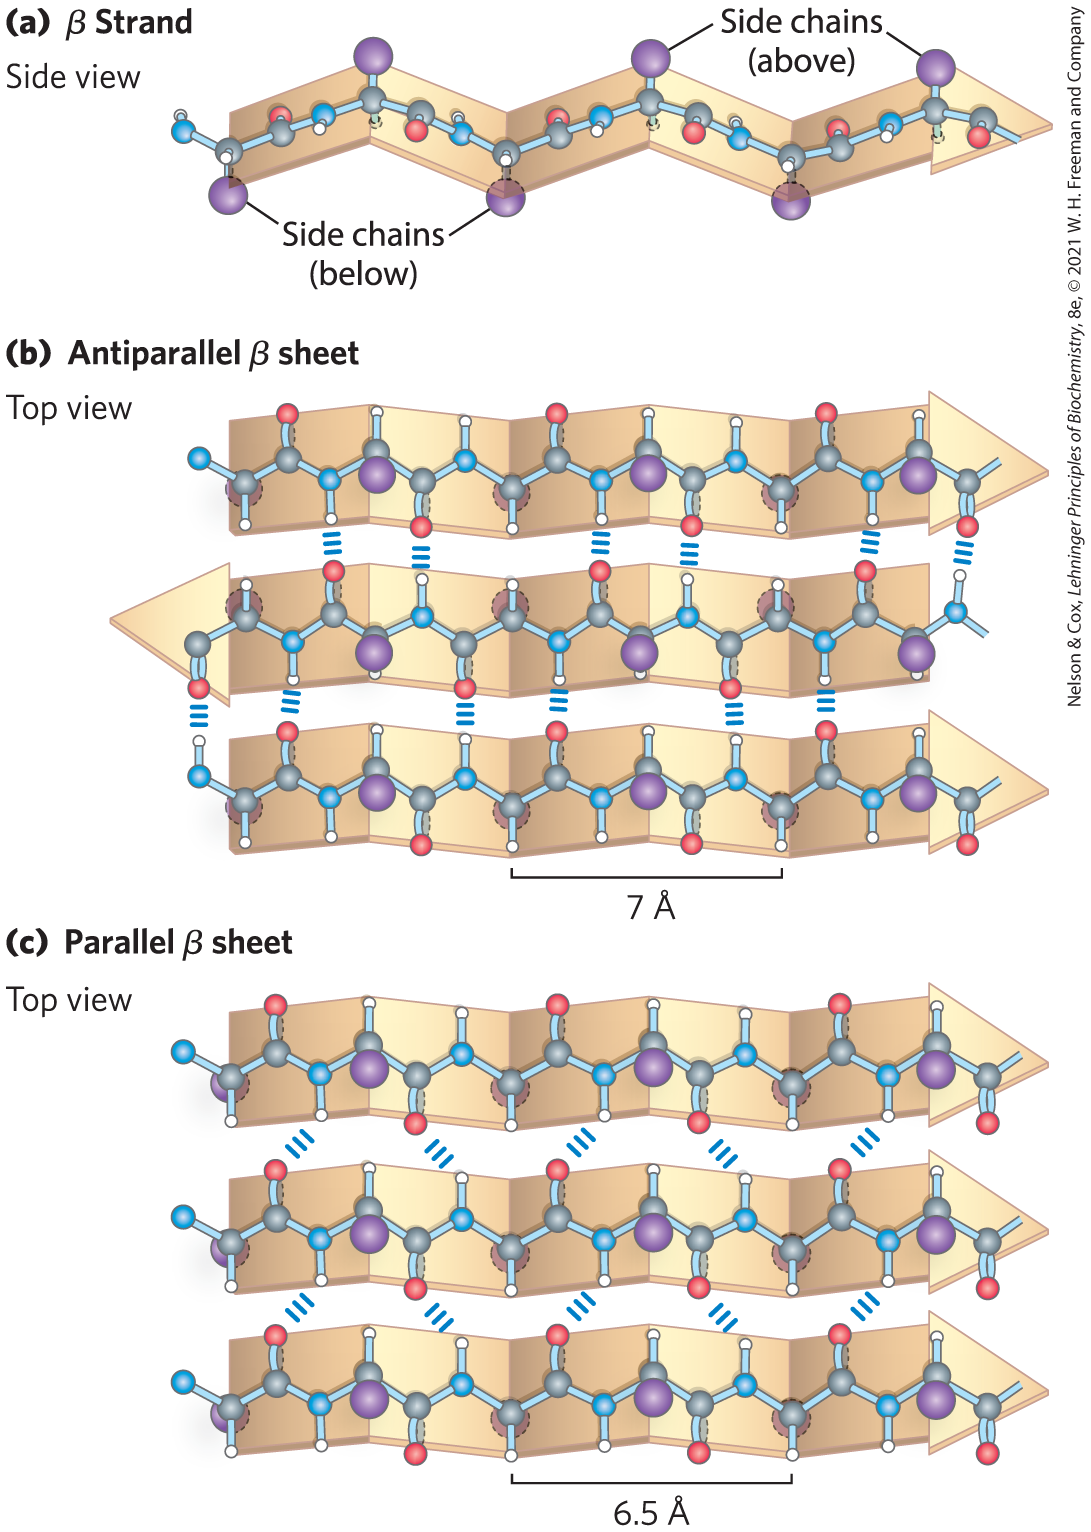
FIGURE 4-5 The β conformation of polypeptide chains. These (a) side and (b, c) top views reveal the R groups extending out from the β sheet and emphasize the pleated shape formed by the planes of the peptide bonds. (An alternative name for this structure is β-pleated sheet.) Hydrogen-bond cross-links between adjacent chains are also shown. The amino-terminal to carboxyl-terminal orientations of adjacent chains (arrows) can be the opposite or the same, forming (b) an antiparallel β sheet or (c) a parallel β sheet.
The adjacent polypeptide chains in a β sheet can be either parallel or antiparallel (having the same or opposite amino-to-carboxyl orientations, respectively). The structures are somewhat similar, although the repeat period is shorter for the parallel conformation (6.5 vs. 7.0 Å for antiparallel) and the hydrogen-bonding patterns are different. The interstrand hydrogen bonds are essentially in-line (see Fig. 2-5) in the antiparallel β sheet, whereas they are distorted or not in-line for the parallel variant. In natural proteins, antiparallel β sheets are found twice as frequently as parallel β sheets. The idealized structures exhibit the bond angles given in Table 4-1; these values vary somewhat in real proteins, resulting in structural variation, as seen above for α helices.
β Turns Are Common in Proteins
In globular proteins, which have a compact folded structure, some amino acid residues are in turns or loops where the polypeptide chain reverses direction (Fig. 4-6). These are the connecting elements that link successive runs of α helix or β conformation. Particularly common are β turns that connect the ends of two adjacent segments of an antiparallel β sheet. The structure is a turn involving four amino acid residues, with the carbonyl oxygen of the first residue forming a hydrogen bond with the amino-group hydrogen of the fourth. The peptide groups of the central two residues do not participate in any inter-residue hydrogen bonding. Several types of β turns have been described, each defined by the ϕ and ψ angles of the bonds that link the four amino acid residues that make up the particular turn (Table 4-1). Gly and Pro residues often occur in β turns, the former because it is small and flexible, the latter because peptide bonds involving the imino nitrogen of proline readily assume the cis configuration (Fig. 4-7), a form that is particularly amenable to a tight turn. The two types of β turns shown in Figure 4-6 are the most common. Beta turns are often found near the surface of a protein, where the peptide groups of the central two amino acid residues in the turn can hydrogen-bond with water. Considerably less common is the γ turn, a three-residue turn with a hydrogen bond between the first and third residues.
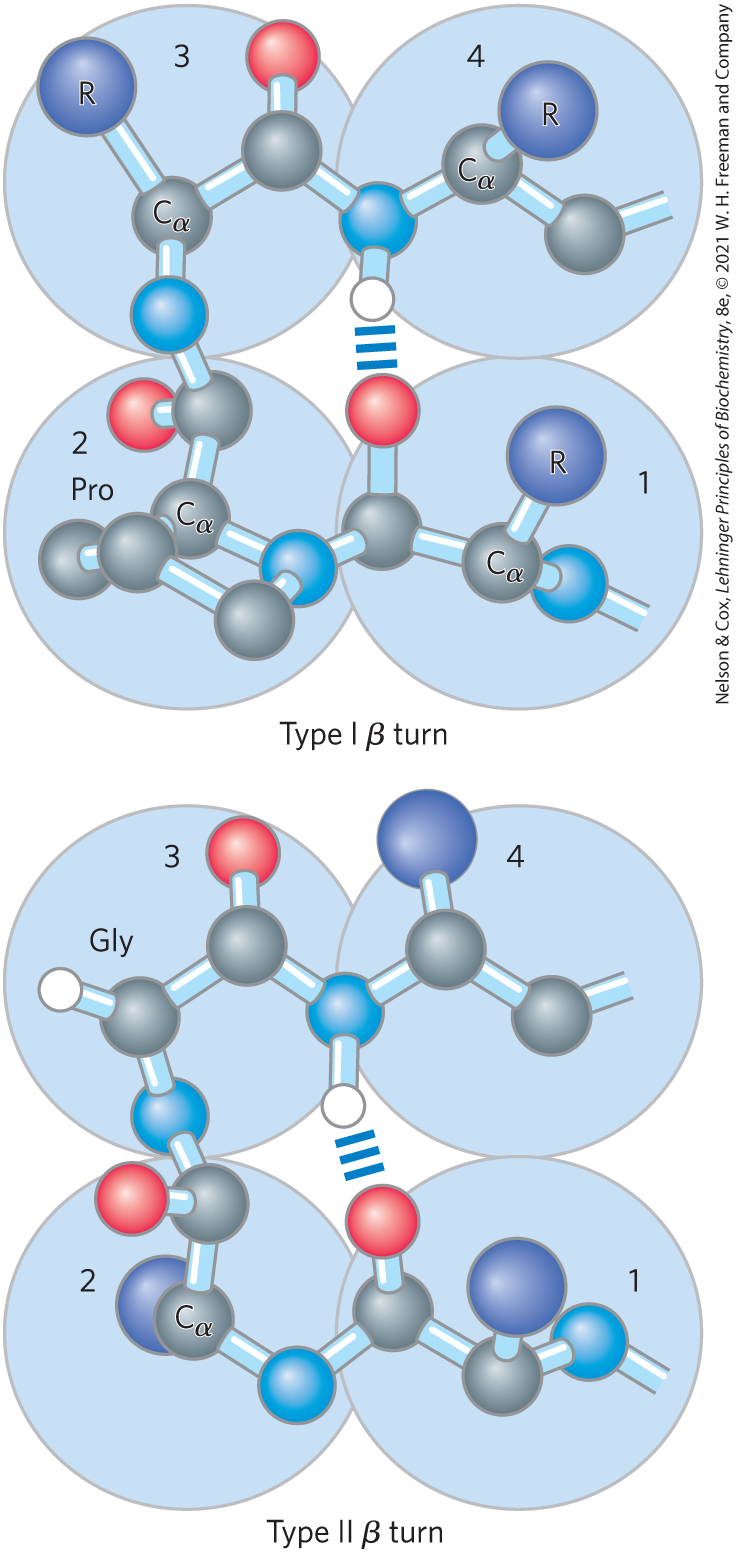
FIGURE 4-6 Structures of β turns. Type I and type II β turns are most common, distinguished by the ϕ and ψ angles taken up by the peptide backbone in the turn (see Table 4-1). Type I turns occur more than twice as frequently as type II. Note the hydrogen bond between the peptide groups of the first and fourth residues of the bends. (Individual amino acid residues are framed by large blue circles. Not all H atoms are shown in these depictions.)
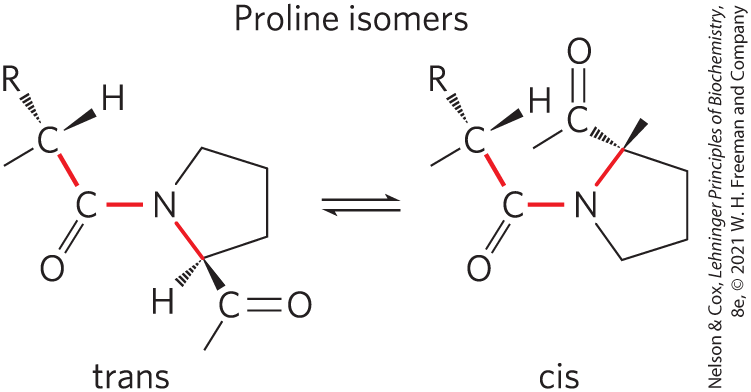
FIGURE 4-7 Trans and cis isomers of a peptide bond involving the imino nitrogen of proline. Of the peptide bonds between amino acid residues other than Pro, more than 99.95% are in the trans configuration. For peptide bonds involving the imino nitrogen of proline, however, about 6% are in the cis configuration; many of these occur at β turns.
Common Secondary Structures Have Characteristic Dihedral Angles
The α helix and the β conformation are the major repetitive secondary structures in a wide variety of proteins, although other repetitive structures exist in some specialized proteins (an example is collagen; see Fig. 4-12). Every type of secondary structure can be completely described by the dihedral angles ϕ and ψ associated with each residue. Ramachandran plots, introduced by G. N. Ramachandran, are useful tools for visualizing all of the ϕ and ψ angles observed in a particular protein structure and are often used to test the quality of three-dimensional protein structures. In a Ramachandran plot, the dihedral angles that define the α helix and the β conformation fall within a relatively restricted range of sterically allowed structures (Fig. 4-8a). Most values of ϕ and ψ taken from known protein structures fall into the expected regions, with high concentrations near the α helix and β conformation values, as predicted (Fig. 4-8b). The only amino acid residue often found in a conformation outside these regions is glycine. Because its side chain is small, a Gly residue can take part in many conformations that are sterically forbidden for other amino acids.
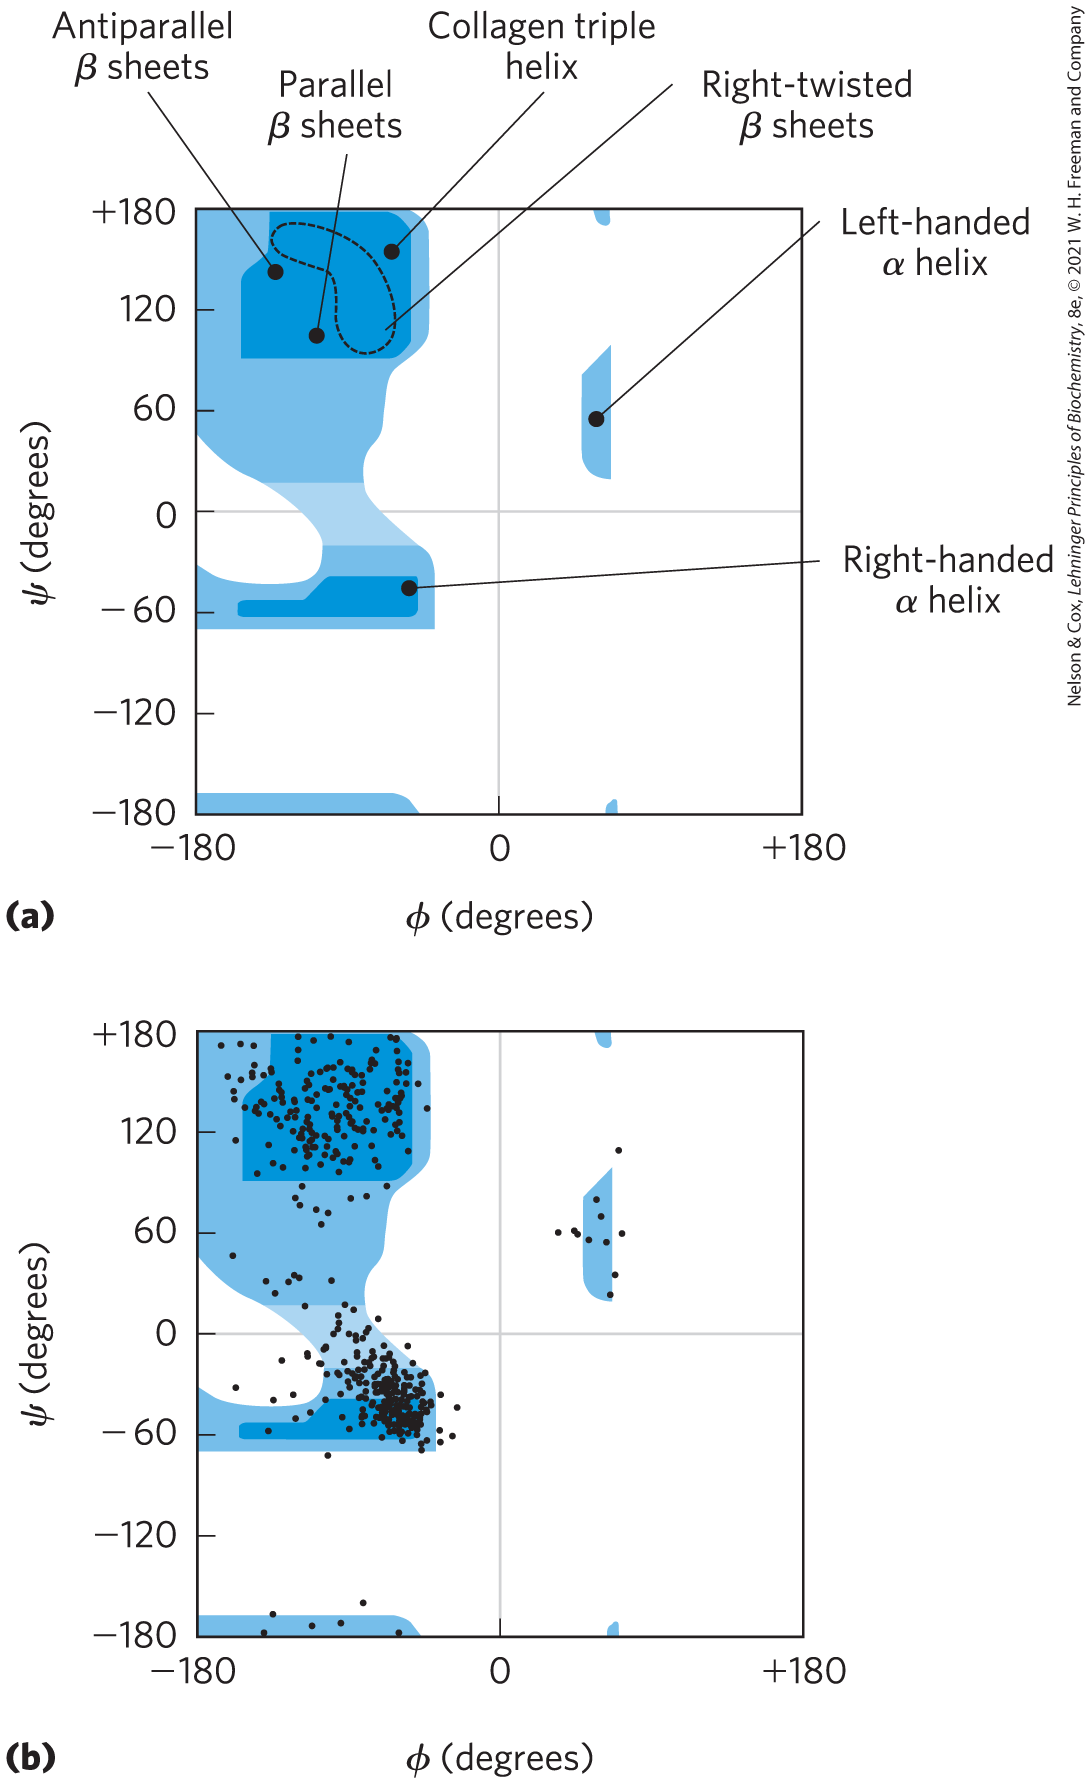
FIGURE 4-8 Ramachandran plots showing a variety of structures. (a) The values of ϕ and ψ for various allowed conformations and secondary structures are shown. Peptide conformations deemed possible are those that involve little or no steric interference, based on calculations using known van der Waals radii and dihedral angles modeled as a hard sphere. Other types of Ramachandran plots make different assumptions. The areas shaded dark blue represent conformations that involve no steric overlap and are thus fully allowed. Medium blue indicates conformations permitted if atoms are allowed to approach each other by an additional 0.1 nm, a slight clash. The lightest blue indicates conformations that are permissible if a very modest flexibility (a few degrees) is allowed in the ω dihedral angle that describes the peptide bond itself (generally constrained to ). The white regions are conformations that are not allowed. Although left-handed α helices extending over several amino acid residues are theoretically possible, they have not been observed in proteins. The asymmetry of the plot results from the l stereochemistry of the amino acid residues. (b) The values of ϕ and ψ for all the amino acid residues except Gly in the enzyme pyruvate kinase (isolated from rabbit) are overlaid on the plot of allowed conformations. The small, flexible Gly residues were excluded because they frequently fall outside the expected (blue) ranges. [(a) Information from T. E. Creighton, Proteins, p. 166. © 1984 by W. H. Freeman and Company. (b) Data from Hazel Holden, University of Wisconsin–Madison, Department of Biochemistry.]
Common Secondary Structures Can Be Assessed by Circular Dichroism
Any form of structural asymmetry in a molecule gives rise to differences in absorption of left-handed versus right-handed circularly polarized light. Measurement of this difference is called circular dichroism (CD) spectroscopy. An ordered structure, such as a folded protein, gives rise to an absorption spectrum that can have peaks or regions with both positive and negative values. For proteins, spectra are obtained in the far UV region (190 to 250 nm). In this region, the light-absorbing entity, or chromophore, is the peptide bond; a signal is obtained when the peptide bond is in a folded environment. The difference in molar extinction coefficients (see Box 3-1) for left-handed and right-handed, circularly polarized light (Δε) is plotted as a function of wavelength. The α helix and β conformations have characteristic CD spectra (Fig. 4-9). Using CD spectra, biochemists can determine whether proteins are properly folded, estimate the fraction of the protein that is folded in either of the common secondary structures, and monitor transitions between the folded and unfolded states.
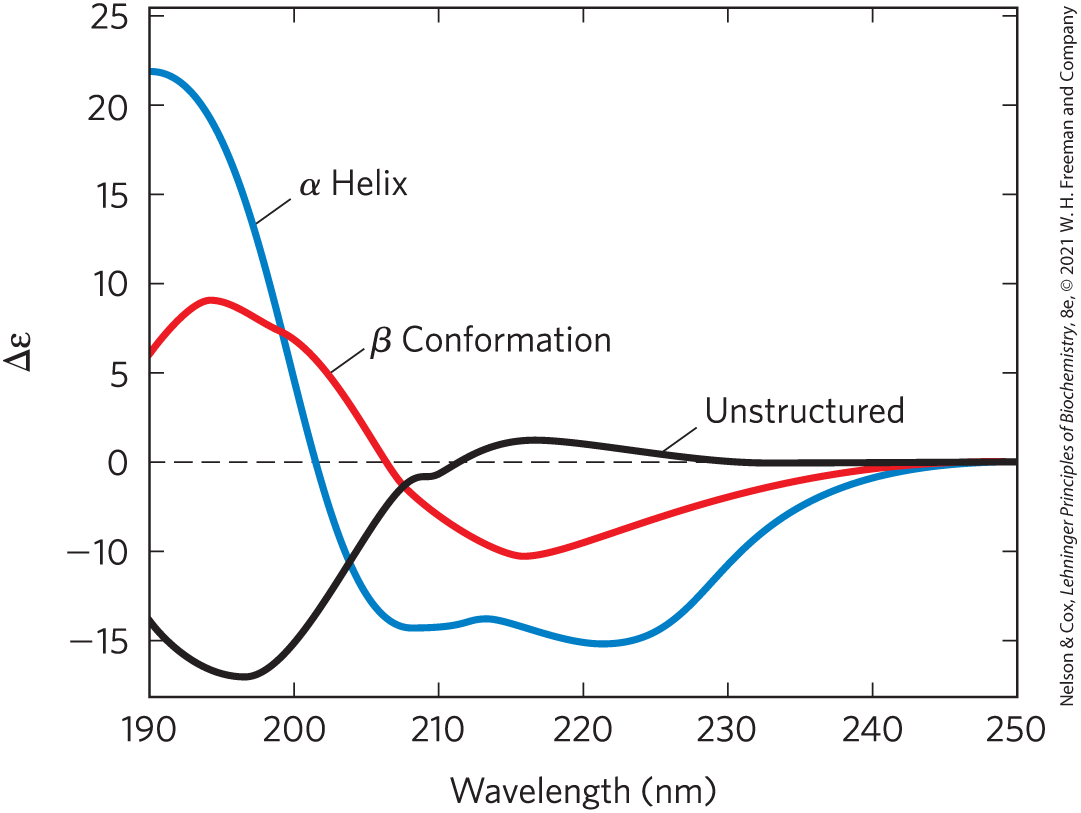
FIGURE 4-9 Circular dichroism spectroscopy. These spectra show polylysine entirely as α helix, as β conformation, or in an unstructured, denatured state. The y axis unit is a simplified version of the units most commonly used in CD experiments. Since the curves are different for α helix, β conformation, and unstructured, the CD spectrum for a given protein can provide a rough estimate for the fraction of the protein made up of the two most common secondary structures. The CD spectrum of the native protein can serve as a benchmark for the folded state, useful for monitoring denaturation or conformational changes brought about by changes in solution conditions.
SUMMARY 4.2 Protein Secondary Structure
- Secondary structure is the local spatial arrangement of the main-chain atoms in a selected segment of a polypeptide chain; it can be completely defined by the ϕ and ψ angles of all the amino acids in that segment.
- In the α helix, the repeating unit is a single helical turn of ∼5.4 Å or 3.6 amino acids. The common form found in proteins is right-handed with the amino acid R groups protruding away from the helical backbone.
- The propensity of a protein segment to form an α helix depends on the composition of its amino acids and amino acid positions relative to one another and relative to the helical dipole.
- In the β conformation, amino acids are extended in a zigzag fashion. When several β strands are arranged adjacent to one another, they can form either parallel or antiparallel β sheets.
- Turns or loops connect segments of α helix or β strands. β turns, which often contain Gly or Pro residues, tend to connect segments of antiparallel β sheets.
- The Ramachandran plot is a visual description of the combinations of ϕ and ψ dihedral angles that are permitted in a peptide backbone and those that are not permitted due to steric constraints. Dihedral angles that define the α helix and the β conformation are found only within certain regions of the plot.
- Circular dichroism spectroscopy is a method for assessing common secondary structure and monitoring folding in proteins based on absorption of circularly polarized UV light.
 Secondary structure is the local spatial arrangement of the main-chain atoms in a selected segment of a polypeptide chain; it can be completely defined by the ϕ and ψ angles of all the amino acids in that segment.