Part 1 : Where is the site of action potential initiation ?
Choose tutorial "Site of Impulse Initiation"
Impulse initiation in response to a depolarizing synaptic input
Click on Reset & Run
that delivers a depolarizing synaptic input to the middle of the dendrite at t = 0.1
To study the movie , click on Continue for ( ms ) in steps of 0.2 ms
Look carefully at the sequence of voltage changes in dendrite , soma , and axon
Note : This simulation uses unmyelinated axon of the squid
In this simulation , Na+ channels are uniformly distributed along the axon
( no Na+ channel clusters at the axon initial segment )
Vertebrates have axon initial segment in both myelinated and unmyelinated axons
Where is the site of action potential initiation ?
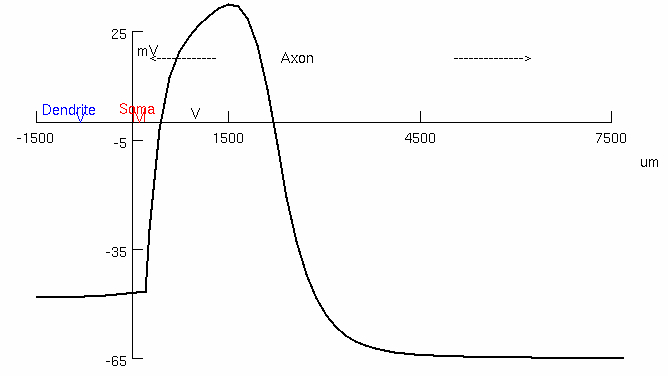
How does the action potential propagate ?
continuously
Change the Na channel densities in the axon
Run the stimulation and use Keep Lines in the Voltage vs Time window
In the Active Axon Parameter panel , halve the Na chan , then run the stimulation
Restore the channel densities to default values
Next , double the Na chan density , then run the stimulation
What happens to the action potential ?
halving = no action potential
doubling = bigger , earlier , faster conduction
Part 2 : How does axon diameter affect conduction velocity ?
Choose tutorial "The Unmyelinated Axon"
Click on Voltage vs Time , Dual Traces
Increase the time base ( Total # ( ms ) ) to 6 ms
Click on Reset & Run
The responses are for the squid giant axon ( diameter 500 μm )
The red trace is the action potential near the site of stimulation and the distance between red and black electrodes is 8 mm
Use the crosshairs to measure the action potential conduction velocity ( m/s )
Red Peak = 1.025 , 38.0981
Black Peak = 1.375 , 41.8389
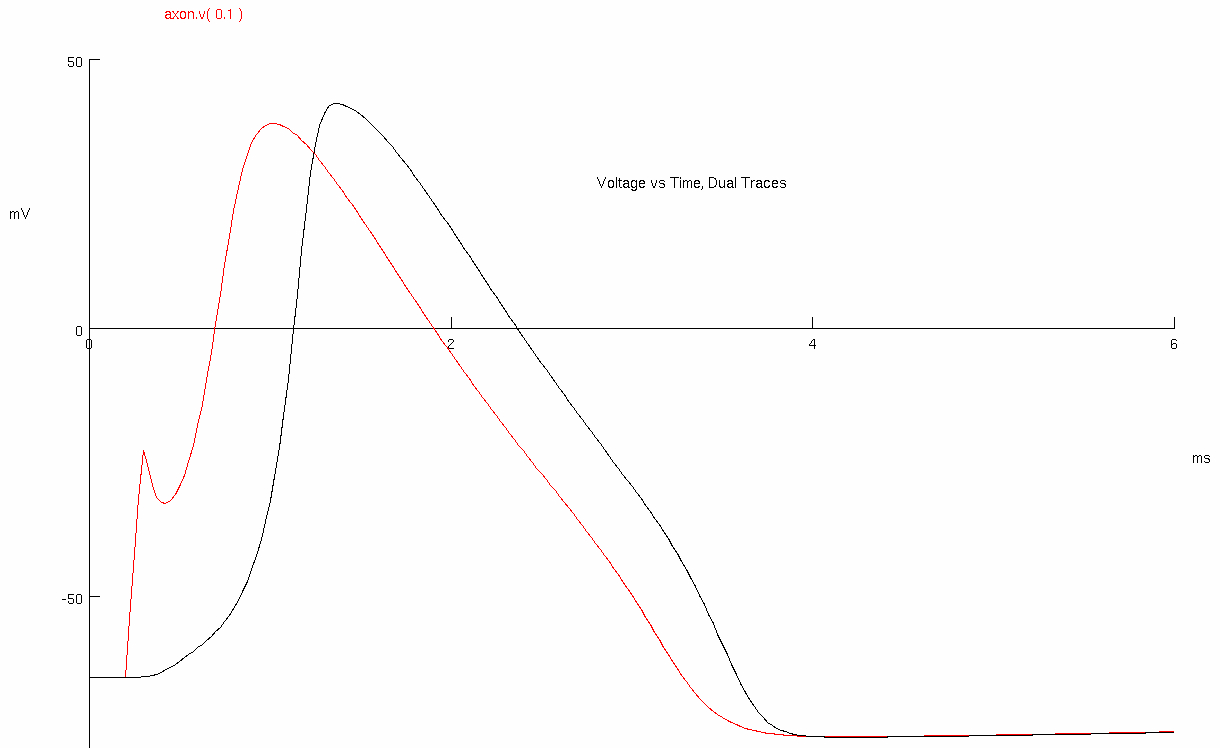
Calculate the action potential conduction velocity ( m/sec ) , and plot the value in the graph below
asdf
Squid thinner axon , unmyelinated axon
Decrease the diameter ( Axon Parameters ) and current amplitude ( IClamp ) as follows :
Click on Reset & Run for each
Reducing current amplitude will offset the changes made to passive properties induced by the reduction in axon diameter so that the stimulus artifact isn’t too big
Calculate the conduction velocity ( m/s ) for each , and plot the value in the graph below
Diameter Amperes Red Black 400 15000 1 1.45 300 10000 1 1.55 200 5000 1.05 1.825 100 2500 0.95 2.2 50 1000 0.975 2.9 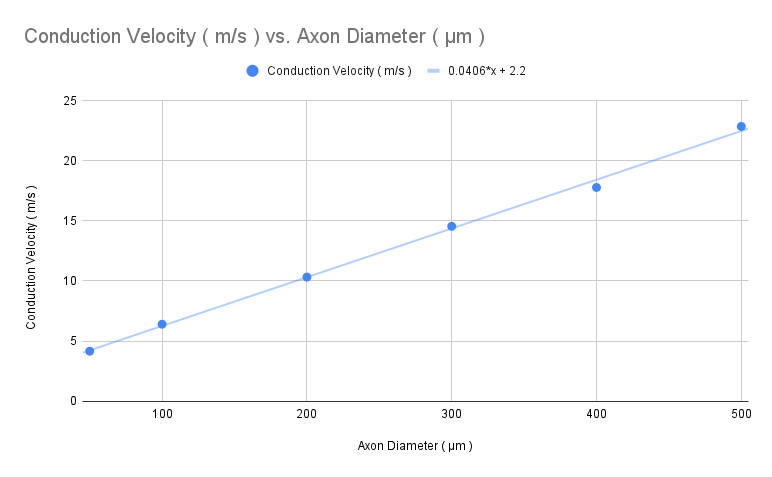
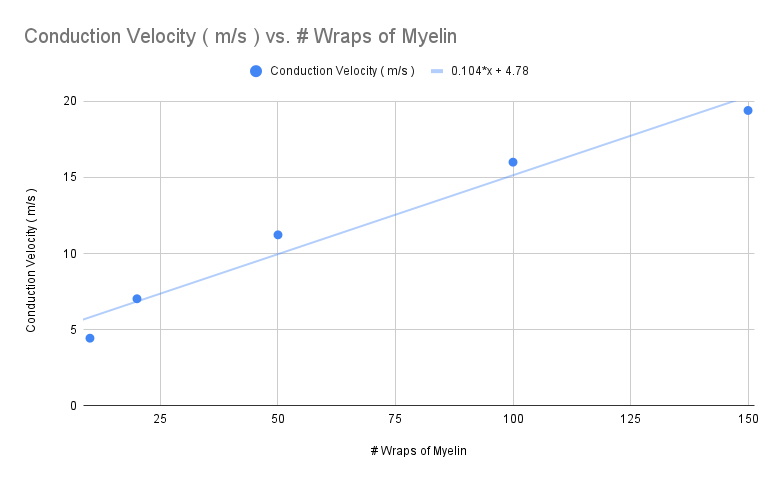
Part 3 : How does myelin thickness affect conduction velocity ?
Typical frog myelin
Choose tutorial "The Myelinated Axon"
Click on Voltage vs Time , Dual Traces
Increase the time base ( Total # ( ms ) ) to 3.0 ms
Click on Reset & Run
The responses are for a frog axon with a diameter of 10 μm
This simulated axon has ten myelinated regions with 150 wraps of myelin
Each myelinated region is 1 mm long
The nodes of Ranvier between each myelinated region are 3.2 μm long
The red trace is the action potential at the first node and the black trace is the action potential at the 9th node , approximately 8 mm further along the axon
Calculate the action potential conduction velocity ( m/sec ) , and plot the value in the graph below
Red Peak = 0.325 , 35.0446
electrode-1 is at
Black Peak = 0.7375 , 36.6867
electrode-9 is at
Thinner Myelin
Decrease the number of myelin wraps to 100 , 50 , 20 , and then 10
Calculate the conduction velocity ( m/s ) for each , and plot the value in the graph below
100 =
50 =
20 =
10 =
What happened with 10 wraps of myelin? What might have caused this to occur ?
not enough resistance provided , therefore very slow
Thicker Myelin
Increase the number of myelin wraps to 200 , 250 , 300 , 400 , 500 , 600 , and then 800
Calculate the conduction velocity ( m/s ) for each , and plot the value in the graph below
200 =
250 =
300 =
400 =
500 =
600 =
800 =
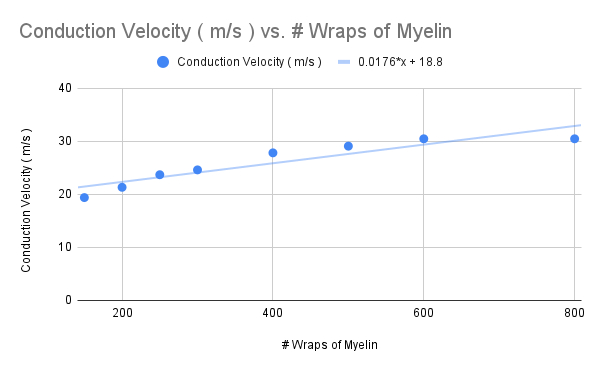
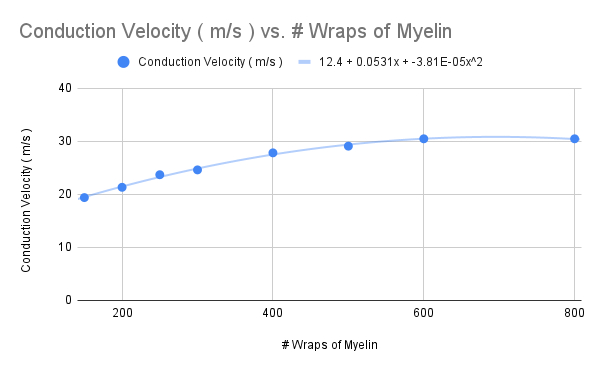
How does the slope of the graph change ?
decreased slope
Part 4 : How does demyelination affect nerve conduction ?
The preparation is :
left half = demyelinated
right half = myelinated
5 node / myelinated internode pairs ( figure )
For demyelinated axon , this simulation uses ion channel densities in normal unmyelinated axon.
Actual demyelinated axon properties ( ion channel isoforms , distribution , density , etc. ) are different from this simulation , and are not fully understood
Stimulate the left end of the demyelinated ( bare axon )
Choose tutorial "Partial Demyelination"
Click on Reset & Run
This will stimulate left end of the bare half of the axon.
In the Voltage-vs-Time graph , look carefully at the traces of voltage changes at the center of the bare half of the axon ( red ) , at the first node of myelinated portion ( blue ) , and the right end of the preparation ( black )
To slow down the process , click on Reset ( mV ) , then repeatedly click on Continue for ( ms ) in steps of 0.2 ms
How does the action potential propagate ?
as soon as it gets to the internode , the propagation stops
Stimulate the right end of the myelinated axon
This simulation is more relevant to the actual conditions in demyelinating diseases
Close the Stimulus Control ( Axon ) panel to avoid generating impulses at both ends
Press "Stimulus 'Trode in Node[4]" in Panel & Graph Manager to insert stimulating electrode at the right most node of the myelinated region.
Click on Reset & Run
What happens to the action potential ?
won't propagate going left into the bare axon region
conduction block
What changes in demyelinated axons will improve conduction? ( Na channels )
This simulation modifies axon parameters in demyelinated region.
Continue from simulation 4.2
Launch the Bare Axon Parameters panel
Change the density of functional Na channels.
By how much must you change the density to enable invasion of the bare axon ? Increase or decrease ?
increase by
What changes in demyelinated axons will improve conduction? ( K channels ) Similarly , change the density of functional K channels.
decrease by