You have just completed making several figures illustrating a series of your experiments.
using the ratio-metric
-sensitive fluorophore Fura-2 measure changes in cytosolic
during receptor-mediated activation of lacrimal gland cells But unfortunately you have misplaced the information concerning when chemicals were added to the bathing solutions
But you do remember that methacholine is a muscarinic cholinergic receptor agonist
You plan to enlist the help of your N&P Study Group to refresh your memory by using their combined physio-logic.
The List of Chemicals Used Was :
methacholine ( MeCh )
muscarinic receptor agonist
stimulates Gq-coupled receptors , leading to IP3-mediated calcium release from ER
atropine ( Atr )
muscarinic receptor antagonist
blocks MeCh's effect by preventing receptor activation
inositol triphosphate ( IP3 )
second messenger that binds to IP₃ receptors on the ER ,
causing Ca²⁺ release into the cytoplasm
Ca²⁺ channel blocker
used to inhibit store-operated Ca²⁺ entry ( SOCE ) across the plasma membrane
thapsigargin ( TSG )
SERCA pump inhibitor
which blocks ER Ca²⁺ reuptake ,
causing ER Ca²⁺ depletion and activation of SOCE
EGTA
A Ca²⁺ chelator
high selectivity for Ca²⁺ over Mg²⁺
used to buffer extracellular Ca²⁺ and limit its effects
ionomysin ( Iono )
calcium ionophore that facilitates Ca²⁺ transport across membranes ,
raising intracellular Ca²⁺ levels independently of receptors
heparin
used intracellularly as an IP₃ receptor antagonist ,
blocking Ca²⁺ release from the ER by preventing IP₃ binding
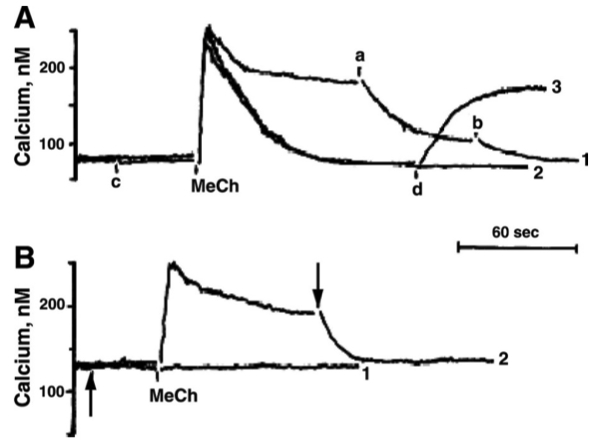
Fig. 1. Methacholine (MeCh)-induced Ca++ release and Ca++ influx
Each trace represents the time course of the
A: MeCh-elicited
B: Addition of a drug at the arrows indicated abolished the MeCh-elicited
In Figure 1A , the additions at time points
Initial Spike = intracellular calcium
Plateau = extracellular calcium
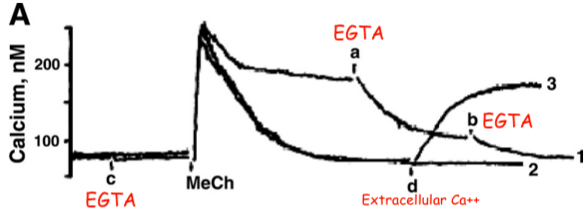
Extracellular
was present during only some of the traces in Figure 1A. ( ok )
In Figure 1B , the same chemical was added to each trace ( at the points indicated by arrows ). Was extracellular
yes , extracellular was present
there is still a sustained plateau after the initial spike
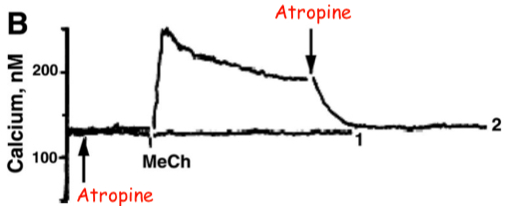
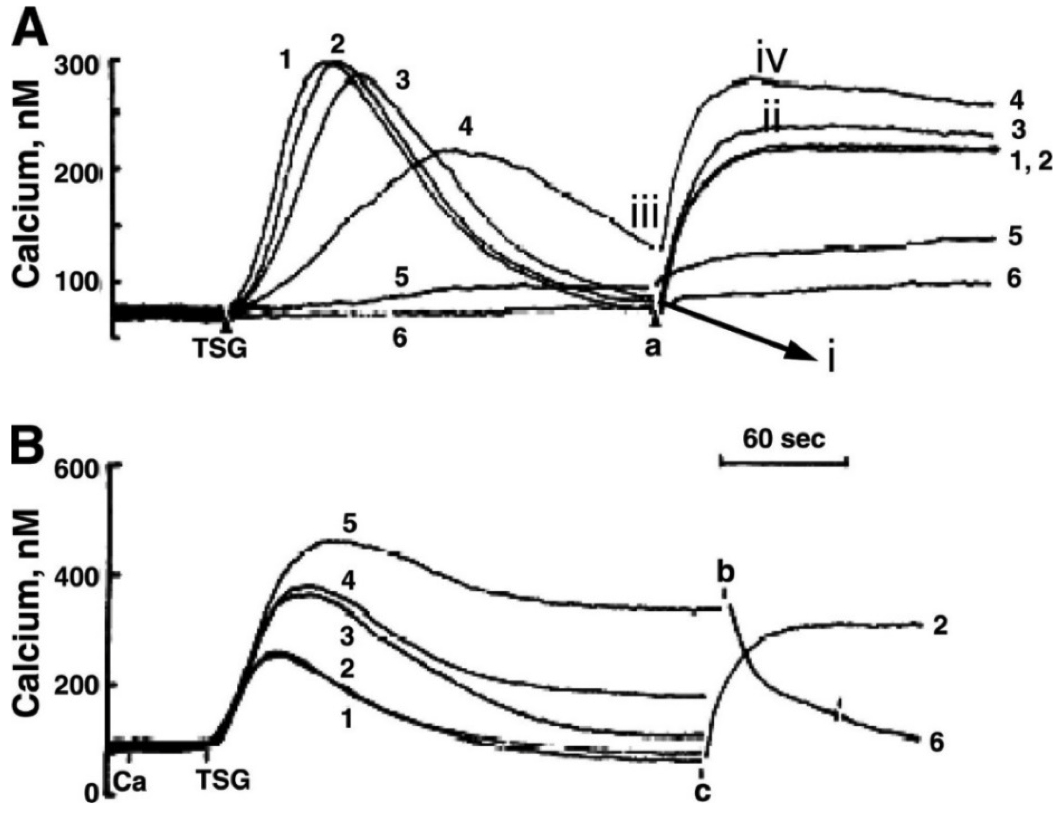
Fig. 2. Thapsigargin (TSG)-induced Ca++ release and Ca++ influx
A: TSG-induced
The range of TSG concentrations used was from 0.0 µM to 1.0 µM , which correspond to traces 1 through 6
B: TSG responses with varying extracellular
The
0.3 mM in trace 3
1.0 mM in trace 4
3.0 mM in trace 5
Extracellular
EGTA was present in trace 1 only.
In Figure 2 the additions at points a , b , and c were either
Time-Point-A = calcium added
Time-Point-B = EGTA added
Time-Point-C = extracellular calcium added
In Figure 2A , a specific TSG concentration ( 0.0 ; 0.01 ; 0.03 ; 0.3 ; 0.7 ; or 1.0 µM ) was added for each trace , 1 through 6. Match each concentration to the trace number.
blocking calcium export , results in high levels of intracellular calcium
Trace 1 = 1.0 µM
Trace 2 = 0.7 µM
Trace 3 = 0.3 µM
Trace 4 = 0.03 µM
Trace 5 = 0.01 µM
Trace 6 = 0.0 µM
calcium wasn't depleted , so ORI never reached out to STIM
it only connects if calcium is low in the ER
In Figure 2A , the TSG-induced
TSG is a SERCA pump inhibitor
so calcium is never removed from cytosol and stored in ER
Trace 4 we thought had lower amount of TSG ( 0.03 µM ) ,
so its not going to inhibit SERCA pump
therefore , there should be very little intracellular calcium
So even though it has slower kinetics , when we added calcium back in at Time-Point-A , we see a significant calcium level increase ( SOCE )
In Figure 2B , predict the level of
Trace 1 and 2 = no influx
Trace 3 = small influx
Trace 4 = moderate influx
If you added extra extracellular calcium at Time-Point-C ,
then trace 2 would take a very long time to return to baseline
trace 6 would also plateau more , instead of declining
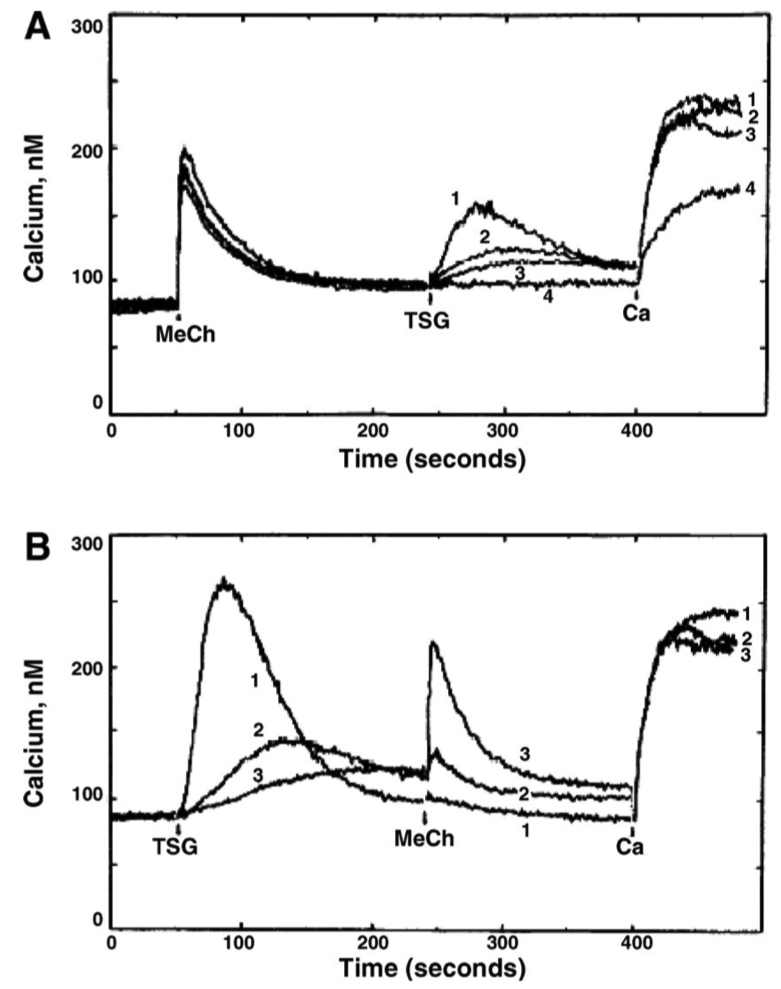
Fig. 3. Endoplasmic reticulum (ER) Ca++ stores accessible to MeCh and TSG
A: Following MeCh-induced
Extracellular
B:
Extracellular
In Figure 3A-B , match the TSG concentration ( 0.0 , 0.015 , 0.03 , 1.0 µM ) with traces 1 through 4
Panel A :
Trace 1 = 1.0 µM
Trace 2 = 0.03 µM
Trace 3 = 0.015 µM
Trace 4 = 0.0 µM
Panel B :
Trace 1 = 1.0 µM
Trace 2 = 0.03 µM
Trace 3 = 0.015 µM
In Figure 3A , what caused the response to extracellular
Trace 4 had zero TSG
so ER calcium stores were never depleted
therefore STIM / ORAI were never activated
so even after adding extracellular calcium , there is little flux
In Figure 3B , what caused the amplitudes of the MeCh-induced
High amounts of TSG ➡️ fully deplete ER calcium ➡️ no calcium left for MeCH to release
Low amounts of TSG ➡️ ER calcium available ➡️ MeCH response
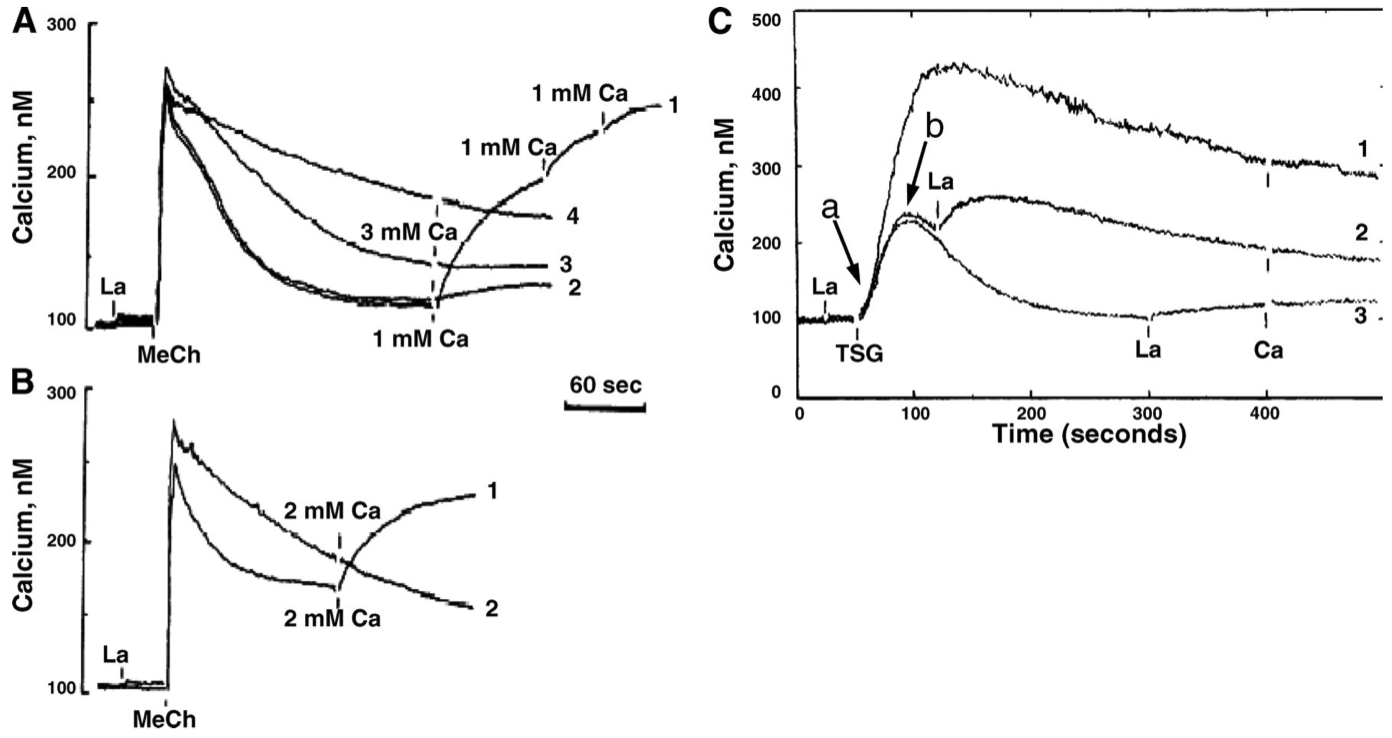
Fig. 4. Dual actions of La+++ on MeCh-induced and TSG-induced Ca++ responses.
A: MeCh-elicited
In traces 2 through 4 , extracellular
B: Comparison of MeCh-elicited responses in 1 mM extracellular
followed by addition of
C: Action of
How does
blocks calcium influx by competing with calcium entry
slows calcium efflux by inhibiting PMCAs
In Figure 4A , in which traces was
Trace 1 = 0.0 µM || Zero
Trace 2 = 0.03 µM || Lowest
Trace 3 = 0.2 µM || Intermediate
Trace 4 = 0.5 µM || Highest
In Figure 4A , what caused traces 3 and 4 to have slower
the high amount of
reducing calcium export
this exaggerates the plateau on the trace
In Figure 4B , what caused the observed response in trace 2 to addition of 2 mM
In Figure 4C , what led to the difference in the responses for traces 1 through 3 when
the earlier they add
when they add it at the later times , calcium has more of a chance to exit internal storage locations
In Figure 4C , predict the
Time-Point-A :
Time-Point-B :
SOCE is partially blocked still , so it looks more like Trace 3