• You’ve become interested in the Na+/Ca+2 -exchanger and its orientation of flow during the action potential in mammalian cardiac muscle cells.

  • You begin by assuming that the resting condition ( between action potentials ) has the following properties ( based on reported findings ) :

    • [ Na+ ]e=145 mM

    • [ Na+ ]i=8 mM

    • [ Ca+2 ]e=1.2 mM

    • [ Ca+2 ]i=0.09 μM

    • Vm=82 mV

  • The cardiac action potential leads to increased cytosolic free Ca+2 that promotes contraction.

  • NCK :

    • If ΔuF<0 , then 3 Na in , and 1 Ca out

    • If ΔuF>0 , then 3 Na out , and 1 Ca in

  1. Calculate the driving force for the Na+/Ca+2 -exchanger ( Δμ/F ) during rest

    image-20250330133547488

    ENa=60log10( 1458 )=75.497 mV
    ECa=602log10( 1.21030.09106 )=123.75 mV
    DFNa=( 82 )( 75.497 )=157.50 mV
    DFCa=2( ( 82 )( 123.75 ) )=411.50 mV
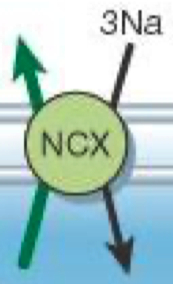
    • we know 3 sodium ions are entering the cytosol for every 1 calcium ion exported

      • we make Ca driving force positive , because its leaving

      • and we make Na negative , because its entering

    DFNa+/Ca+2=( 3( 157.50 ) )+( 1( 411.50 ) )=61 mV
    • you can also do it like this :

      3RTln( [Na]i[Na]o )=1RTln( [Ca]o[Ca]i )
    ΔμF=60log10( ( [ Na+ ]i )3( [ Ca+2 ]o )( [ Na+ ]o )3( [ Ca+2 ]i ) )+Vm
    ΔμF=60log10( ( 8103 )3( 1.2103 )( 145103 )3( 0.09106 ) )+( 82 )=60.994 mV
  2. Mark this value on a sketch plot of driving force ( y-axis ) vs Vm ( x-axis )

    image-20250330154556272


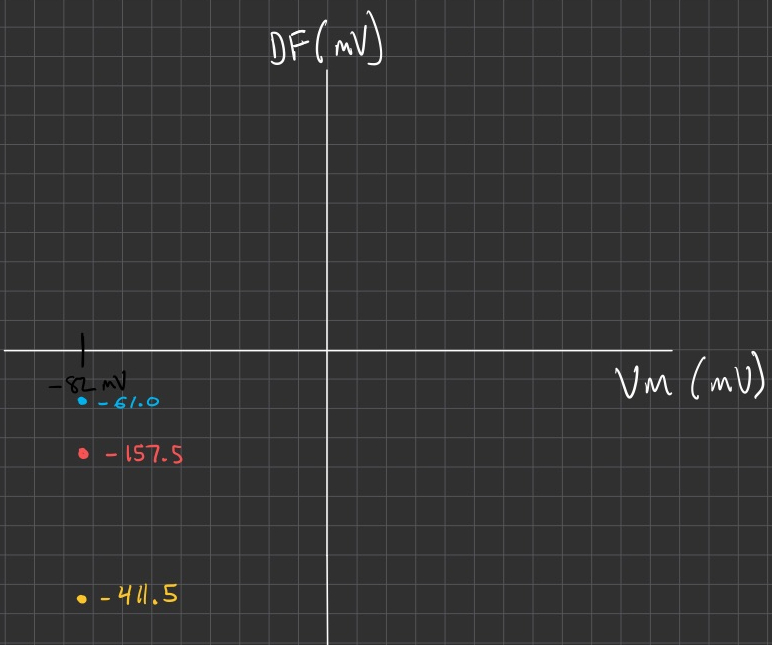
  • The action potential peaks at Vm=+40 mV , then declines to Vm=+35 mV at peak Ca+2

    • with [ Ca+2 ]i=6.5 μM and [ Na+ ]i=12 mM

  1. Calculate the driving force for the exchanger at peak Ca+2

    ΔμF=60log10( ( 12103 )3( 1.2103 )( 145103 )3( 6.5106 ) )+( +35 )=23.818 mV
  2. Calculate the driving force at the peak of the action potential , if only Vm changed

    ΔμF=60log10( ( 8103 )3( 1.2103 )( 145103 )3( 0.09106 ) )+( +40 )=61.006 mV

  • During the action potential plateau :

    • Vm=+20 mV

    • [ Na+ ]i=8 mM

    • [ Ca+2 ]i=0.8 μM

  1. Calculate the driving force for the exchanger at this mid plateau point

    ΔμF=60log10( ( 8103 )3( 1.2103 )( 145103 )3( 0.8106 ) )+( +20 )=15.925 mV

  • At the end of the action potential plateau :

    • Vm=0 mV

    • [ Na+ ]i=8 mM

    • [ Ca+2 ]i=0.5 μM

  1. Calculate the driving force for the exchanger at the end of the plateau

    ΔμF=60log10( ( 8103 )3( 1.2103 )( 145103 )3( 0.5106 ) )+( 0 )=23.677 mV


  2. Using your graph you determine the time period of the action potential during which the Na+/Ca+2 -exchanger produces Ca+2 influx

    • asdf


  • The cardiac glycoside digitalis inhibits the Na+/K+-pump ,

  • If a clinical dose is given , it increases [ Na+ ]i to 12 mM for a new resting condition

  1. Determine how this elevated [ Na+ ]i alters the orientation of exchanger flow during the action potential. ( assume that Vm and [ Ca+2 ]i follow a similar time course as in the absence of the inhibitor )

    • rest :

      ΔμF=60log10((12103)3(1.2103)(145103)3(0.09106))+(82)=29.297 mV
    • action potential peak :

      ΔμF=60log10((12103)3(1.2103)(145103)3(0.09106))+(40)=92.703 mV
    • peak Ca :

      ΔμF=60log10((12103)3(1.2103)(145103)3(6.5106))+(35)=23.818 mV
    • plateau :

      ΔμF=60log10((12103)3(1.2103)(145103)3(0.8106))+(20)=15.772 mV
    • end of plateau :

    ΔμF=60log10((12103)3(1.2103)(145103)3(0.5106))+(0)=8.0191 mV


    • Inhibiting Na+/K+-pump ➡️ increases [ Na+ ]i ➡️ loss of sodium gradient ➡️ driving force to run NCX force becomes less negative ➡️ less calcium export ➡️ more intracellular calcium ➡️ stronger muscle contractions