Part 1 - Changing ACh Receptor Conduction in Membrane
Choose tutorial "The Neuromuscular Junction"
Click on Start the Stimulation
Increase Total # ms to 4 ms
Click on Reset & Run
Keep Lines
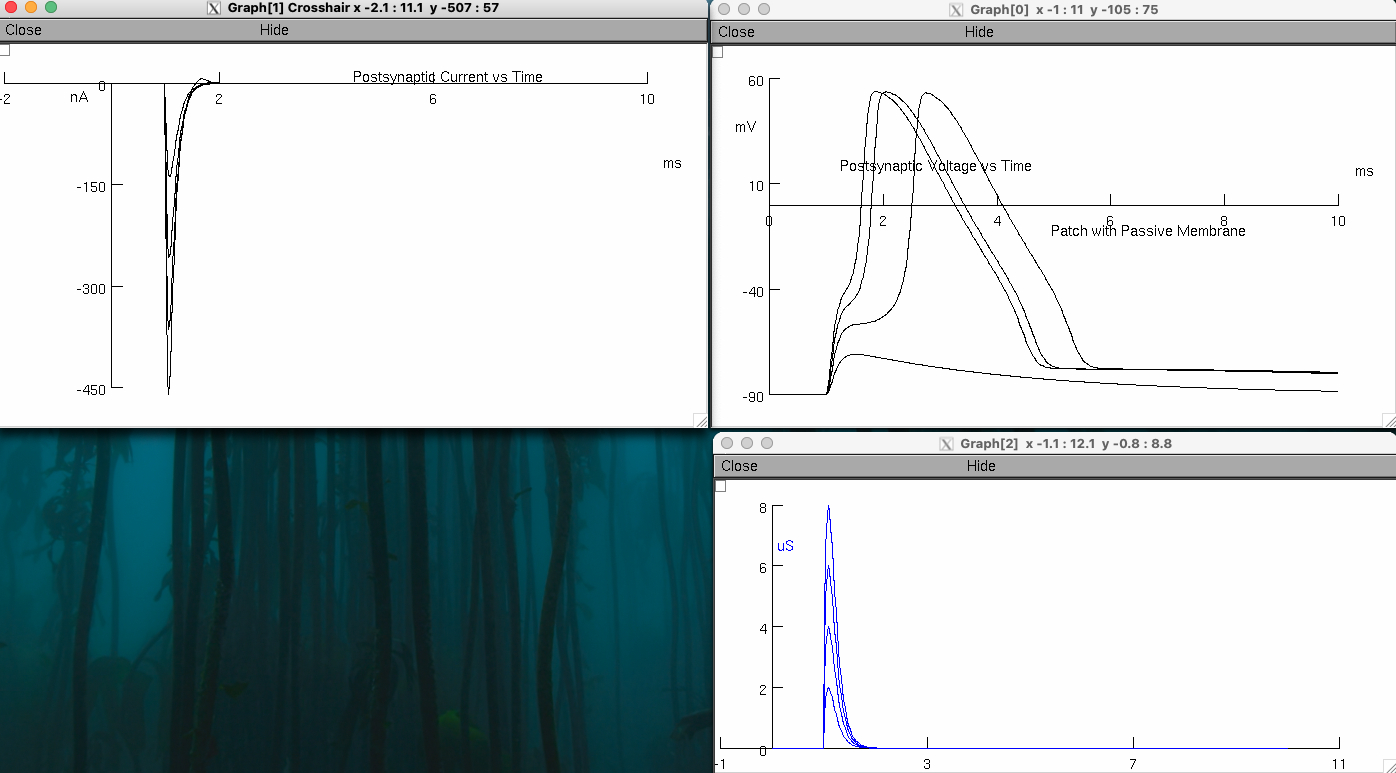
Closely examine the three traces.
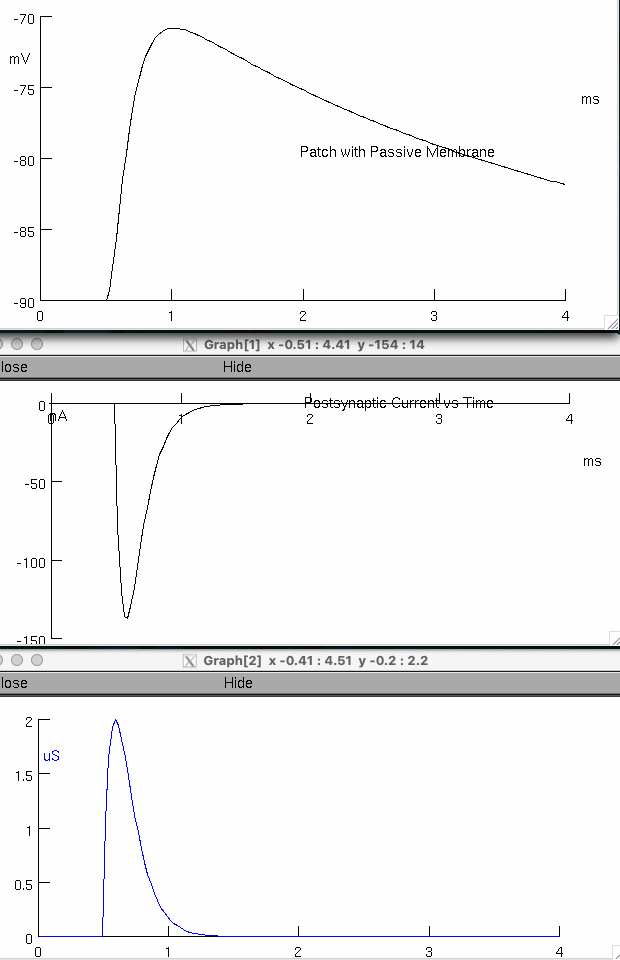
Compare and contrast the differences between them.
Trace Units Shape Details Top ( Voltage ) mV rises , then decays depolarization of the membrane due to ACh binding and causing ion movement Middle ( Current ) nA sharp dip , then rises influx of positive ions ( Na⁺ , K⁺ ) through ACh receptor channels Bottom ( Conductance ) μS rises and falls symmetrically opening and closing of ACh receptor ion channels Explain what might account for some traces going up and others going down.
Voltage : increase = depolarization
Current : inward = negative ( goes down )
Conductance : always positive ( channel opening )
Explain what might account for the differing time courses the voltage and current responses.
Conductance changes first , driven by ACh binding to receptors
Current changes next , closely tracking conductance
Voltage changes last , because its the integration of current over time
"RC properties" of the cell
membrane’s capacitance and resistance
Increase receptor conductance to 5 μS and then to 10 μS ( g max in Alpha Synapse window )
Continue increasing in steps of 10 μS at least up to 60 μS
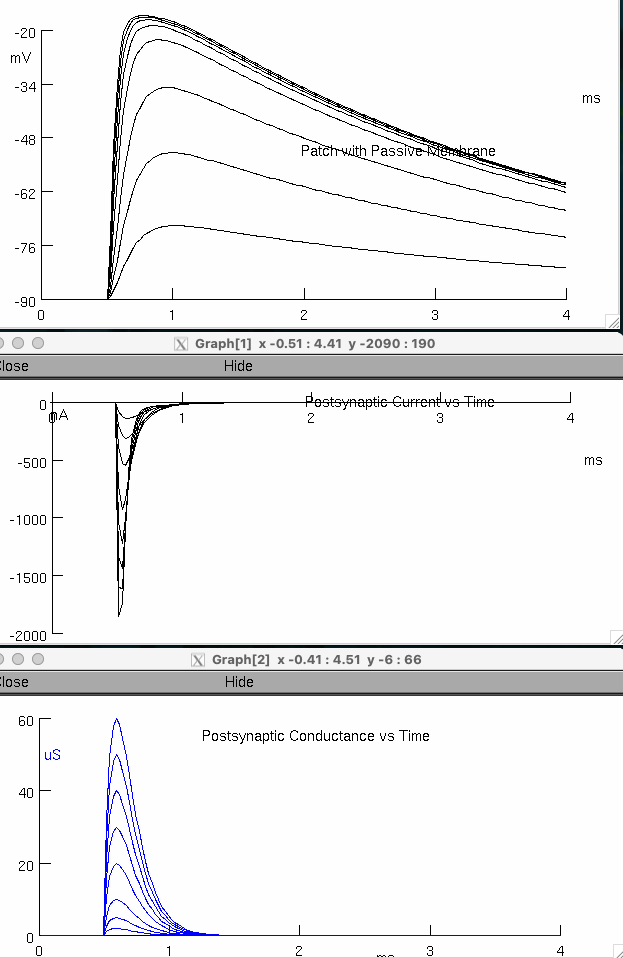
Determine whether voltage and current continue to increase proportionally. Explain briefly.
qualitatively :
but the rate at which they increase levels off after 50 μS
once it gets near the reversal potential , further increasing conductance doesn't really change current and voltage.
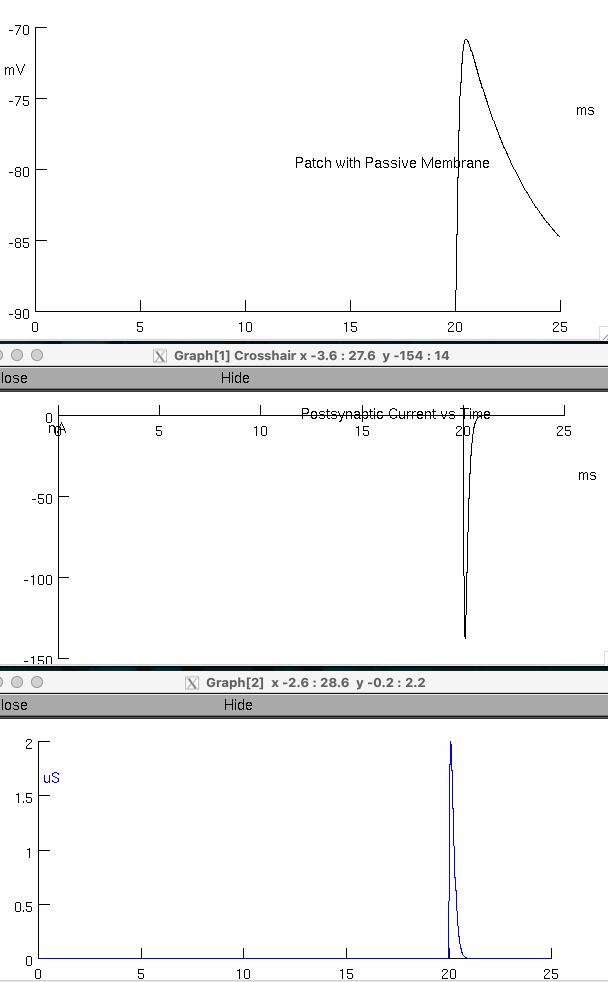
Estimate the half time for current decay. ( try decreasing Total # ms to 1.0 ms )
when
half of that = -927.27 nA , at around 0.57 milliseconds
Part 2 - Action of Changing Membrane Potential on ACh Responses
Erase traces
Change total # ms to 25
In Alpha Synapse panel, change onset to 20 ms
Set g max back to 2 μ Siemens
Keep lines
Reset & Run
Click on Stimulus Control , IClamp
Increase the amplitude of the current pulse in 10 nA increments, at least to 50 nA
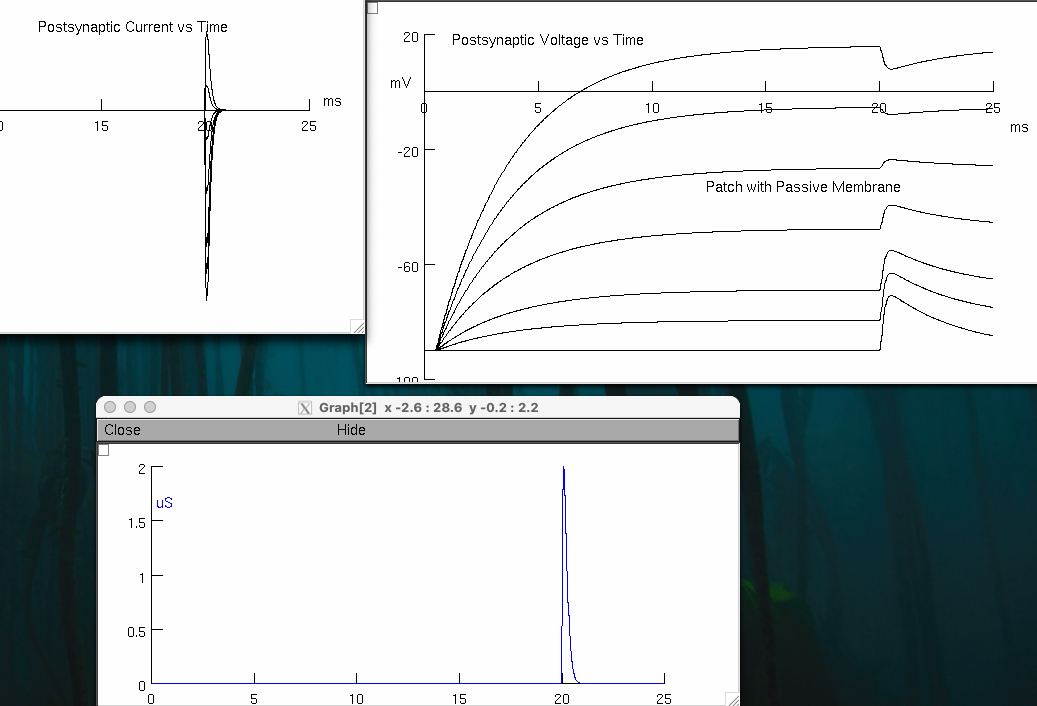
Look at each graph carefully. As you change the injected current , observe what happens to conductance , voltage , and current changes induced by ACh
Conductance :
stays the same for all current injections
Voltage :
at the 20 ms mark , ACh is released , and attempts to move towards the reversal potential of the ACh channel
when we are more negative than the reversal potential , ACh as a positive cation enters the cell , making the membrane potential more positive.
when we are more positive than the reversal potential , ACh as a positive cation leaves the cell , making the membrane potential more negative.
Current Changes Induced by ACh :
smaller ( less negative ) with more injected current
Repeat the experiment in voltage clamp.
Set total # ms back to 2.5 and onset to 1 ms.
Select voltage clamp on the stimulus control
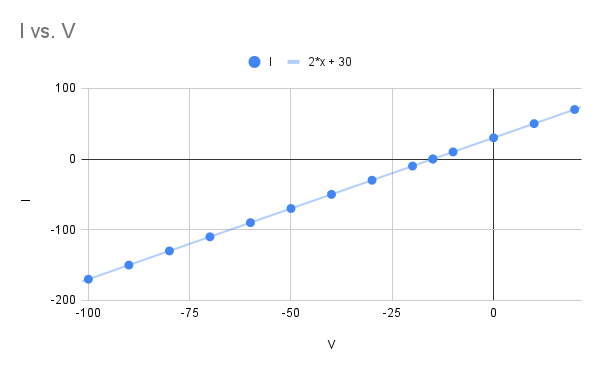
Create an IV plot to determine the reversal potential ( you will need to design the voltage clamp protocol )
Reversal Potential
If the [Na+ ]o = 120mM and [Na+ ]i = 12mM and [K+ ]o = 4mM and [K+ ]i = 110mM, calculate the gNa/gK of the AChR.
so we know
let
therefore ,
and then
or
substituting stuff back in :
factoring :
canceling out
algebra :
Based on the IV plot , determine whether the conductance of AChR is voltage dependent.
its NOT voltage dependent
the conduction fit / trend line is linear
constant conduction
Part 3 - Synaptic Transmission
Close stimulus control
Erase traces
Click “Add HH channels”
In Alpha Synapse panel, begin with g max at 8 μSiemens and gradually decrease it to 2 μS
Explain what happens. ( threshold )
action potential only occurs when the postsynaptic depolarization reaches threshold
this requires a minimum
Indicate the disease that resembles what you have modeled.
Myasthenia Gravis
autoimmune destruction of AChRs
with fewer AChRs ,