Part 1 - Measuring Propagation Parameters
Describe how membrane potential varies along an axon.
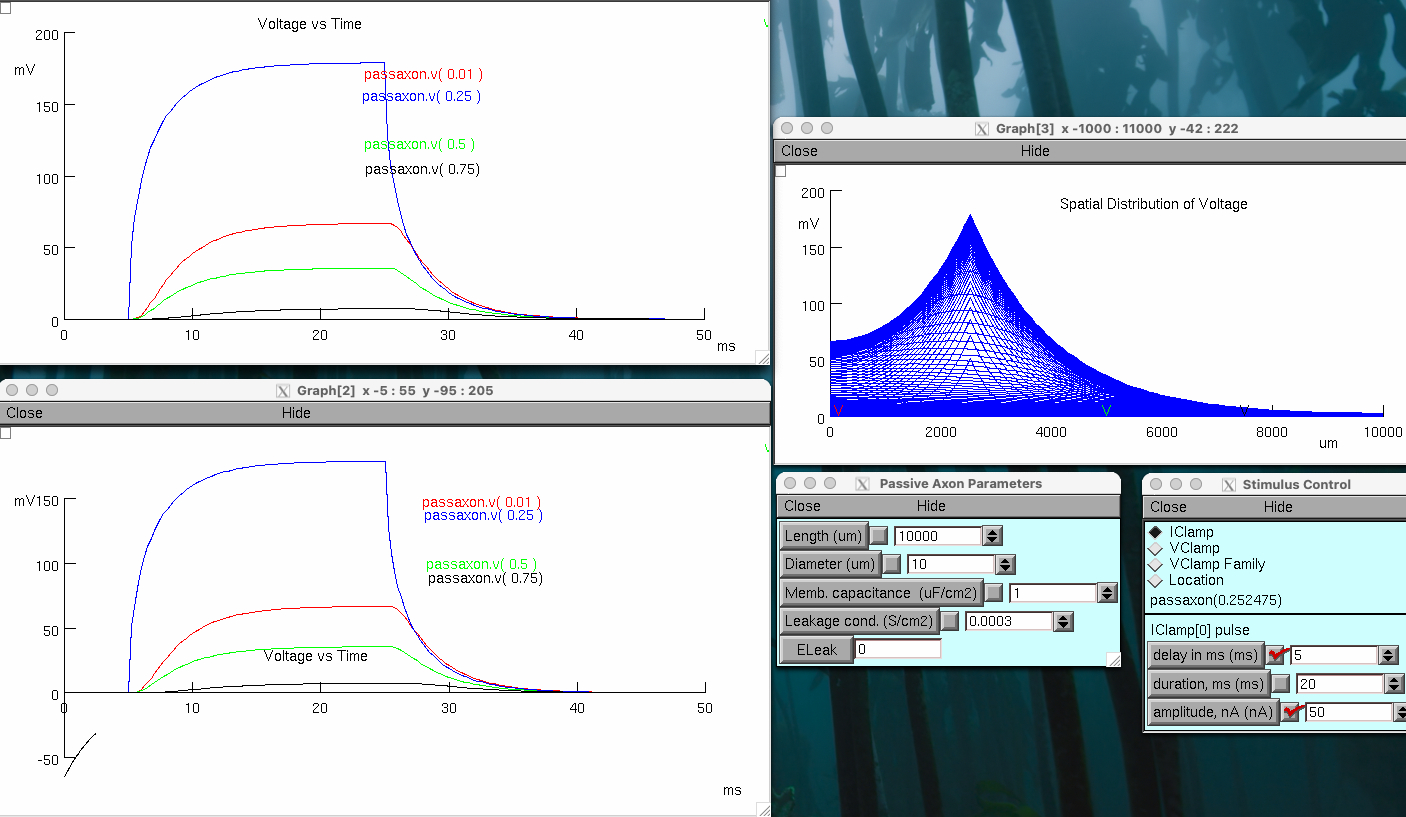
Choose tutorial "The Passive Axon"
Click on Voltage vs. Time Plot, 4 locations
Keep Lines
Click on Voltage vs. Time Plot , expanded
Keep Lines
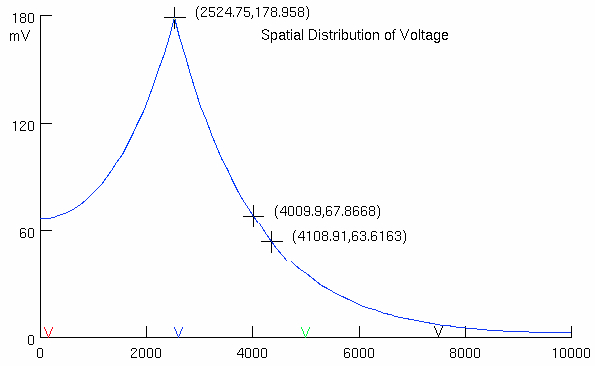
Click on Voltage vs. Space
Click on Axon Parameters
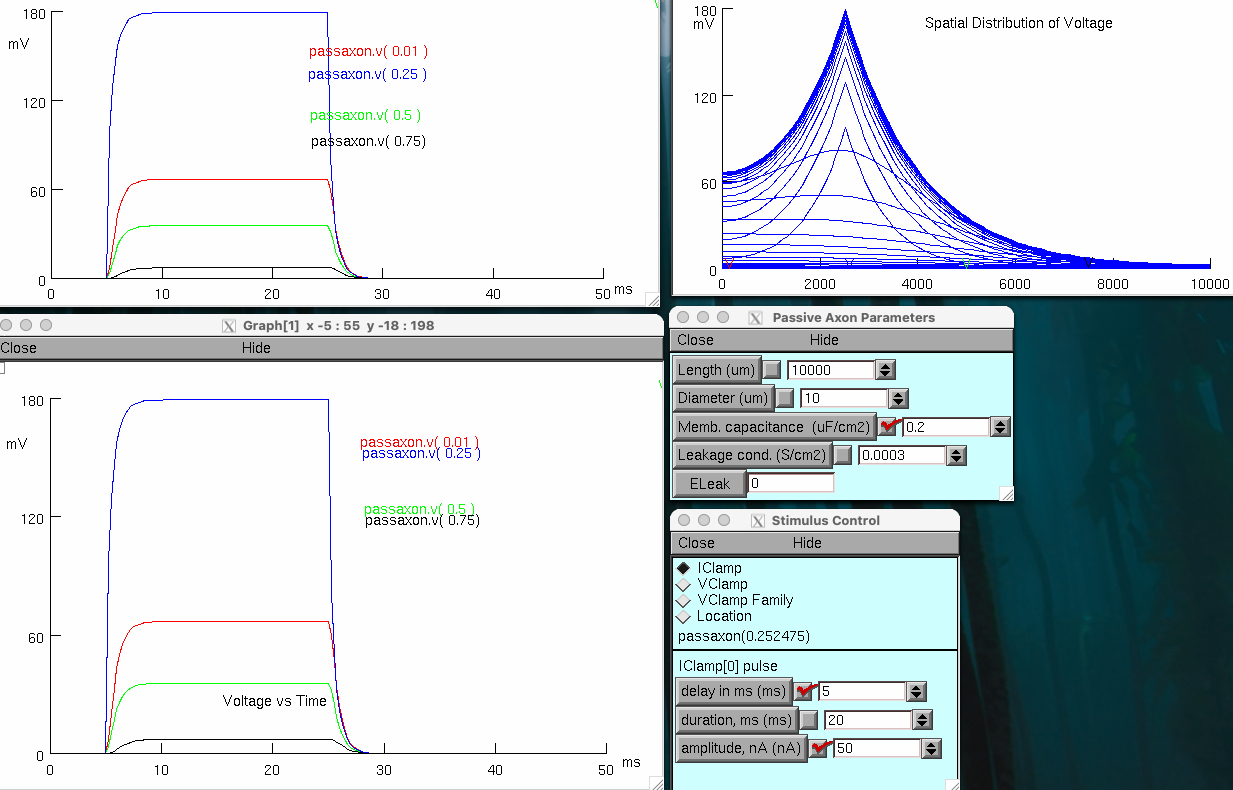
Place stimulus electrode at ~0.25 by clicking on line
Set delay 5 msec , duration 20 msec , amplitude 50 nA
Set Total # ( ms ) to 50 msec
Click on Reset & Run
try slower
Describe what happens quantitatively. Sketch representative voltages traces to illustrate
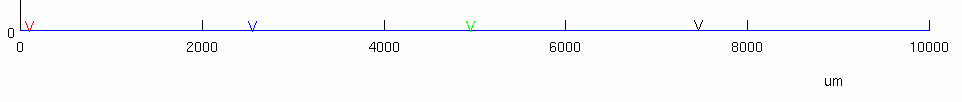
stimulus electrode was placed at
we then have 4 different recording electrodes positioned at :
Red @
Blue @
this is the closest recording electrode to the stimulus electrode
Green @
Black @
Measure time constant at site of current injection and length constant
so using the blue trace , as it should be the most accurate
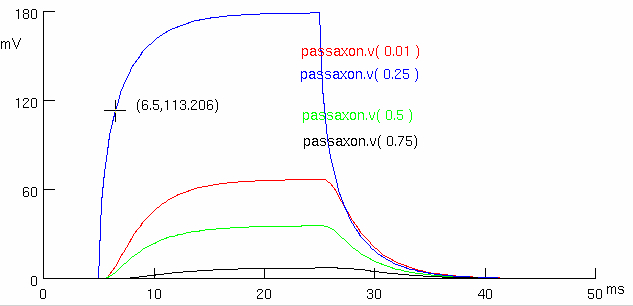
so its somewhere between
then we have to subtract off
where :
try Reset ( mV ) and then Continue for ( ms )
Decrease axon membrane capacitance ( Cm ) 5 fold to 0.2 µF/cm2
Describe what happens quantitatively , comparing timing and distance traveled ( sketch representative voltages traces )
much shorter duration , only 28 milli seconds
slightly increased the length constant
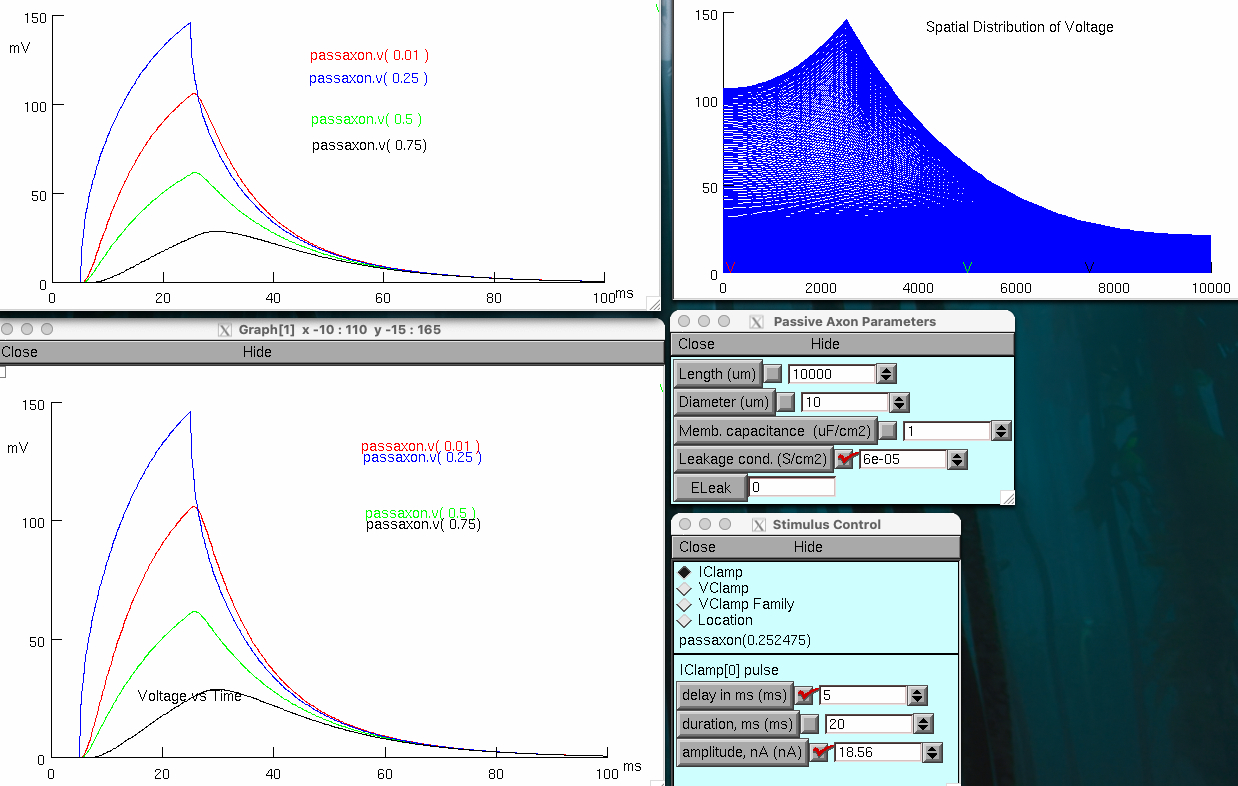
Decrease axon membrane conductance ( leak , GL ) 5 fold to 0.06 mS/cm 2 ( 0.00006 S/cm2 )
Return Cm to default value
Set stimulus amplitude to 18.56 nA
Describe what happens quantitatively , comparing timing and distance traveled ( sketch representative voltages traces )
lasts much longer in duration
spreads over larger distance
actually , its more like 10 ms if you extend it out to let it reach steady-state voltage
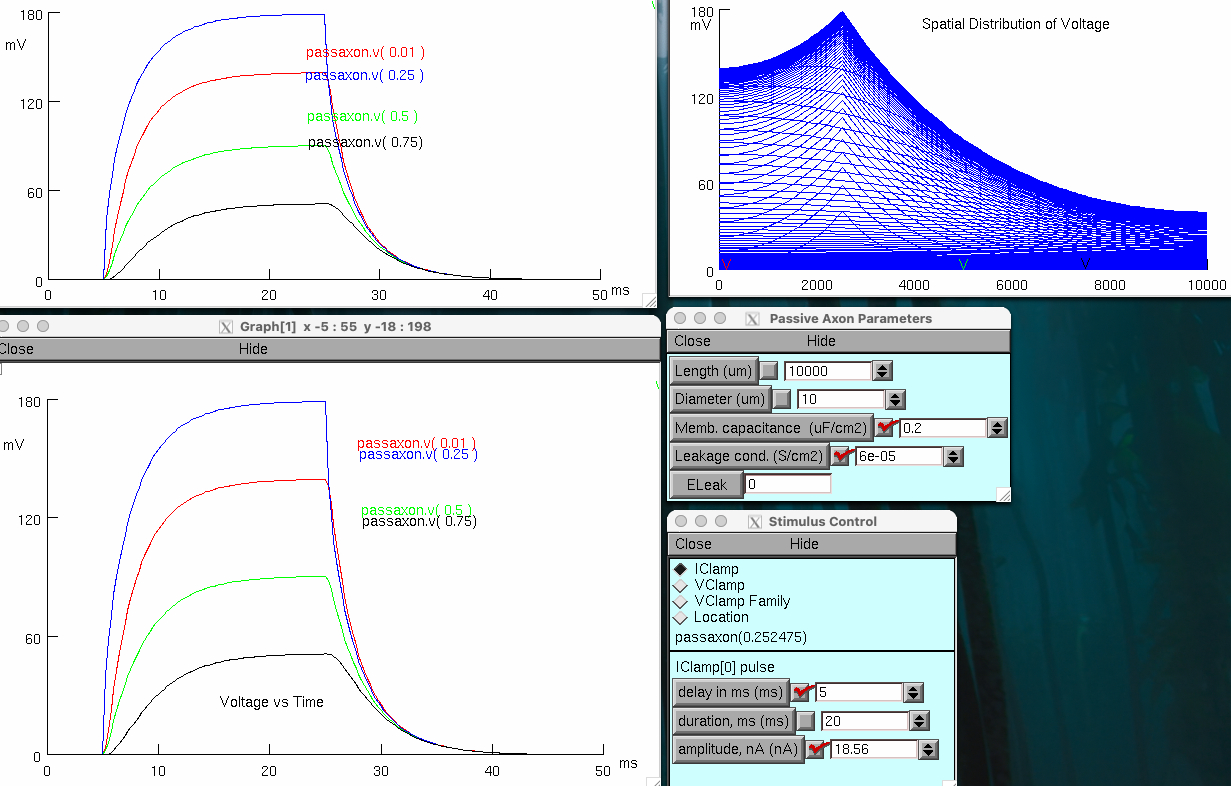
Decrease axon membrane conductance ( GL ) and capacitance ( Cm ) 5 fold of control
Keep stimulus amplitude at 18.56 nA
Describe what happens quantitatively, comparing timing and distance traveled. Sketch representative voltages traces.
back to original timing
but spreads over much larger distance
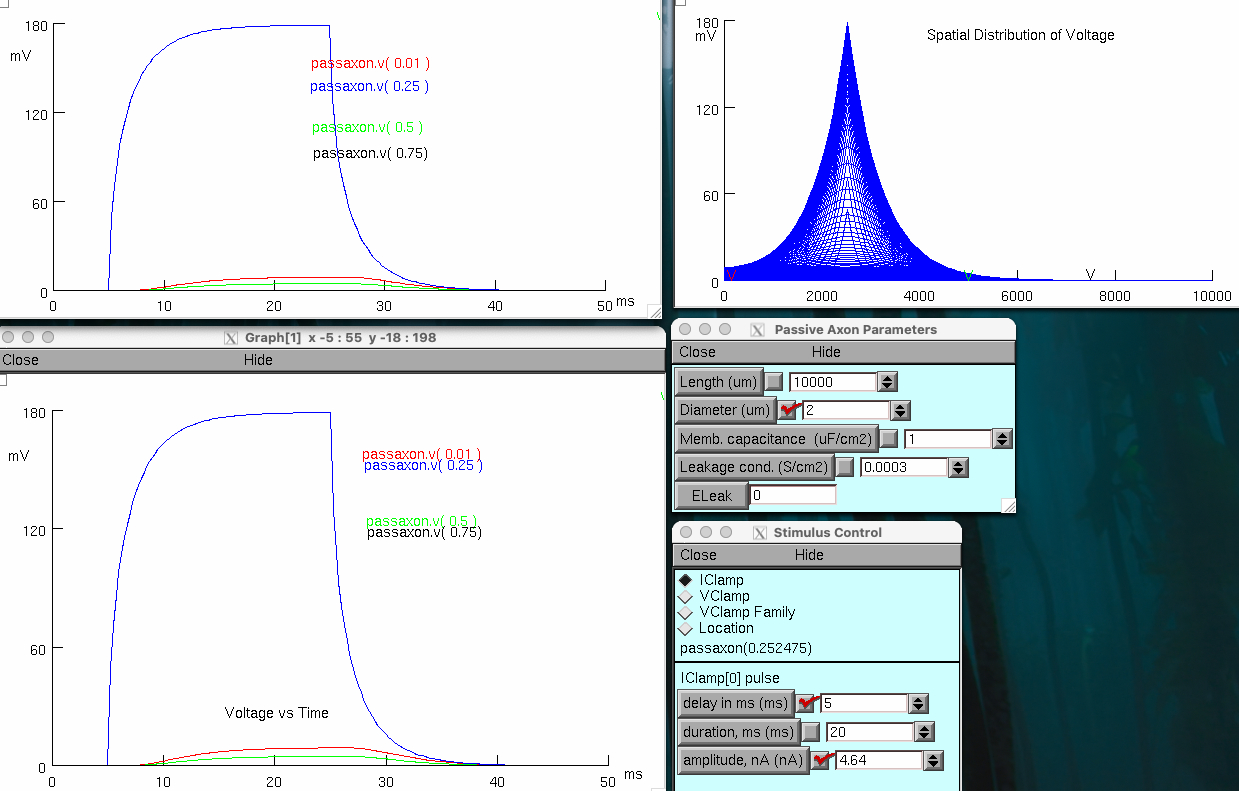
Decrease axon membrane diameter 5 fold to 2 µm
Return both GL and Cm to default
Set stimulus amplitude to 4.64 nA
Turn off the Keep Lines option
Describe what happens quantitatively, comparing timing and distance traveled. Sketch representative voltages traces
spacial distribution condensed around injection site
Tabulate your results
| Experiment | ||
|---|---|---|
| 1 | 1.5 | 1525.25 |
| 2 | 0.3 | 1545.0 |
| 3 | 6.5 , 10 | 2871.25 |
| 4 | 2.18 | 3663.25 |
| 5 | 1.35 | 685.25 |
Convince your Team members how charge flows along the axon.
decreasing
decreasing
makes depolarization last longer
increases distribution spread
decreasing diameter :
decreases distribution spread
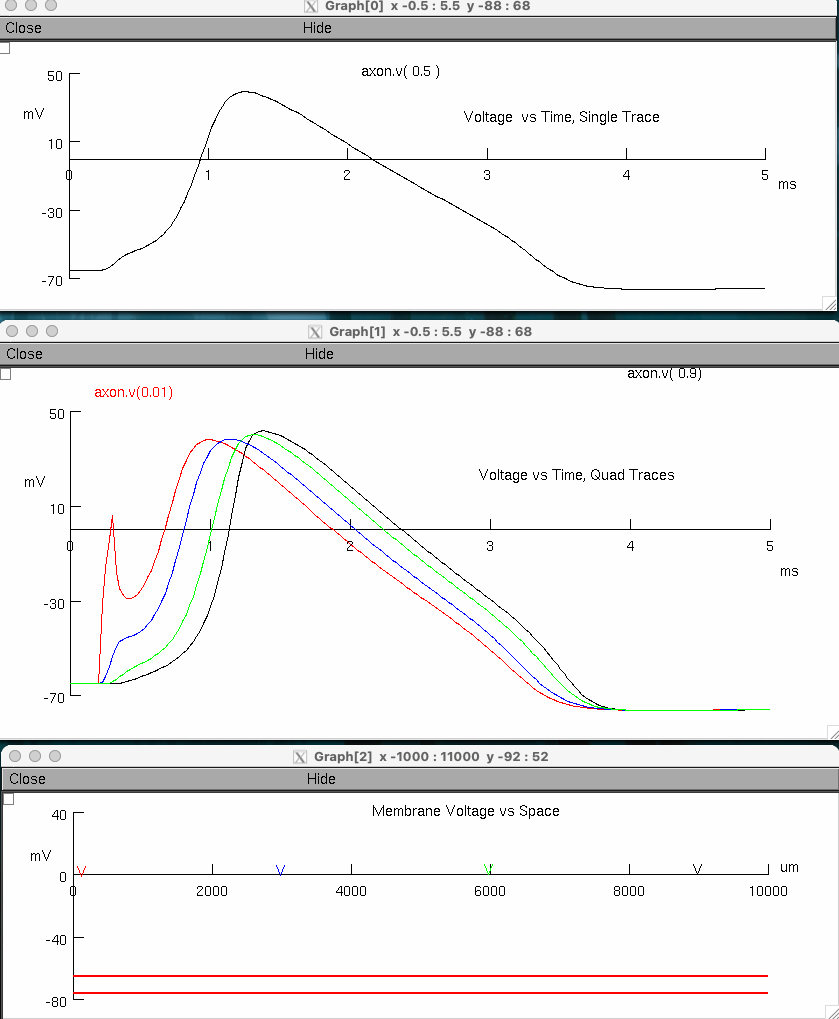
Part 2 - Measuring Propagation in Unmyelinated Axon
Describe how membrane potential varies along a squid giant axon.
Choose tutorial "The Unmyelinated Axon"
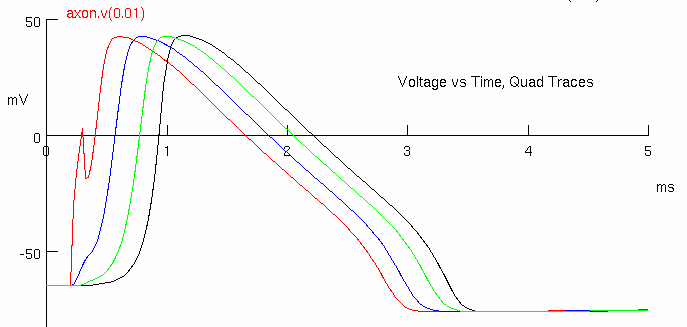
Click on Voltage vs. Time Plot, Quad Traces
Click on Voltage vs. space
Click on Axon Parameters
Place stimulus electrode at 0.0 by clicking on line
Click on Reset & Run
try Slower
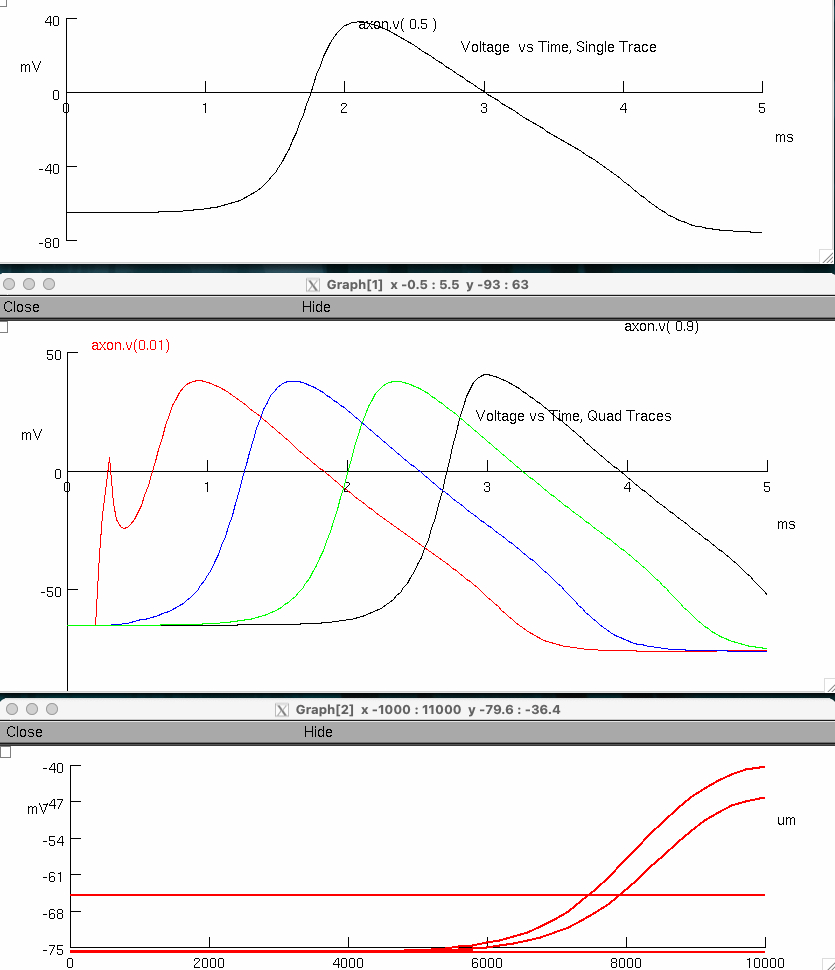
Describe what happens quantitatively , comparing timing and distance traveled. Sketch representative voltages traces.
The red trace is the action potential near the site of stimulation ( 0.1 mm )
The black trace at a recording electrode ~9 mm along the axon.
It propagates with a measurable delay at each recording site
blue is at
green is at
black is at
demonstrates decay of membrane potential along axon
Measure the action potential conduction velocity in meter/sec ( use crosshairs )
red peak = 1.0 , 38.0444
black peak = 1.375 , 41.8389
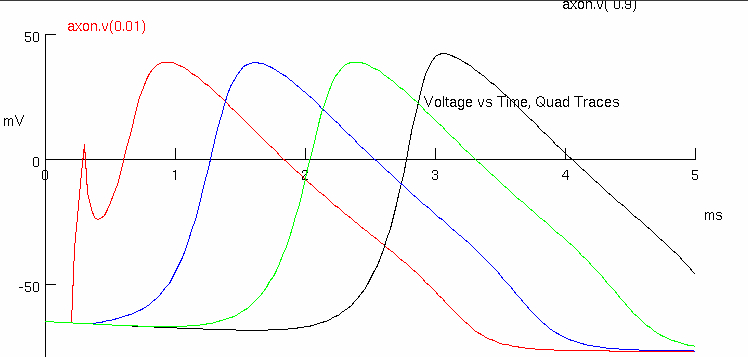
Decrease axon membrane diameter 10 fold to 50 µm
Set stimulus amplitude to 700 nA
note shock artifact
Measure the action potential conduction velocity
red peak = 0.925 , 38.1178
black peak = 3.0 , 40.64
Tabulate your results ( conduction velocity ) from simulations ( 2.1 and 2.2 ). Provide descriptive arrows for changes along with numerical estimates.
conduction velocity decreased
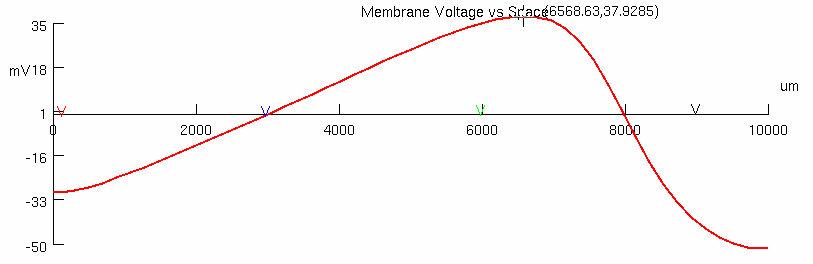
Examine action potential waveform ( Voltage vs Space graph ) , at time ( ms ) ~2.5 ms
Part 3 - Myelin Influence on Membrane Circuit ( Passive ) Properties
Choose tutorial "The Unmyelinated Axon"
Click on Voltage vs. Time Plot, Quad Traces
Click on Voltage vs. space
Click on Axon Parameters
Set axon diameter to 50 μm
Set stimulus amplitude 700 nA
Click on Reset & Run
try Slower
Measure conduction velocity ( continued from simulation 2.2 )
red peak = 0.925 , 38.1178
black peak = 2.95 , 40.1149
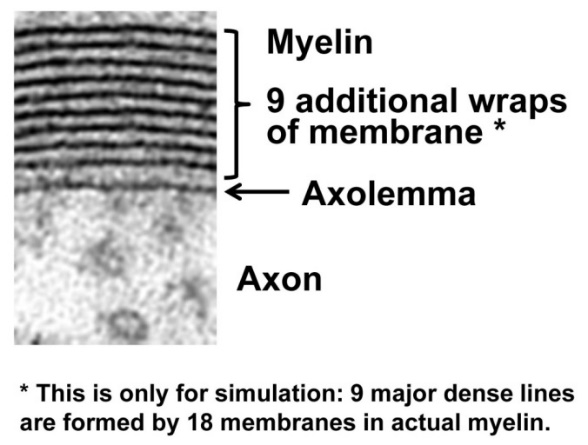
Describe how 9 additional wraps of membrane would alter the axon membrane capacitance. The equation for adding capacitances in series is shown below.
the wraps would increase
overall reducing
where :
Mimic this increase in myelin wrapping by decreasing capacitance to 0.1 μF/cm2
Decrease stimulus amplitude to 220 nA ( note stimulus artifact )
Measure conduction velocity
red peak = 0.6 , 42.8067
black peak = 1.15 , 43.2358
Return membrane capacitance to 1 μF/cm2
Set stimulus strength to 700 nA
Mimic the influence on membrane conductance alone , reducing GL 10-fold to 0.03 mS/cm 2 ( 0.00003 S/cm2 )
Measure conduction velocity
red peak = 0.925 , 38.8769
black peak = 3.05 , 42.2186
Tabulate your results ( conduction velocity ) from simulations
Experiment Conduction Velocity 1 4.289 2 16.18 3 4.188
Part 4 - Measuring Propagation in Myelinated Axon
Describe how membrane potential varies along a frog myelinated axon.
Choose tutorial "The Myelinated Axon"
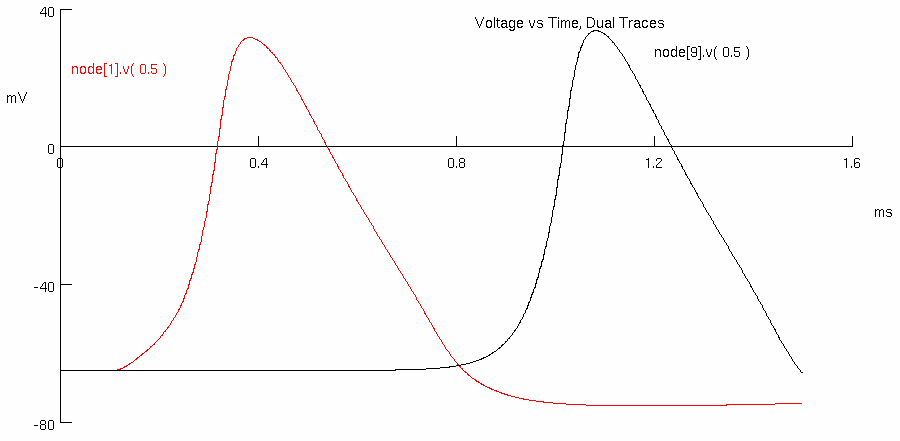
Click on Voltage vs. Time Plot, Dual Traces
Click on Voltage vs. space
Click on Myelinated Region Parameters
Click on Reset & Run
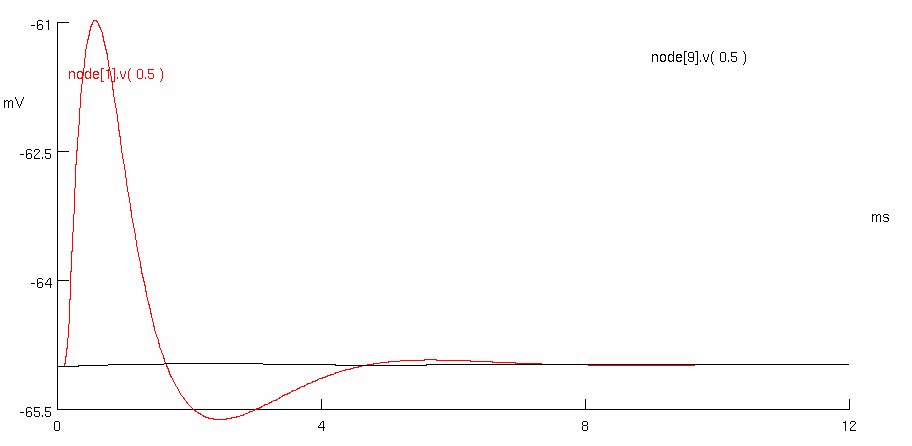
The response is for a frog axon ( diameter of 10 μm ) with ten myelinated regions of 150 myelin wraps.
Each myelinated region is 1 mm long with nodes of Ranvier 3.2 μm long.
The red trace is the action potential at the 1st node and the black trace at the 9th node.
Describe what happens.
action potential propagates down an axon
the red electrode is at
the black electrode is at
Determine how many nodes are above
only 1 at a time
Measure the action potential conduction velocity in meter/sec ( use crosshairs )
red peak = 0.348925 , 34.2352
black peak = 0.773925 , 35.5364
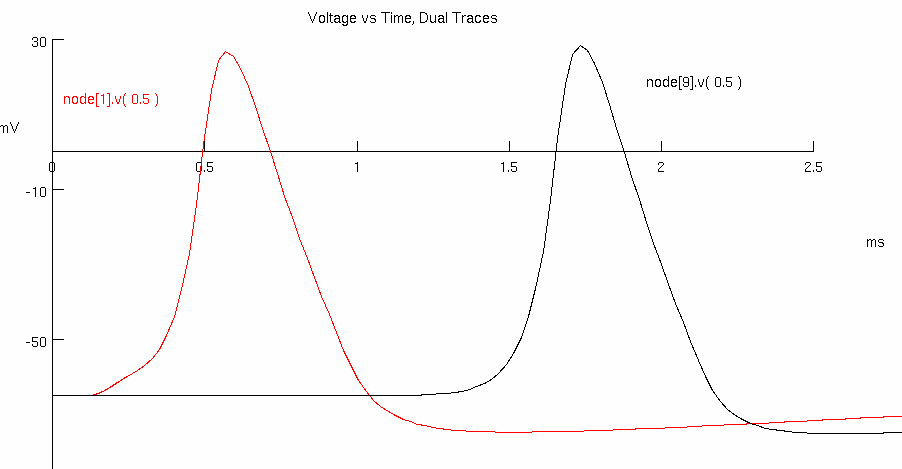
Decrease the number of myelin wraps successively to 50 , 20 , and then 10
Describe what happens. Note changes in capacitance and Myelinated Region Parameters
50 :
Myelin Capacitance =
Na Channel Density =
K Channel Density =
Leakage Conductance =
20 :
Myelin Capacitance =
Na Channel Density =
K Channel Density =
Leakage Conductance =
10 :
Myelin Capacitance =
Na Channel Density =
K Channel Density =
Leakage Conductance =
Measure the action potential conduction velocity for each condition.
50 :
red peak = 0.38375 , 31.7135
black peak = 1.08125 , 33.7286
20 :
red peak = 0.569187 , 26.701
black peak = 1.73199 , 28.3823
10 :
red peak = 0.575 , -60.9735
black peak = 2.475 , -64.9624
Tabulate your results ( conduction velocity ) from simulations
Experiment Conduction Velocity 1 18.823529 2 11.46953 3 6.87992 4 4.2105
Return all parameters to default settings.
Place stimulus electrode in the 4th node ( 0.5 )
Describe what happens
there is more than one node at any given time above
multiple nodes were depolarized at different times
the red and black recording electrodes are in the same spots
its just now we are syncing in time the black electrode picking up on the IClamp pulse as well