Explain how membrane potential varies with stimulus amplitude.
Choose tutorial "The Ca Action Potential"
Click IClamp
Click Na Channels only
Click Reset & Run
Keep Lines
Click Ca Channels Only
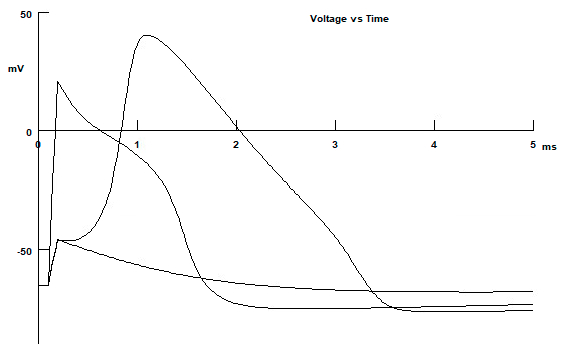
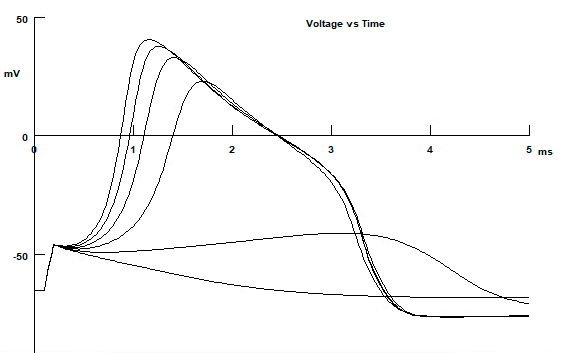
Vary the amplitude of stimulation ( increase amplitude in 0.1 nA increments; Stimulus Control )
Describe what happened
fires an action potential like trace first at
Erase V/T plot and I/T plot
Set stimulus to 1.0 nA
Click Na Channels only, reset and run
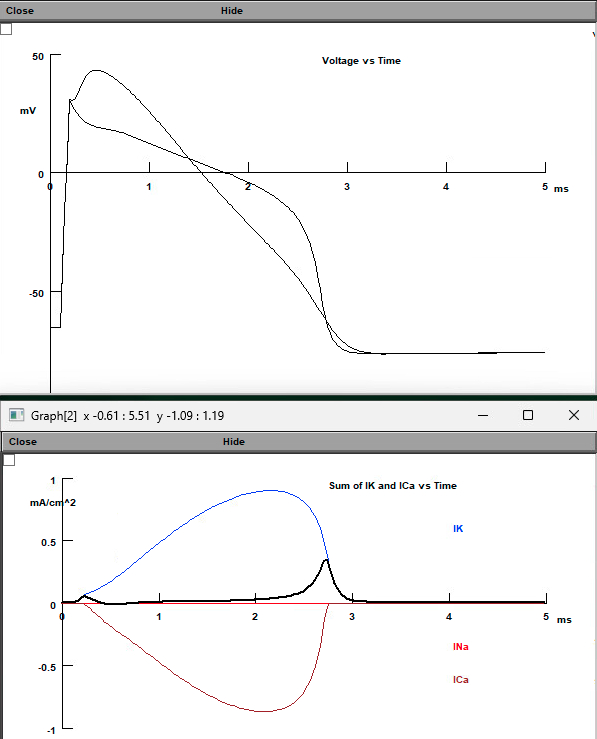
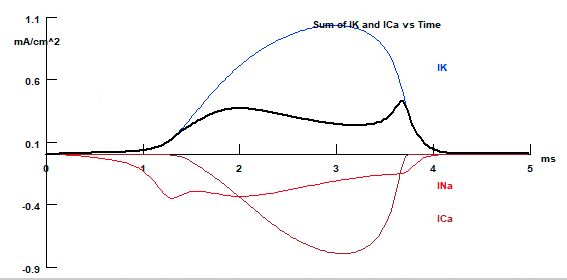
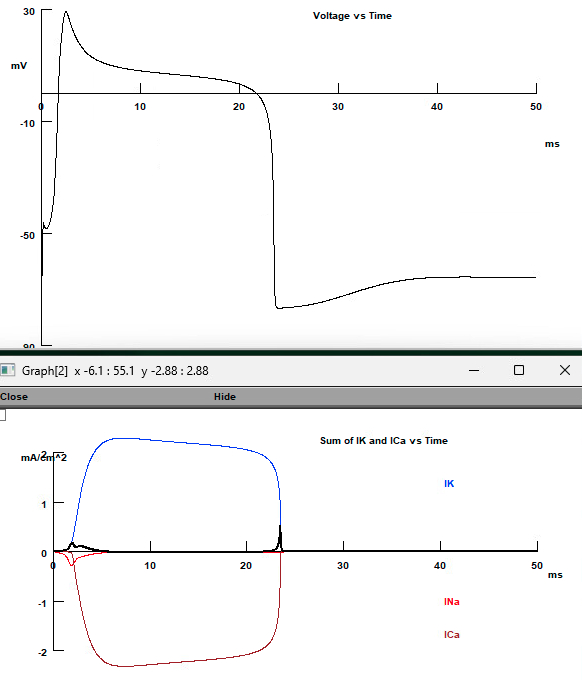
Open Sum of Currents Plot
Click Ca Channels only, reset and run
Indicate which channel type opened first during the time course, and which type closed last.
with sodium channel density at zero ,
Open First = potassium
Closed Last = potassium
Click Na and Ca Channels
Set stimulus to 0.2 nA
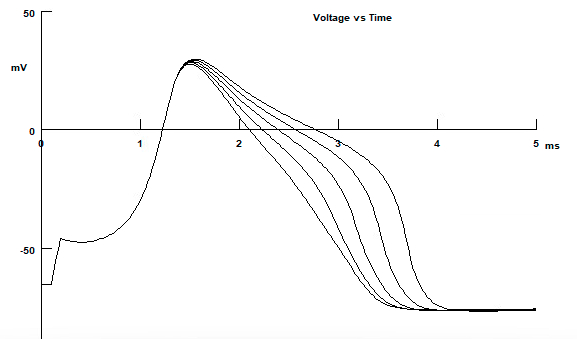
Increase GCa ( Ca chan density ) from 0.01 S/cm2 in 0.02 S/cm2 increments
Indicate which parts of the action potential time course changed the most with increases in GCa.
re-polarization phase of action potential changes the most
slight increase in the peak
lasts longer in time
calcium channels don't inactivate
we are recruiting more and more potassium channels , and eventually there is a large enough force to get a very sharp ( steep negative slope ) repolarization
Click Na and Ca Channels
Increase GNa from 0.01 S/cm2 in 0.02 S/cm2 increments
Then from 0.2 S/cm2 in 0.2 S/cm2 increments
Indicate which parts of the action potential time course changed the most with increases in GNa.
increases peak
makes action potential occur earlier in time
depolarization slope = more steep
Click Cardiac-like AP
Explain how the action potential time course differed compared with your earlier simulations.
much much longer , at around 23 milli seconds
also , potassium channels take much longer to close
Vary GK
Describe what happens
decreasing potassium conductance , even just by
increasing potassium conductance , makes action potential time shorter
if