Choose tutorial "Voltage Clamping a Patch"
In patch parameters , set K+ conductance to 0.0 S / cm^2
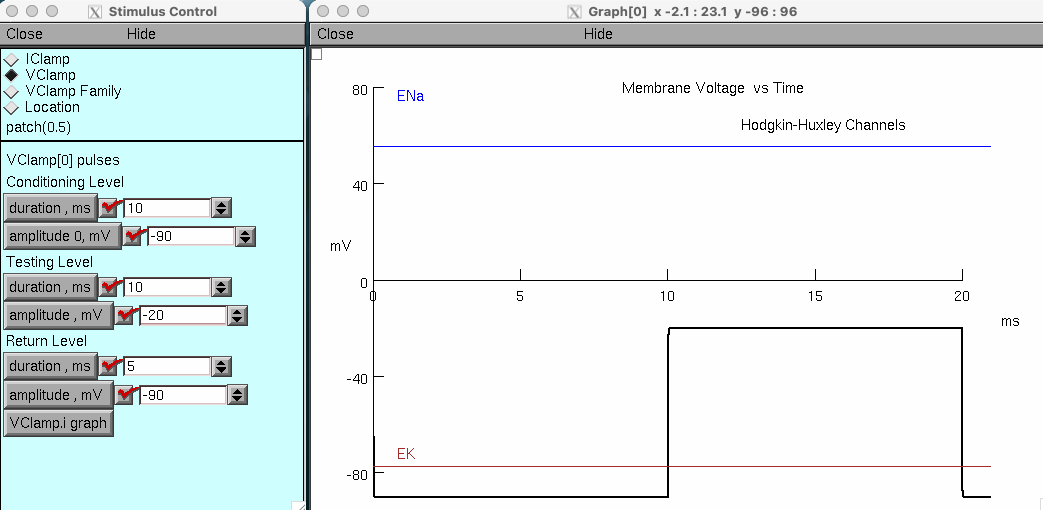
Under stimulus control click on Vclamp
Set conditioning pulse to 10 ms , -90 mV
Set testing level duration to 10 ms , step to -20 mV
Set return level duration to 5 ms , -90 mV
Under run control set total duration to 21 ms
https://docs.google.com/spreadsheets/d/1dC1F_QDnCclecN0XUQRr_kBqovObZtBIxQI74e17IgU/edit?usp=sharing
Use modifications of this pulse protocol to determine the midpoint of activation and the midpoint of inactivation for these Na+ channels.
Midpoint of Activation :
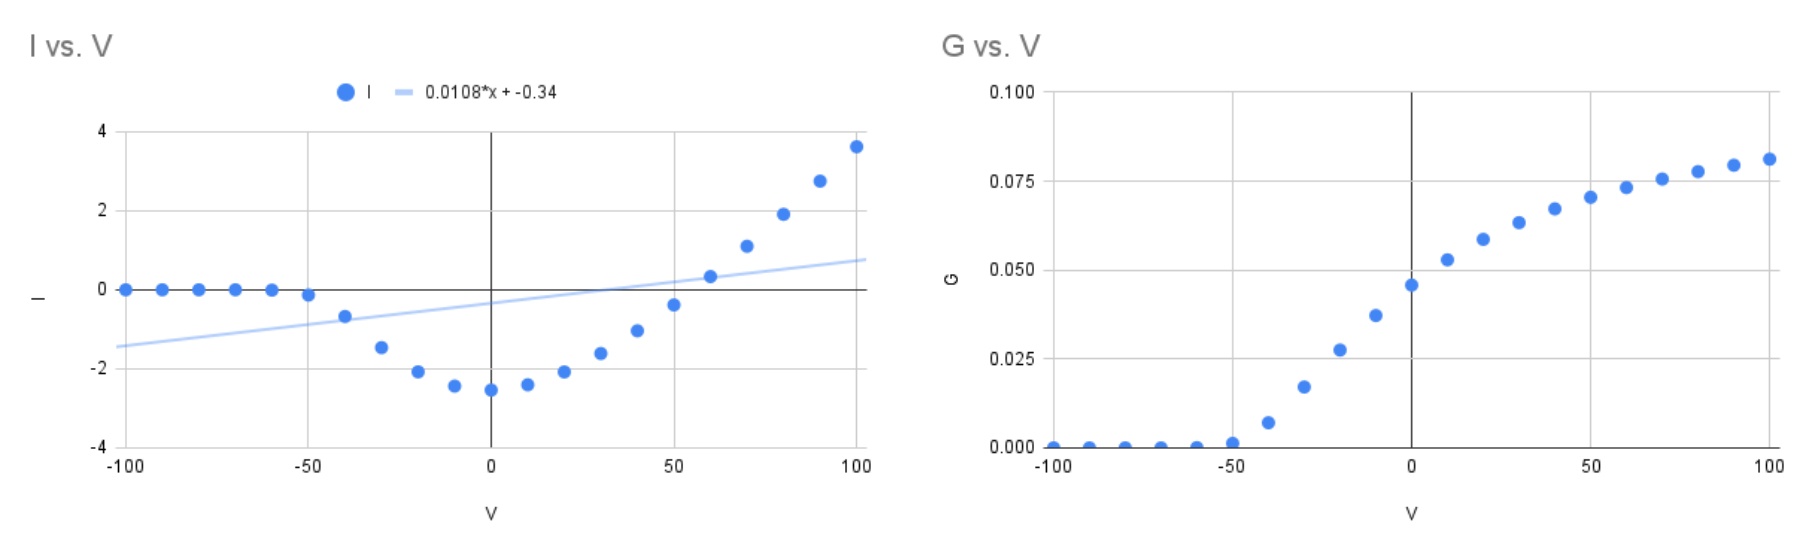
so
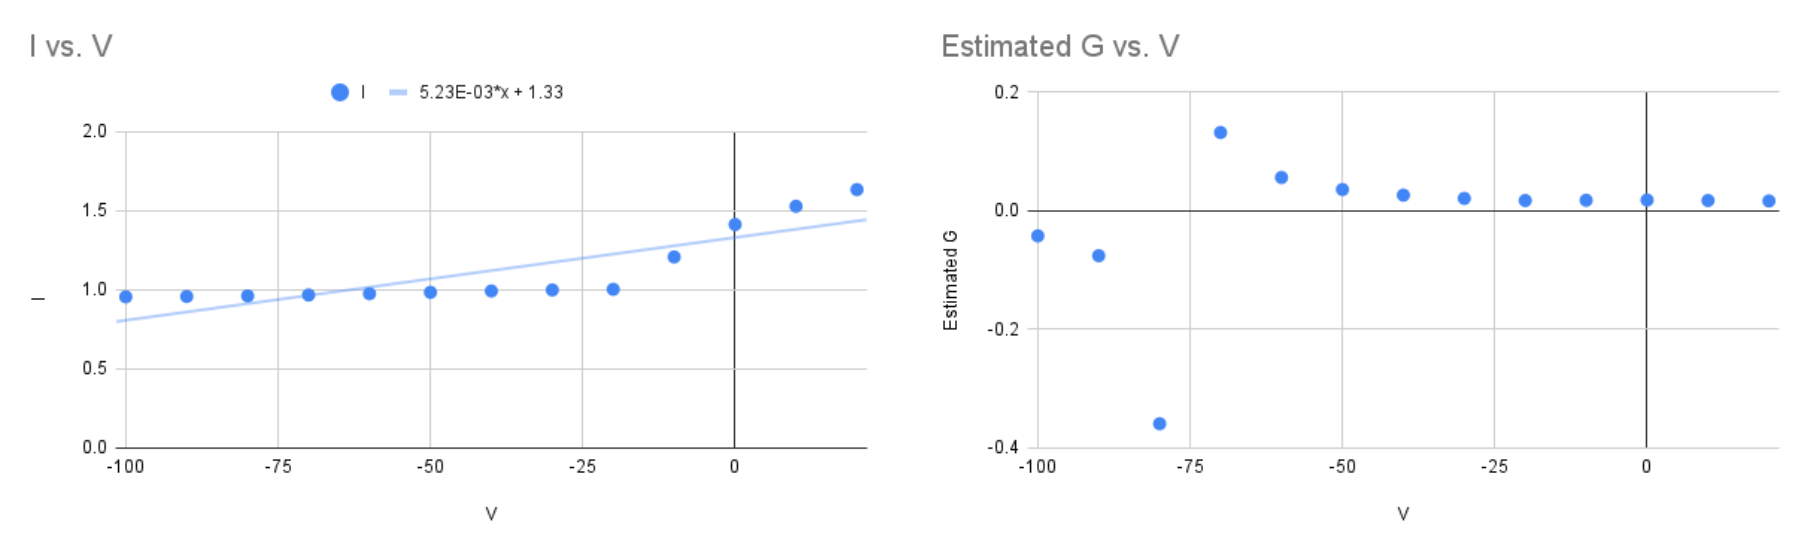
the corresponding closest voltage value on the G / V thats around
so its already centered around the midpoint of activation at zero milli volts
Midpoint of InActivation :
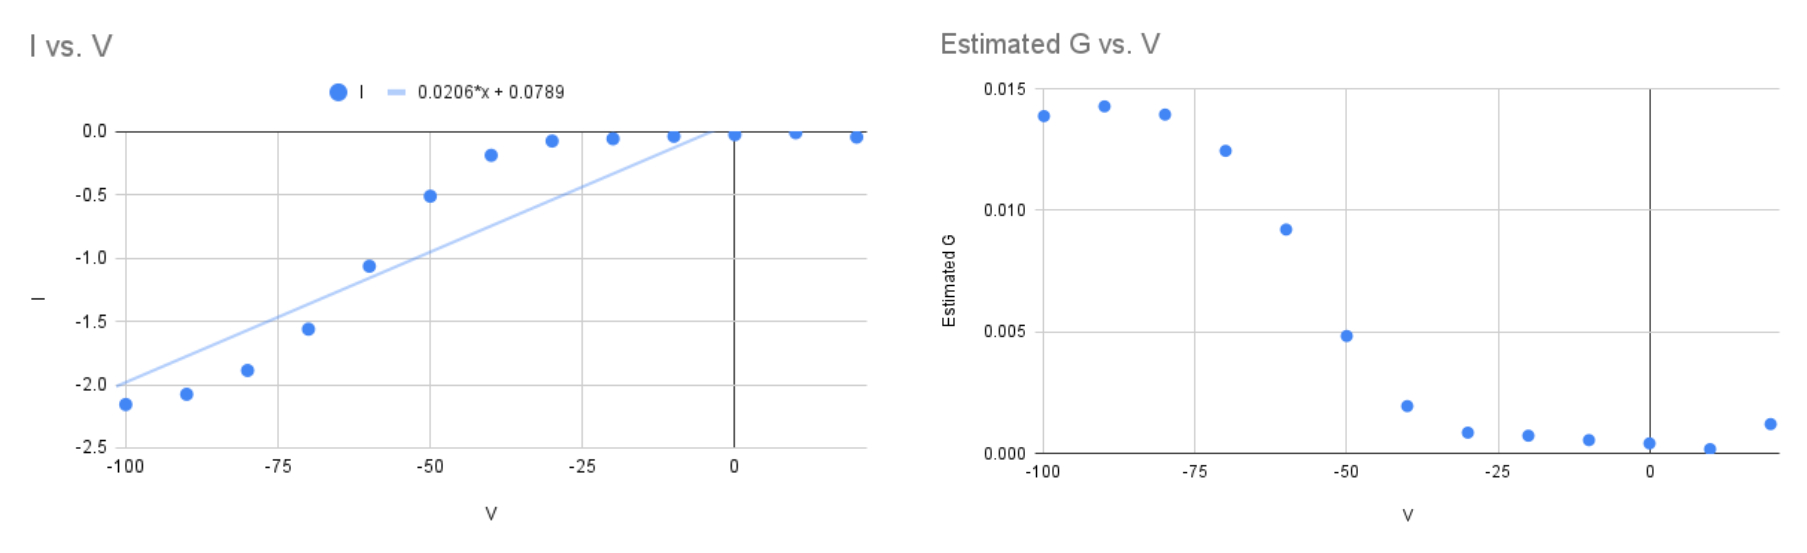
so
the corresponding closest voltage value on the G / V thats around
Convince your teammates that the data you collected from Study Guide 6 – Voltage Clamp , will suffice to determine the midpoint of activation.
study guid 6 and this study guide both produce normal sigmoidal curves for G / V plots.
so both should be fine to use
voltage clamp might be more accurate than having the dynamics of multiple pulses
Set the K+ conductance back to the default value
Set the Na+ conductance to 0.0 S / cm2
Determine the voltage dependence of activation and inactivation for the K+ channels in this simulation
Midpoint of Activation :
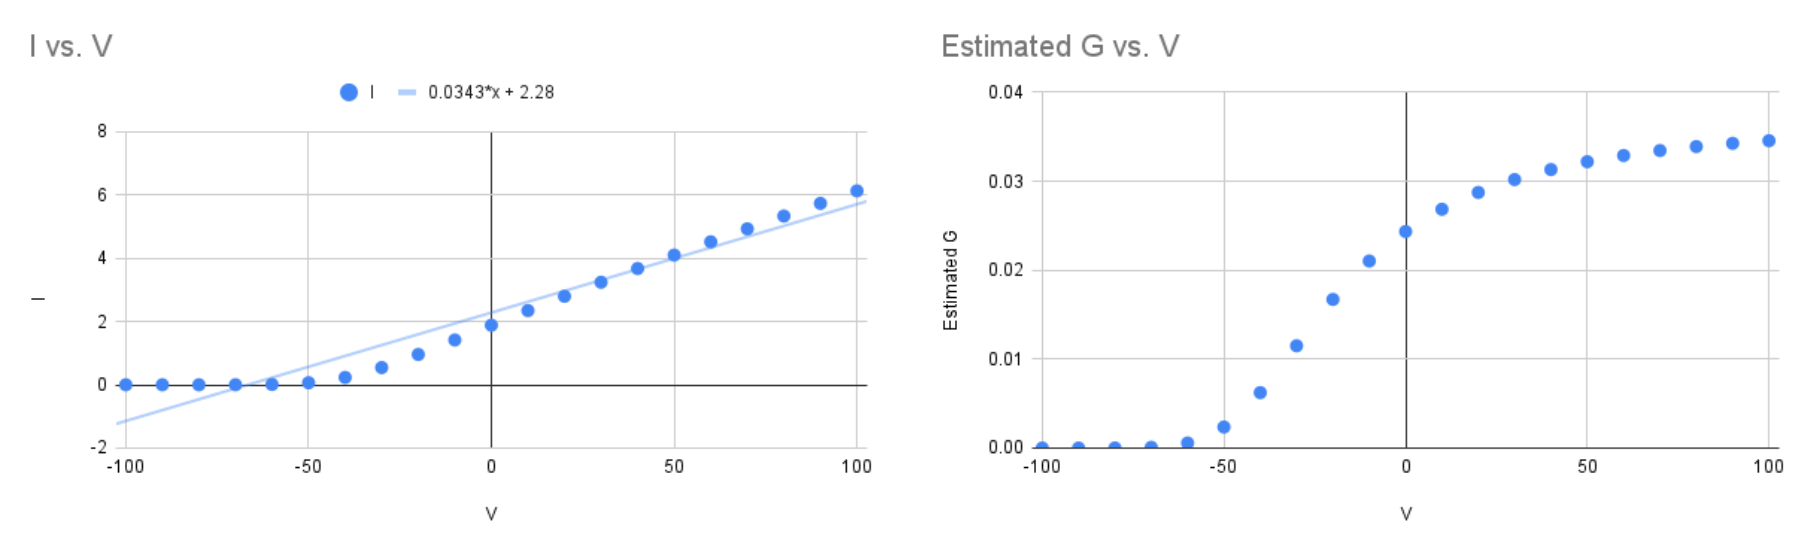
so
the corresponding closest voltage value on the G / V thats around
Midpoint of InActivation :
there is an asymptote on G / V curve around
potassium channels don't really inactivate
Convince your teammates that the data you collected from Study Guide 6 – Voltage Clamp , will suffice to determine the voltage dependence of activation
the voltage clamp data looked cleaner