Part 1 - Voltage Clamp of K+ Current ( IK )
Collected Data : https://docs.google.com/spreadsheets/d/1UArGLeBwguDwpFXvkdP19wLGHYiIc84Duz7DeYf39ck/edit?usp=sharing
Determine how
varies with stimulus voltage
Choose tutorial "Voltage Clamping a Patch"
Click on "Start the Simulation"
Click on VClamp
Click on Membrane Current Plots
Increase Total ms to 12 ms
Increase Stimulus Duration ( for testing level ) to 10 ms
Remove Na+ conductance , by setting to 0.0 S/cm^2
Vary the test amplitude of stimulation ( change voltage , mV in Stimulus Control window ) , starting at −100 mV and stepping in 10 mV increments to +100 mV. Measure the largest current for each voltage step ( check beginning and end of testing level ). Left clicking on trace to get a reading for x,y ( y is the amplitude in mA/cm2 ). Plot the current vs the voltage step, on the graph provided ( next page )
-100 -0.00800178 -90 -0.00450186 -80 -0.000954157 -70 0.00274448 -60 0.0137072 -50 0.0762199 -40 0.25128 -30 0.56275 -20 0.971343 -10 1.42375 0 1.88685 10 2.34651 20 2.79808 30 3.24056 40 3.67417 50 4.09954 60 4.51741 70 4.92852 80 5.33359 90 5.73329 100 6.12823 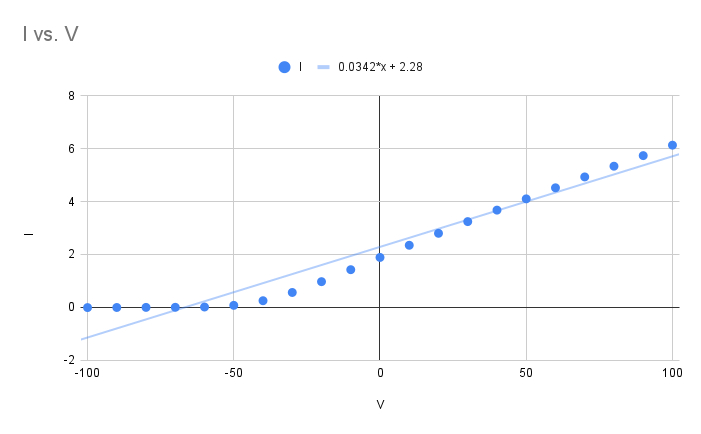
we get the conductance value for free from the slope
Siemens
so here I guess its
now to find approximated nernst value for sodium :
let
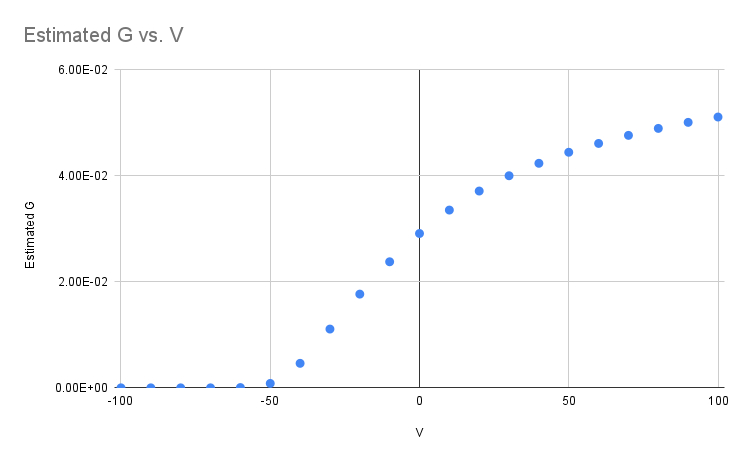
Calculate chord conductance ( G ) for these K+ currents , then construct a plot of GK versus Vm
solving for
-100 0.0003528277261 -90 0.0003550642795 -80 0.0003561616275 -70 0.0003748777489 -60 0.0007913630853 -50 0.002789791735 -40 0.00673293856 -30 0.01189218317 -20 0.01694567436 -10 0.02114867575 0 0.02440281424 10 0.02687223005 20 0.02875104037 30 0.03019502241 40 0.03131724073 50 0.03219845901 60 0.03289671645 70 0.03345429369 80 0.03390259406 90 0.03426521477 100 0.03456009159 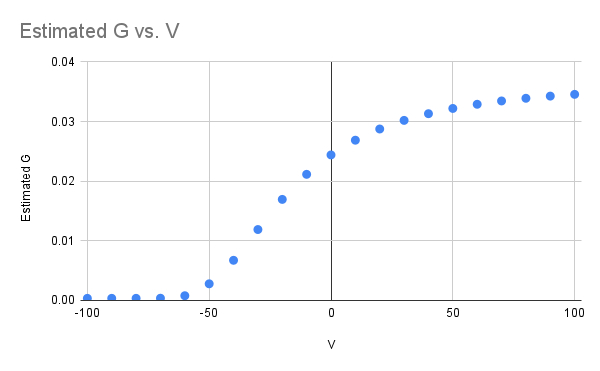
the curve is sigmoidal , and you could fit it with a Boltzman equation to find the slope
a large slope = channel requires a broader voltage range to switch from closed to open state
a small slope = channel opens very quickly over a narrow voltage range
but we just can take
now go to the G / V plot , and lookup corresponding voltage for where
from the table , its somewhere between
the actual value we call now
if
probably a sodium channel
if
probably a potassium channel
Current reverses ( changes from inward to outward: negative to positive ) at the Nernst potential for the permeant ion. Locate that reversal point for the K+ current and compare with the anticipated Nernst value.
looking at the table of values we collected , current reverses polarity between
our predicted value of
Describe any changes of the kinetics with voltage ( kinetics refers to the time course of the current: rate of rise and rate of fall )
constant slope on G / V plot between
delay in opening , then open for long period of time
Part 2 - Voltage Clamp of Na+ Current ( INa )
Determine how
varies with stimulus voltage
Choose tutorial "Voltage Clamping a Patch"
Click on "Start the Simulation"
Click on VClamp
Click on Membrane Current Plots
Increase Total ms to 6 ms
Increase Stimulus Duration ( for testing level ) to 4 ms
Set Na+ conductance to default value
Remove K+ conductance , by setting to 0.0 S/cm^2
Vary the amplitude of stimulation (change voltage, mV in Stimulus Control window), starting at −100 mV and stepping in 10 mV increments to +100 mV. Measure the maximal current for each voltage step. Plot the current vs the voltage step, on the graph provided on next page.
-100 -2.57E-09 -90 -1.37E-07 -80 -6.34E-06 -70 -0.000237441 -60 -0.00635058 -50 -0.0879799 -40 -0.441195 -30 -0.947073 -20 -1.33333 -10 -1.55554 0 -1.61346 10 -1.52326 20 -1.31529 30 -1.01759 40 -0.653983 50 -0.242015 60 0.2097 70 0.692602 80 1.20084 90 1.72929 100 2.27465 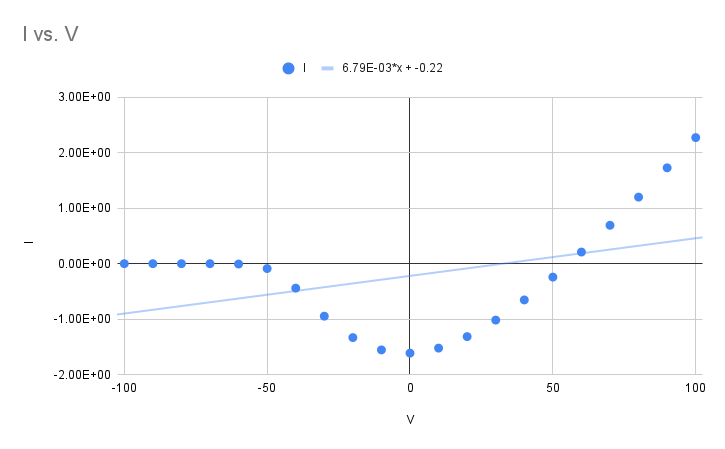
Locate the reversal potential for the Na+ current and compare with the anticipated Nernst value
fitted linear equation is obviously very wrong , as we don't have a straight line for the entire trace
looking at the collected data in the table , it crosses zero between
the programmed
Describe any changes of the kinetics with voltage ( also note time of peak INa )
it reaches the peak time for
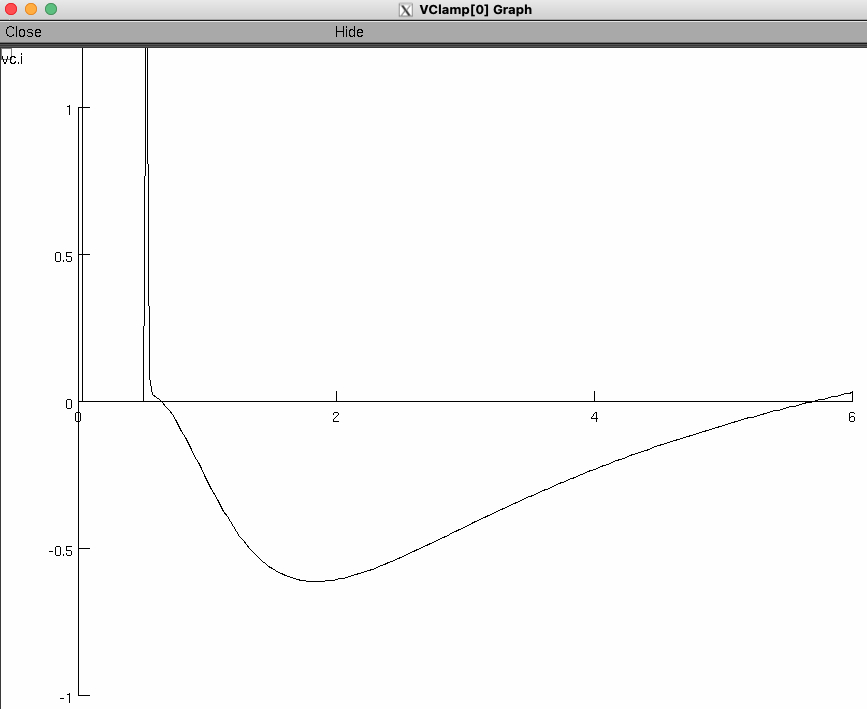
Repeat the stimulation sequence with both Na+ and K+ conductances at default values ( 10 ms duration testing level ). Click on Membrane Current Plots ( in Panel & Graph Manager ) and VClamp.i graph ( in Stimulus Control Panel ).
Part 3 - IK and INa During the Action Potential
Choose tutorial "The Na Action Potential"
Start the Simulation
Click on IClamp
Change total # ms to 10 ms
Reset and Run
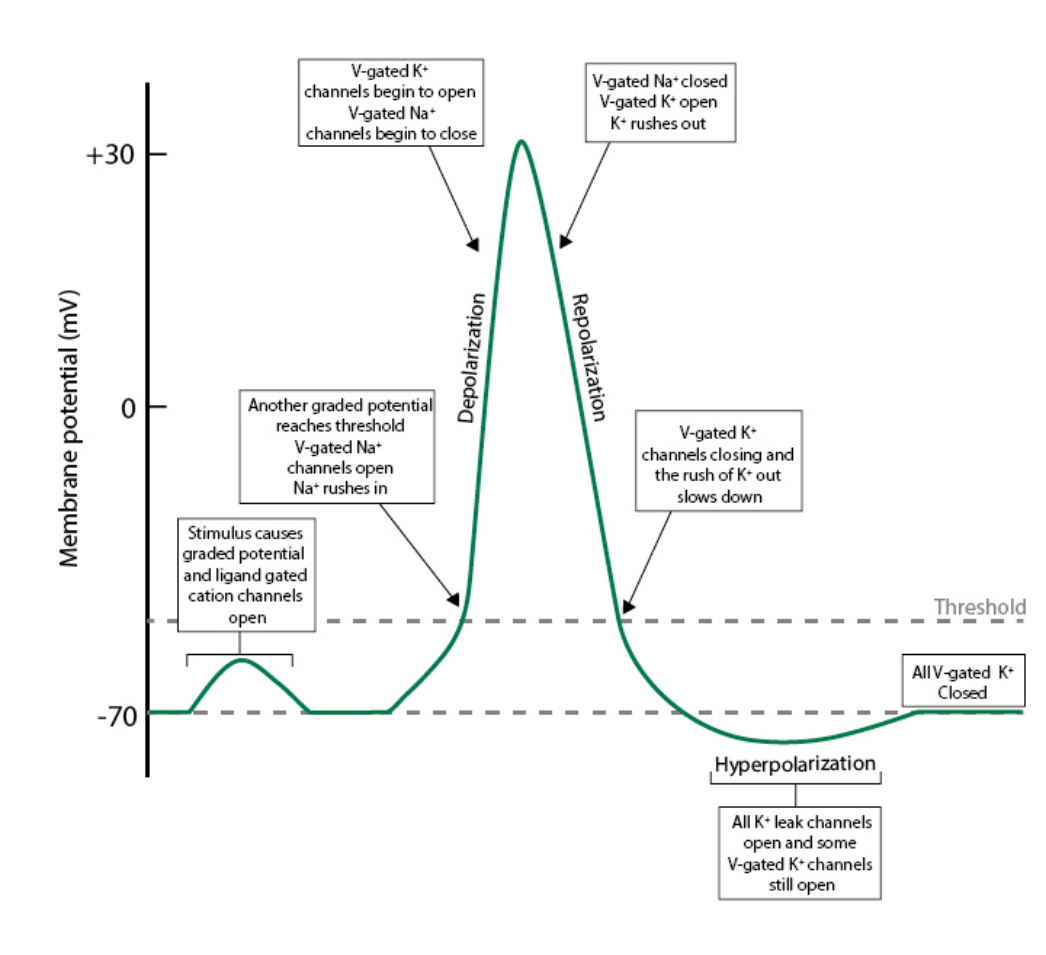
Using your results from the voltage dependence of INa and IK ( review your plots from previous pages ) , and the dependence of INa and IK on driving force
inward sodium current , outward potassium current
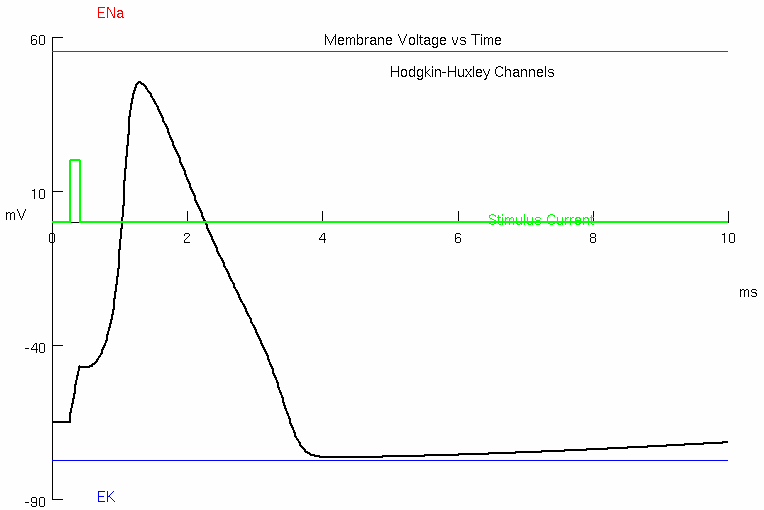
Draw the time course of your predicted Na+ and K+ currents along with the aligned action potential. ( Pick key time points along the action potential to note the conductance and driving force. )

Now open Membrane Current Plots along with Voltage vs Time Plot
Change total # (ms) to 10 ms
Reset and Run
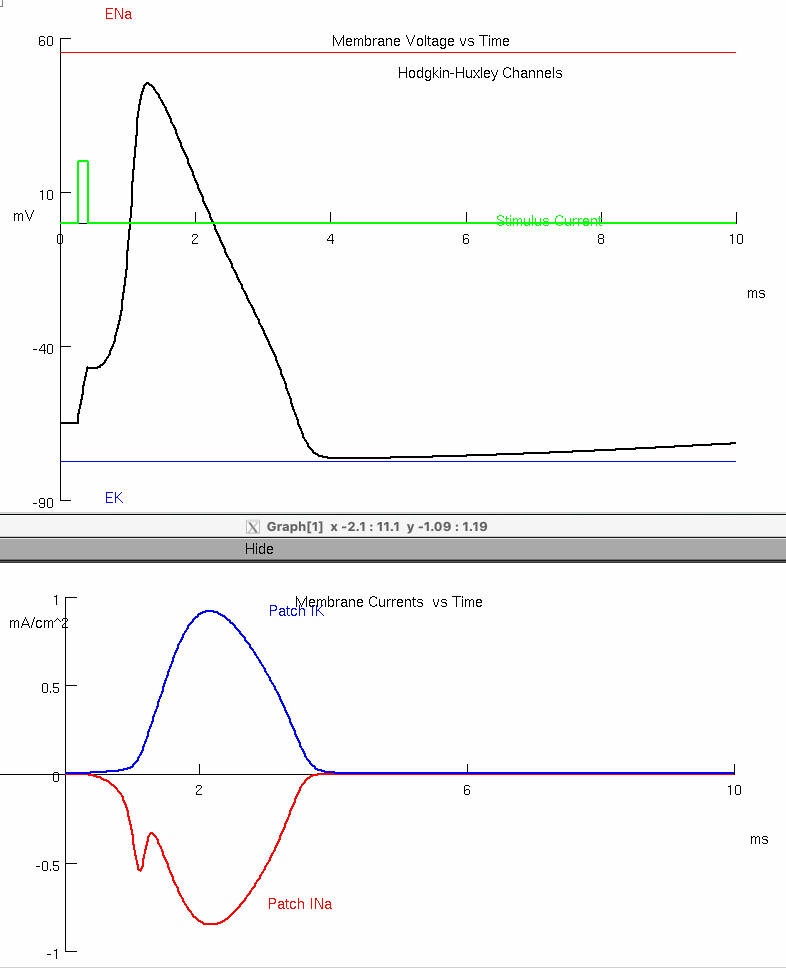
Compare your prediction with the simulation and note differences. If different , redraw the currents along with the aligned action potential.
Briefly explain the time course of INa and IK
sodium opens early and closes quickly for inactivation
potassium delay in opening , but then stay open for longer
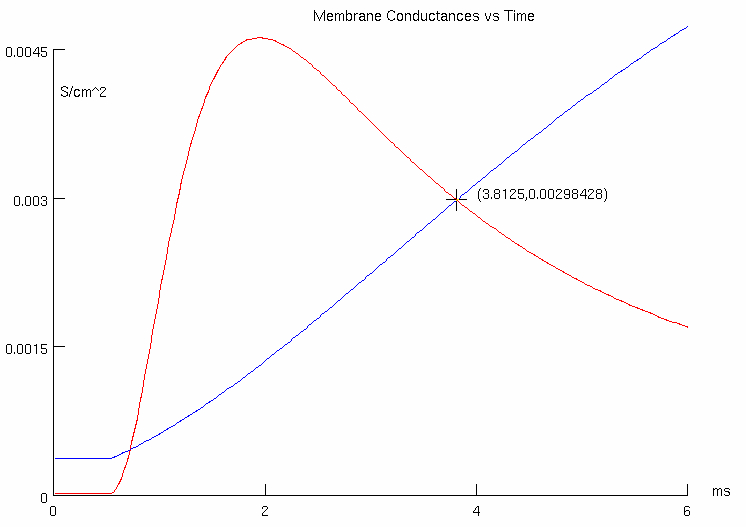
Now open the membrane conductance plots
Assure that the axis extends to 10 ms
Reset and Run
Add the conductance plots to your drawing above
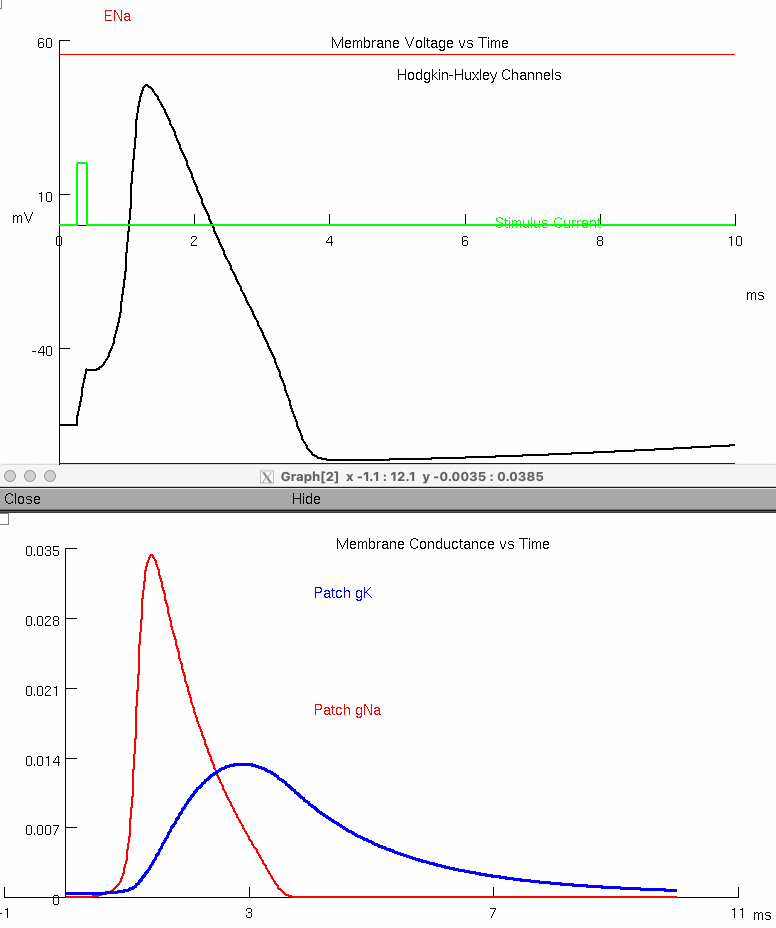
Describe any differences between the time course of the conductance plots and the current plots.
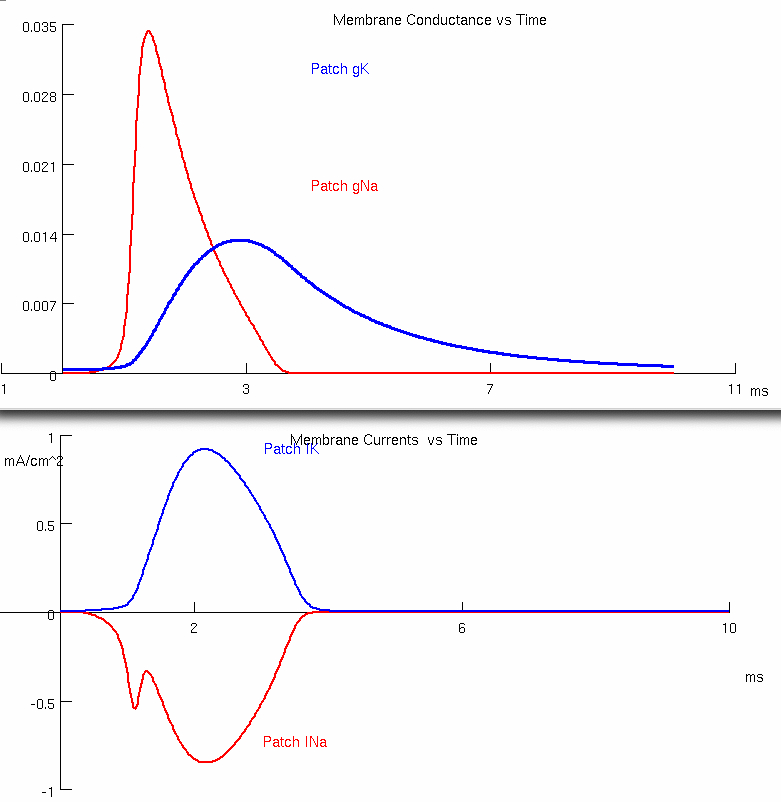
the lag is much more obvious for potassium in the conductance plot
you can more clearly when sodium is conducting
Examine the peak of the action potential and the Na+ Nernst potential , and briefly explain the relationship.
action potential peak =
sodium Nernst =
the action potential peak approaches the nernst values as you conduct ions of that type
Examine IK and INa at the time points when Vm is not changing ( maximums and minimums ) , and Vm when either IK or INa are not changing. Briefly explain the relationship between these currents and Vm.
when
when current is not changing , the channels are inactivated or closed