Part 1 - Measuring Voltage ( or Current Clamp )
How membrane potential varies with stimulus amplitude
Choose tutorial "Introduction to Neurons in Action"
Click on Start the Stimulation
Click on Stimulus Control ( in Panel & Graph Manager window )
Click on IClamp ( in Stimulus Control window )
Click on Voltage vs. Time Plot ( in Panel & Graph Manager window )
Increase Total # ( ms ) to 8 ms ( in Run Control window )
Click on Reset & Run ( in Run Control window )
Right Click on the Graph , hold, scroll down to Keep Lines start stimulating at 0.06 nA
Vary the amplitude of stimulation ( change amplitude , nA , in Stimulus Control window )
Click on Reset and Run
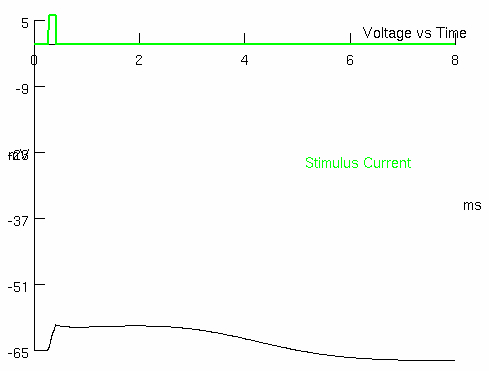
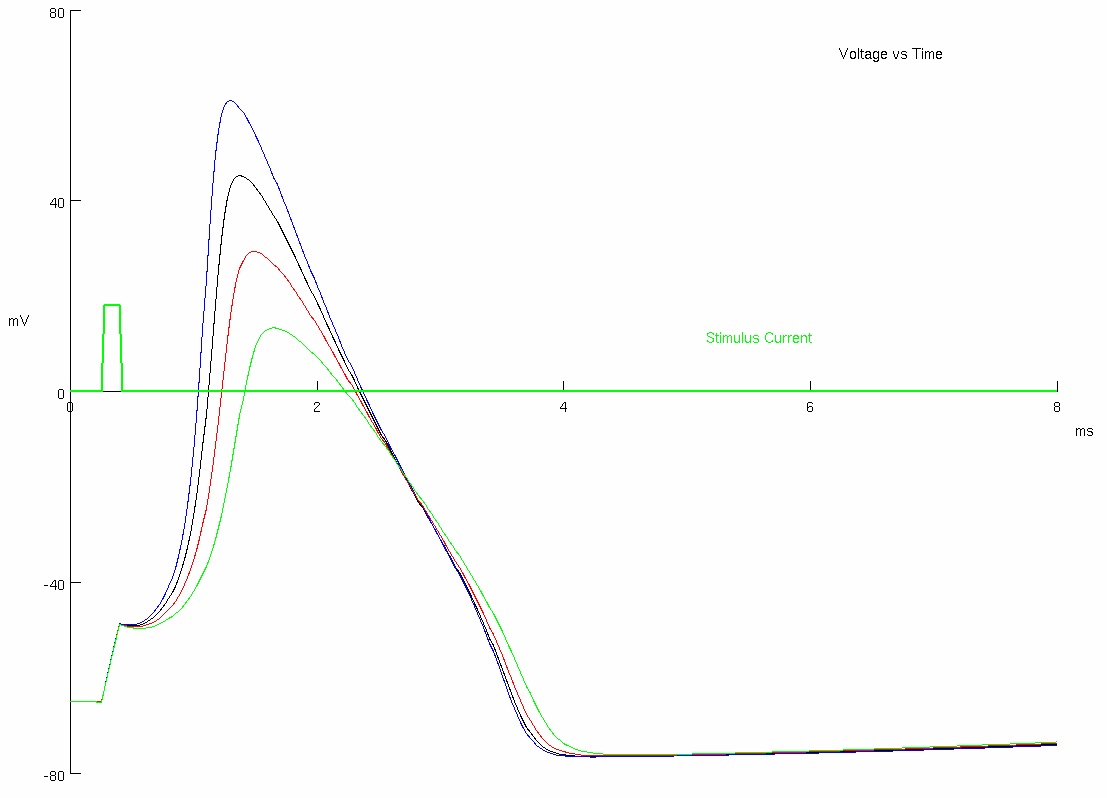
Describe what happens ( sketch representative voltages traces to illustrate )
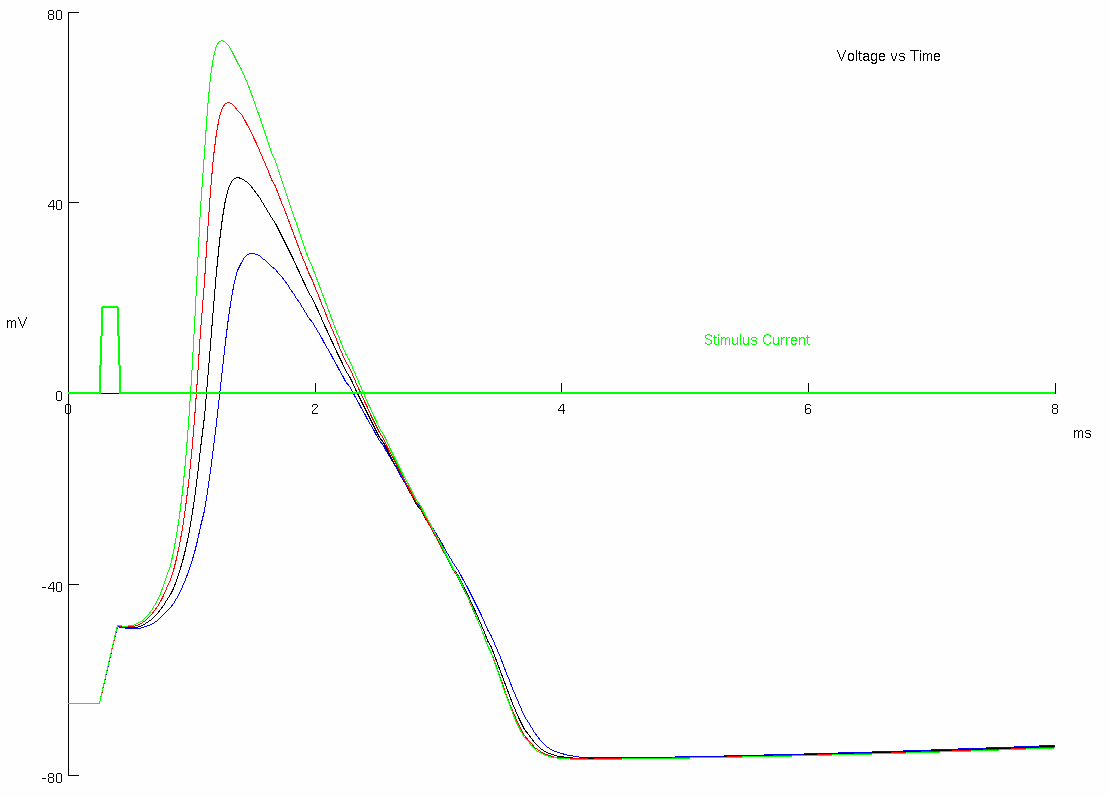
0.0300 nA = blue = halving = still no action potential
0.0600 nA = black = default
0.0658 nA = red = first action potential
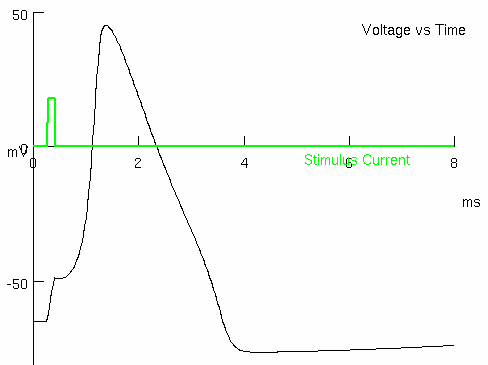
0.0900 nA = green = action potential happening quickly and not delayed
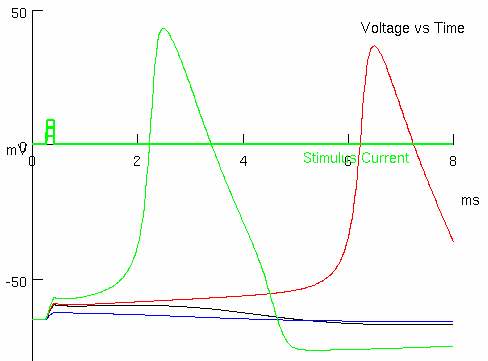
Use the mouse to move over plot , left-click to read amplitude. ( write down each Istim and Vpeak pair )
0.0300 nA = blue = -62.3641 mV
0.0600 nA = black ( original ) = -59.5748 mV
0.0658 nA = red = +36.8368 mV
0.0900 nA = green = +43.5287 mV
Determine whether action potential amplitude changes with stimulus amplitude.
yes , action potential amplitude is direction proportional to stimulus amplitude
Determine the threshold amplitude.
0.0658 nA = +36.8368 mV
Determine whether threshold changes with stimulus amplitude
the time it takes to reach threshold is inversely proportional to the stimulus amplitude
threshold is reached quicker with larger stimulus amplitudes
Part 2 - Changing Sodium Ion Concentrations
Erase Lines
Change Stimulus amplitude to 0.18 nA
Keep Lines
Reset and Run to get control trace
Click on Patch Parameters
a.) Extracellular Na+ Concentration
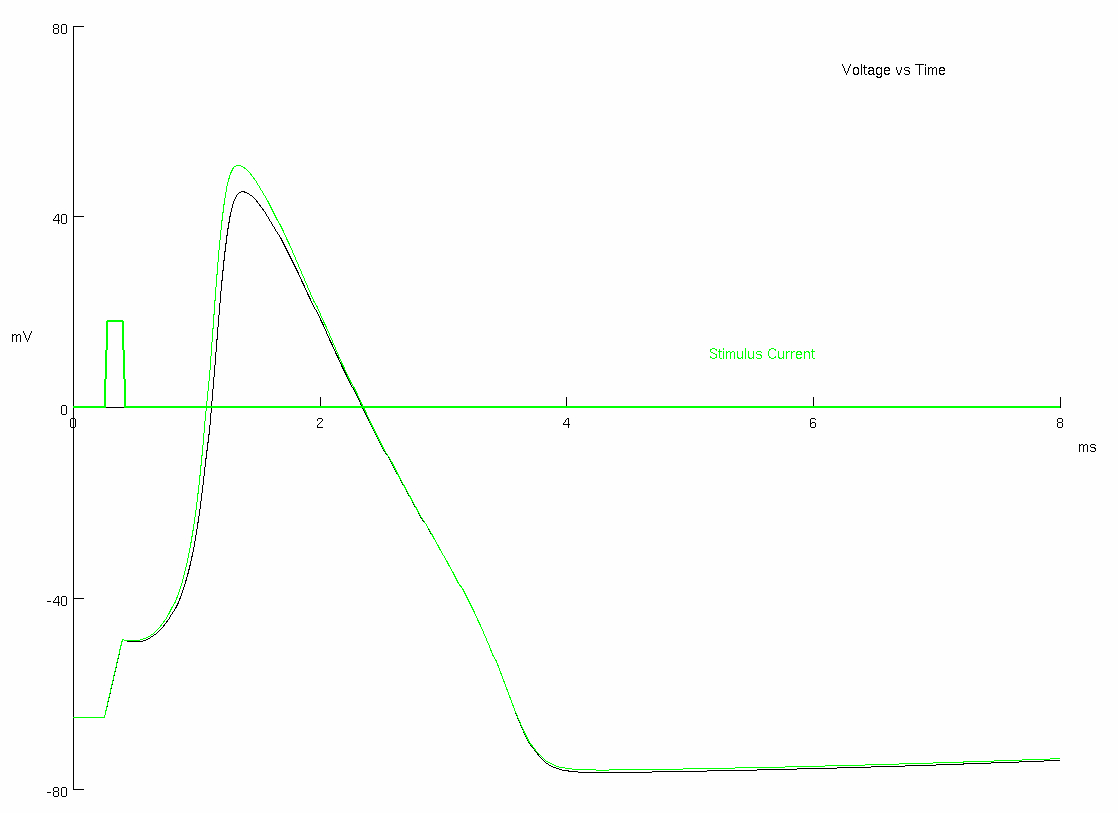
Change Extracellular Na. Start by halving & doubling.
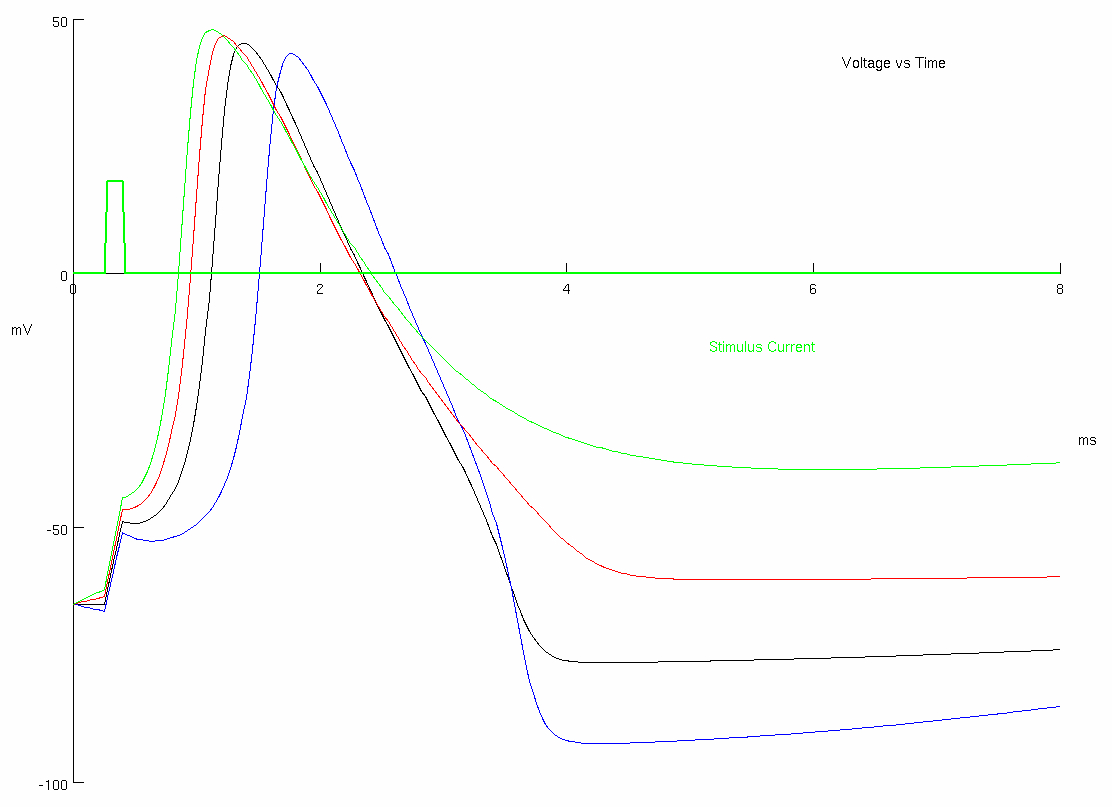
Describe what happens and the underlying processes at work , measuring Vm at key points during the time course ( sketch representative voltages traces to illustrate ) :
Determine which parts of the AP changes , if any
Determine which parts of the AP do not change.
threshold potential
time to reach
Discuss your interpretation of these results.
Driving Force =
Driving Force
nernst is more positive the more extracellular concentration is increased
nernst is more negative the more inside concentration is increased
Contrast these results with what happened when you changed stimulus amplitude.
modifying stimulus amplitude determines if we reach threshold or not , and how quickly
modifying extracellular sodium concentration doesn't change threshold
changes the depolorization phase , steeper slope
b.) Intracellular Na+ concentration
Erase Lines
Set extracellular Na+ concentration back to default ( click on red check )
Reset & Run to get control trace
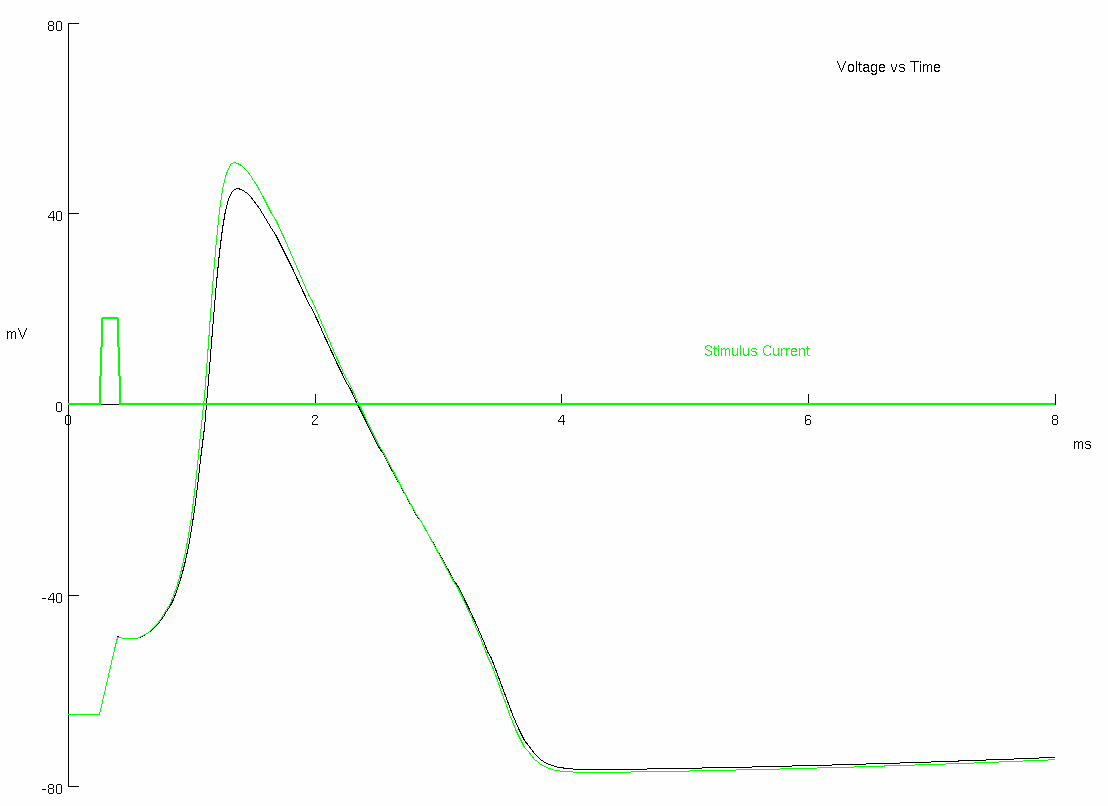
Change Intracellular Na+
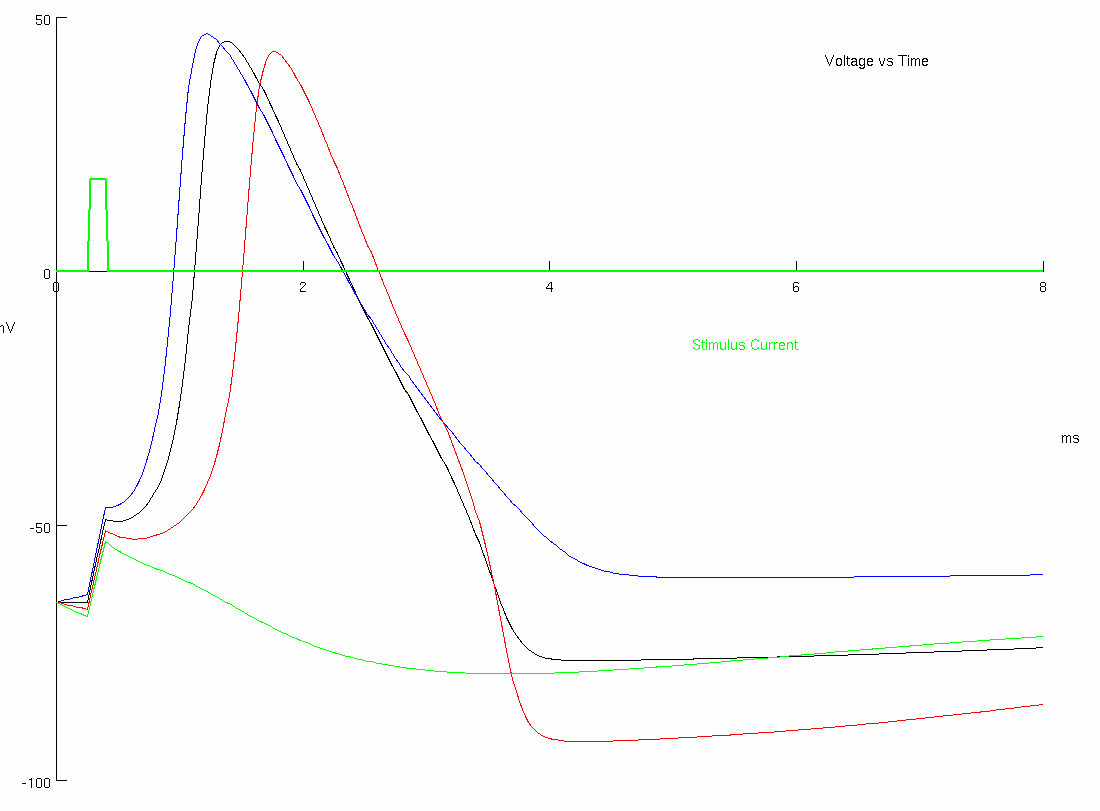
Describe what happens ( by measuring Vm ) and the underlying processes at work ( sketch representative voltages traces to illustrate ) :
= blue
= black ( original )
= red
Determine which parts of the AP changes , if any
Determine which parts of the AP do not change.
threshold voltage
Discuss your interpretation of these results.
everything is flipped compared to changing proportions of extracellular concentrations
Contrast these results with what happened when you changed stimulus amplitude.
no difference between this and extracellular
Part 3 - Changing Potassium Ion Concentrations
Erase Lines
Set intracellular Na concentration back to default ( if not already )
Change Stimulus amplitude to 0.18 nA
Keep Lines
Reset and Run to get control trace
a.) Extracellular K+ Concentration
Change Extracellular K. Start by halving & doubling.
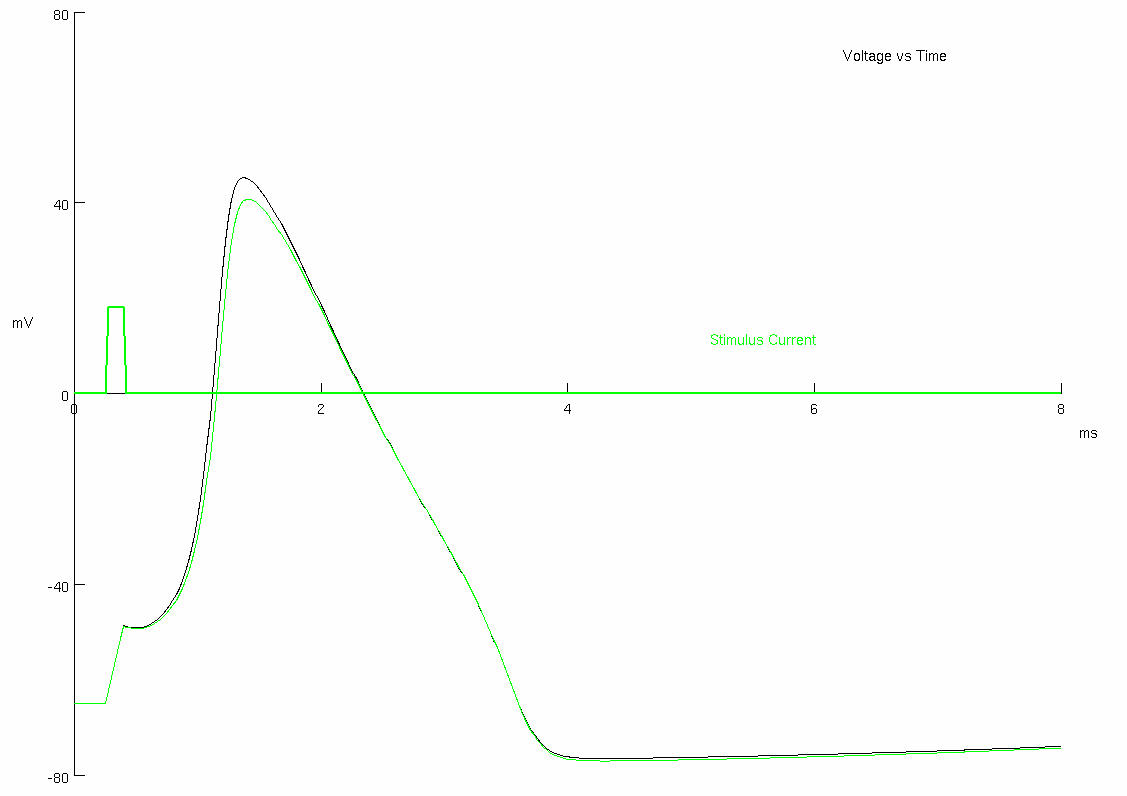
Describe what happens and the underlying processes at work , measuring Vm at key points during the time course ( sketch representative voltages traces to illustrate ) :
@
@
@
Contrast with what happened when you changed extracellular Na+ concentration :
b.) Intracellular K+ concentration
Erase Lines
Set extracellular K+ concentration back to default ( click on red check )
Reset & Run to get control trace
Change Intracellular K+
Describe what happens ( by measuring Vm ) and the underlying processes at work ( sketch representative voltages traces to illustrate ) :
= blue @
= black ( original )
= red @ @
Try increasing and decreasing extracellular Na+ concentration by 3 mM , then extracellular K+ concentration by 3 mM :
increasing
increasing
very similar to above , just earlier in time
decreasing
increasing
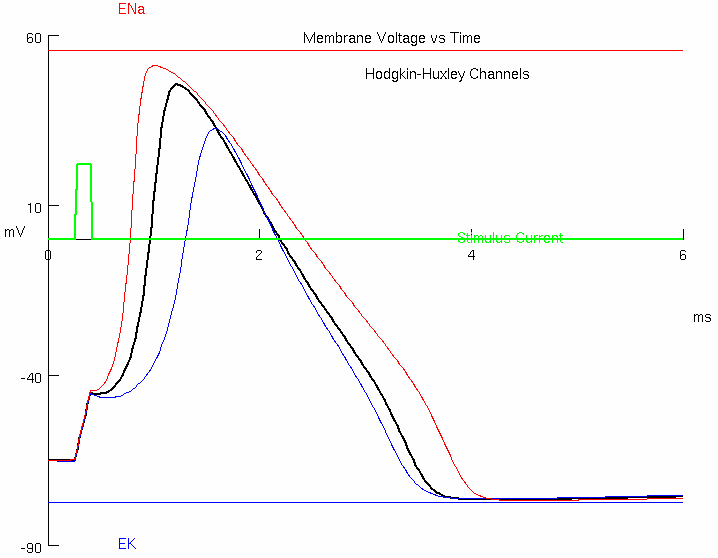
Part 4 - Blocking Na+ Channels ( or decreasing conductance )
Go to the "The Na Action Potential" Tutorial
Start the Simulation
Increase the total ms to 6 ms
In Stimulus Control , increase the stimulus amplitude to 0.22 nA
Keep lines
In Patch Parameters , half and double the Na Channel Density ( halving is like blocking Na channels )
Discuss your observations of what happens.
= blue : @ faster to reach
= black ( original )
= red @ faster to reach
Part 5 - Blocking K+ Channels ( or decreasing conductance )
First make a prediction as to what halving the K+ channel density will do :
sodium will have less competition , so it will reach
Return Na Channel Density to default
Repeat exercise described above , but now change K+ Channel Density ( halving is like blocking K+ channels )
Discuss your observations of what happens
slower time to reach
faster time to reach
faster to reach
slower to reach
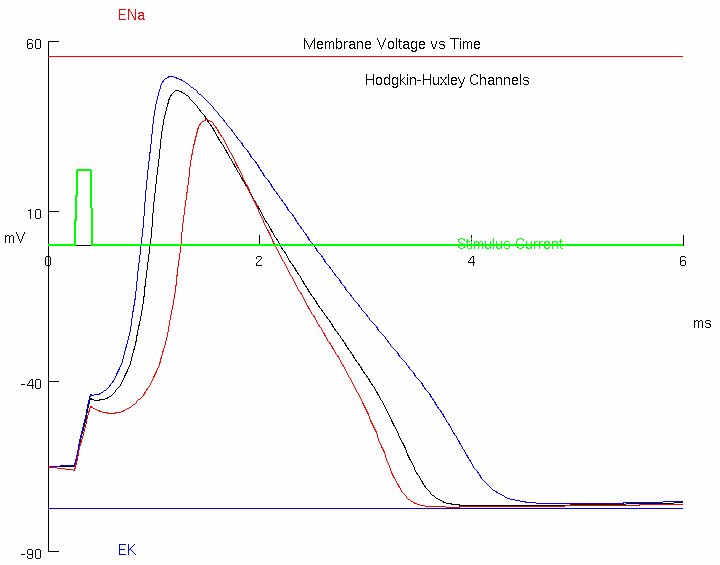
Compare with your prediction
slower time to reach
faster time to reach