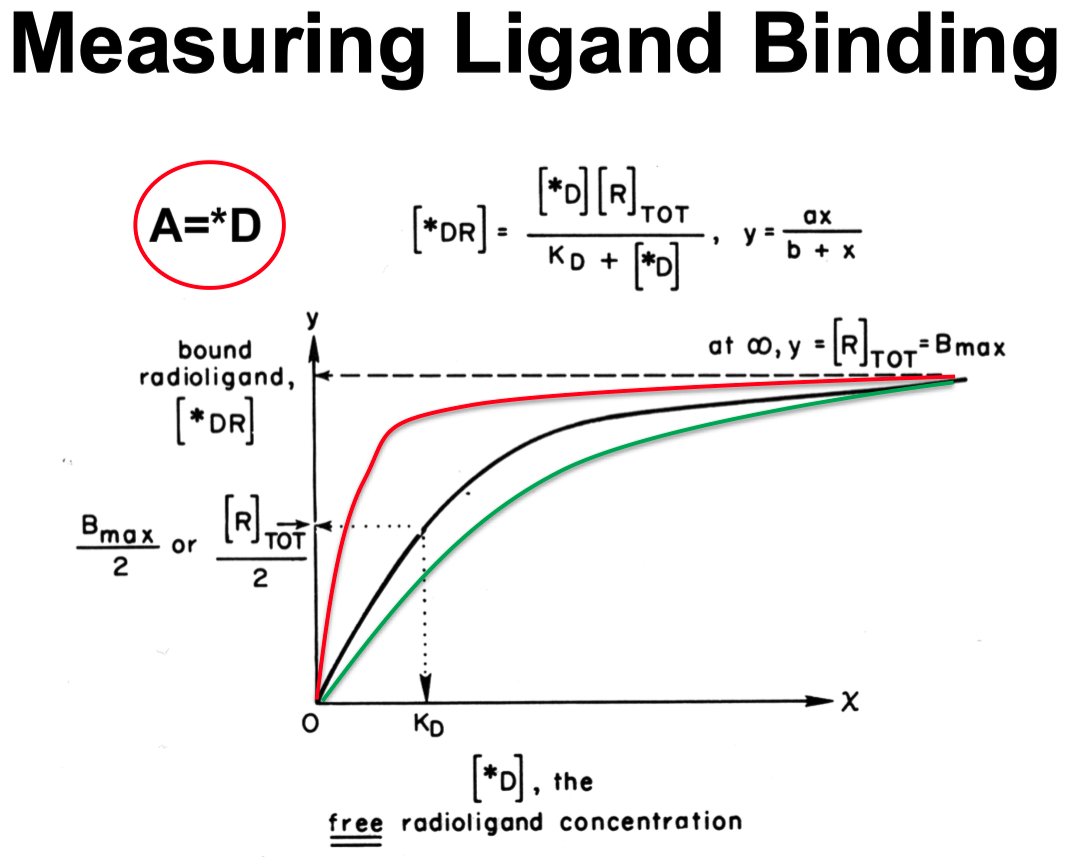
KD
the lower the number ( concentration ) , the higher the affinity of a drug for the receptor
Let
Let
Let
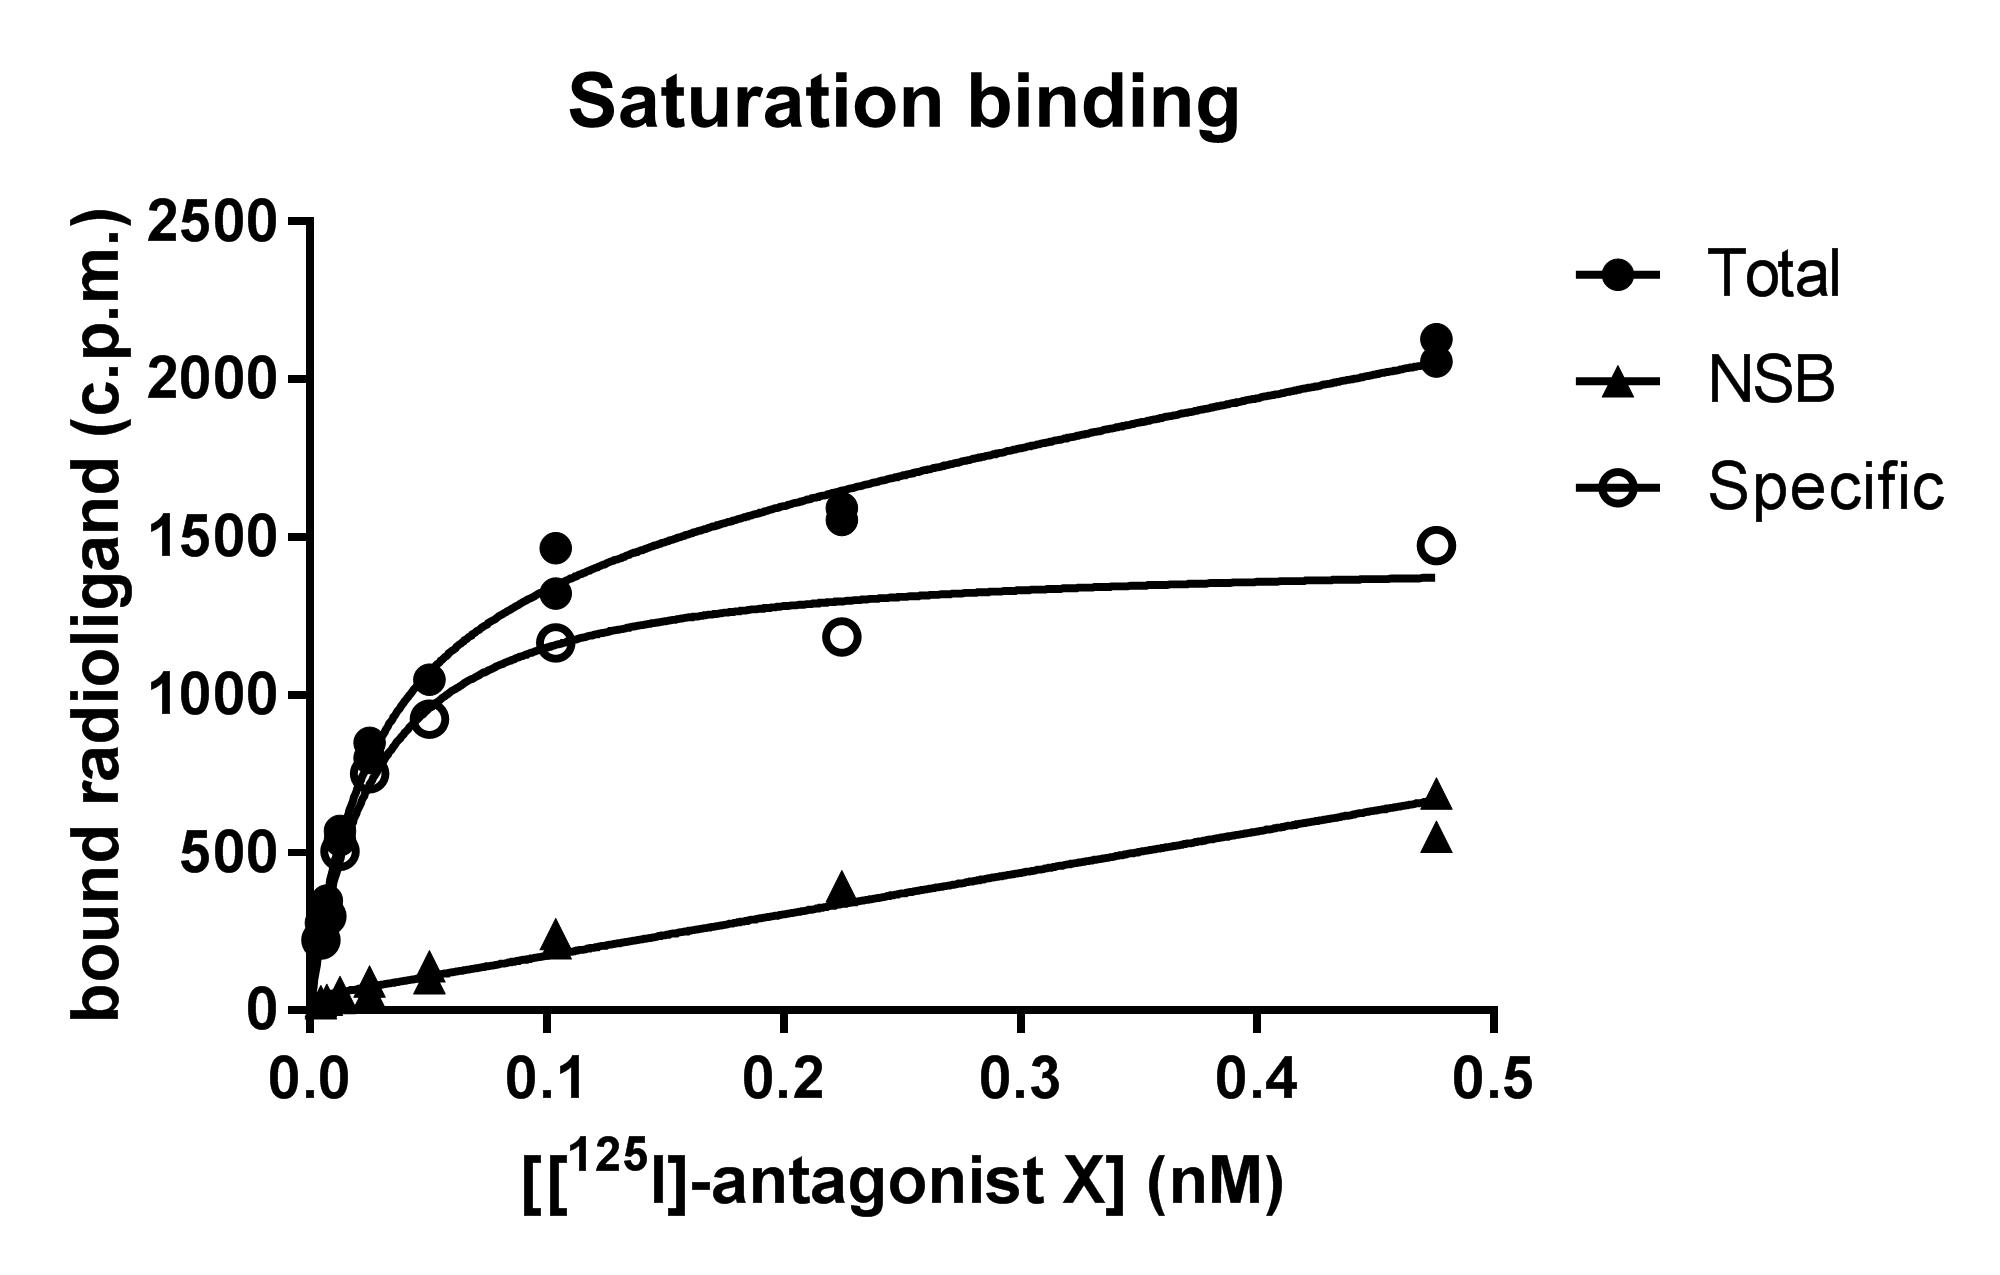
From Radioligand Binding Assays to a Scatchard Plot
Perform Total Binding ( Curve 1 )
Use only radiolabeled ligand ( "hot" ligand )
This includes both specific and non-specific binding.
Incubate receptor preparation with increasing concentrations of radioligand
Measure total bound radioactivity at each concentration
Total Binding
Specific binding ( to actual receptors )
Non-specific binding ( to membranes , non-receptor sites )
Measure Non-Specific Binding ( Curve 2 ) :
Add an excess of non-radioactive ligand ( "cold" ligand )
This competes with the radioligand for receptor sites , preventing it from binding specifically
What remains bound is only non-specific binding
Measure bound radioactivity at each radioligand concentration
This curve represents non-specific binding (
Calculate Specific Binding ( Curve 3 ) :
Subtract non-specific binding from total binding
This isolates only the radioligand bound to receptors.
curve represents specific binding , which follows saturation kinetics and is used for Scatchard analysis.
Generate a Scatchard Plot :
Use specific binding (
Plot:
Where:
Rearrange into a linear equation :
Scatchard Plot Equation for Single Binding System :
The slope gives
The binding of drugs/transmitters/hormones to receptors can be measured directly by the use of radioactive drug molecules
Used to determine affinity of drug for receptor and receptor density of tissue.

Radioligand Binding Methods :
Centrifugation
Filtration Assay :
Homogenise tissue
Incubate with ‘hot’ compound with without saturating [] cold compound.
Rapidly filter.
Count bound and free.
Define pA2
p = potency
A = antagonist
The pA₂ value tells us how strong the fake ligand ( antagonist ) is at blocking the real ligand ( agonist )
a large pA₂ for the antagonist :
a small amount of antagonist doubles the dose of agonist needed to start the signal
a small pA₂ for the antagonist :
a large amount of the antagonist is needed to block the agonist
Defined as negative logarithm of its molar concentration required to double the agonist dose needed to achieve the same effect.
pharmacological term used to quantify the potency of a competitive antagonist
used as an expression of antagonist potency
where
B = used for antagonist / blocking agents
how tightly the antagonist binds to the receptor
D = used for ligands
Negative Log Approximation :
where
and
Examples :
Thus , a
A
Thus , the larger the
Often calculated from dose-response curves in the presence of various antagonist concentrations
It indicates the concentration at which a competitive antagonist shifts the agonist’s dose-response curve two-fold
i.e., the antagonist concentration that requires doubling of the agonist to achieve the same response
pA2 helps compare relative potencies of different antagonists.
A higher pA2 value indicates a more potent antagonist.
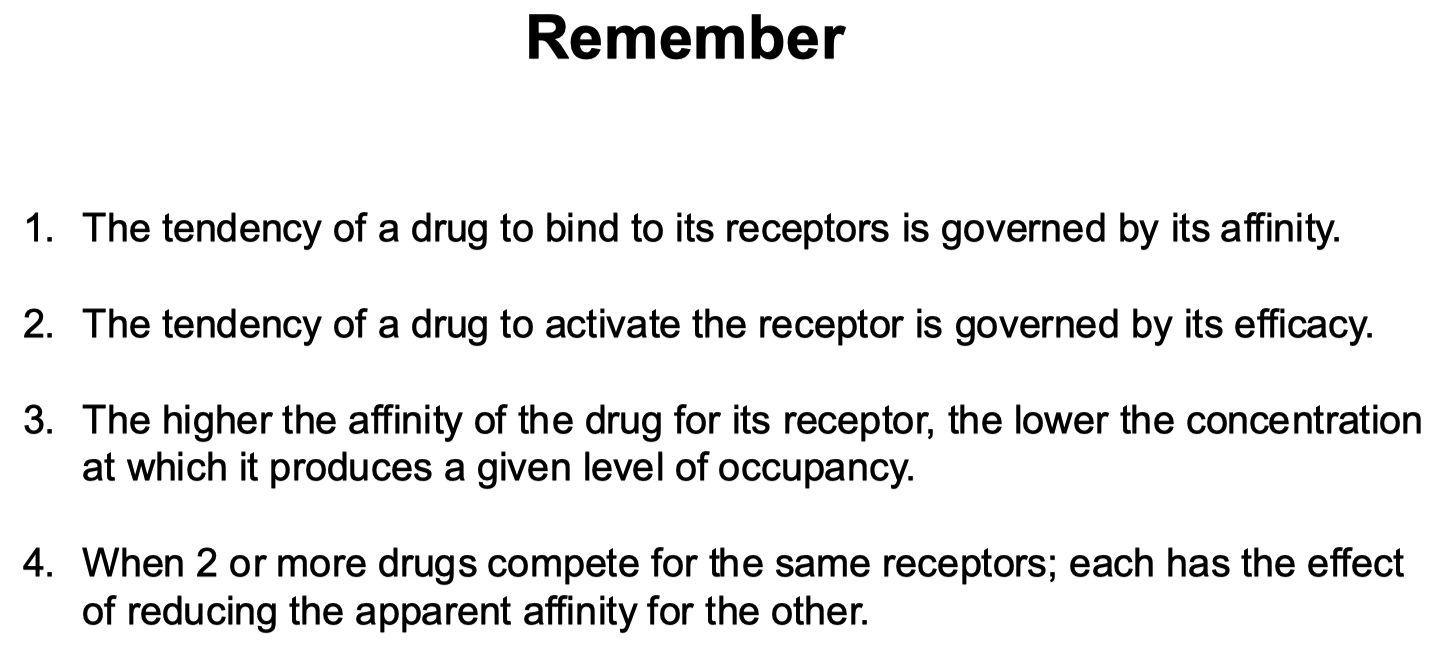
Define the Difference Between Affinity and Efficacy
Affinity = tendency of a drug ( or ligand ) to bind to its receptor
quantified by the
the lower the
Efficacy = the ability of a bound drug to initiate a response
a drug with high efficacy can produce a strong response once bound
Affinity = how well a ligand fits and binds
Efficacy = how effectively that ligand activates the receptor once bound
Give Examples of 4 Different Receptor Transduction Mechanisms
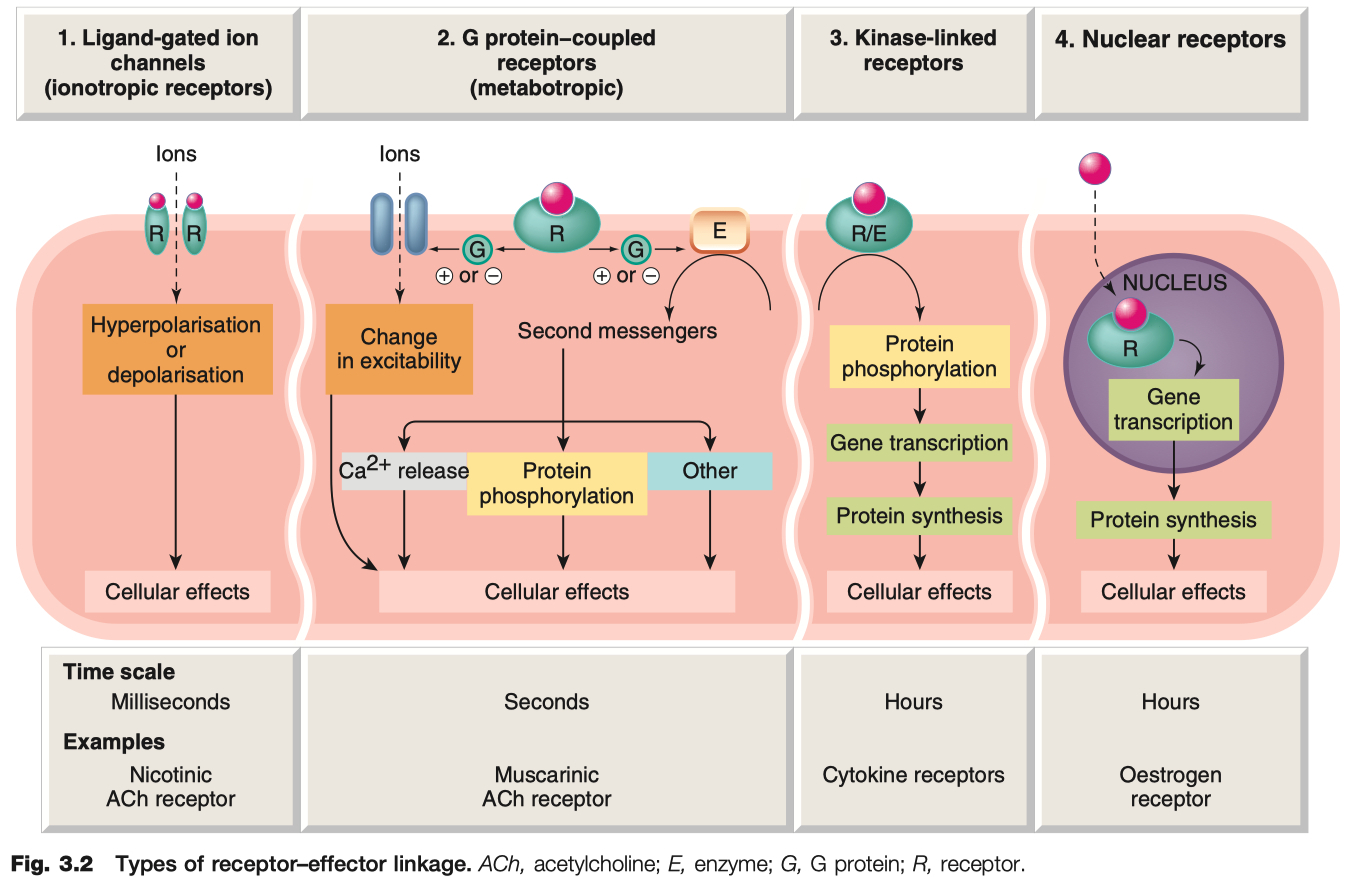
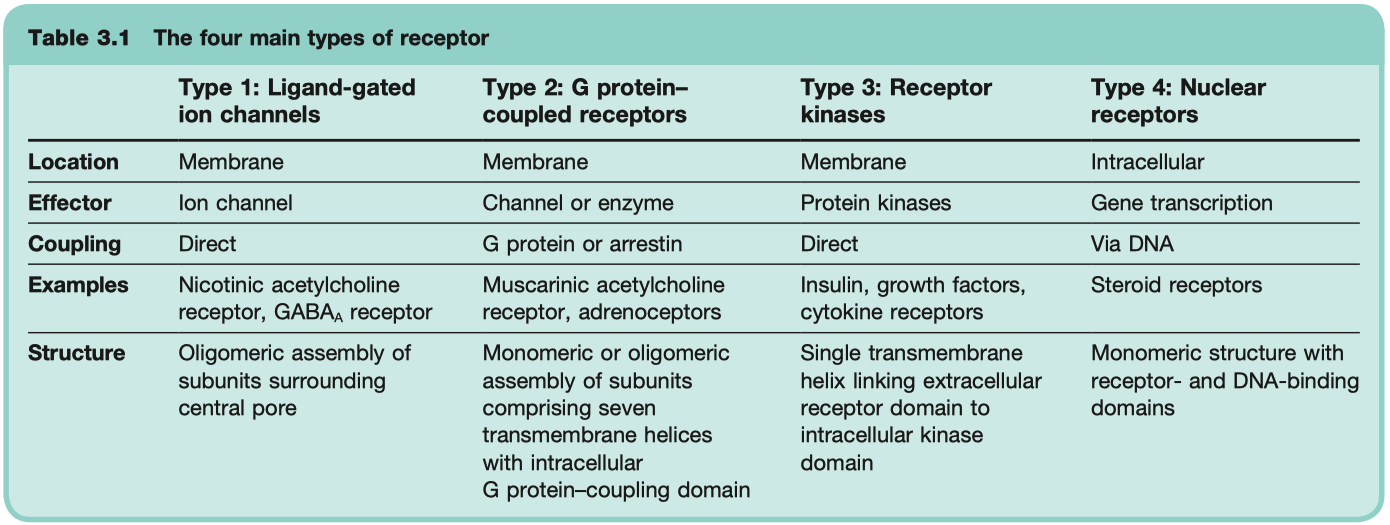
Ligand-Gated Ion Channels
transduce effect in milliseconds
critical for neuronal function
Examples = GABAA Receptor , Nicotinic ACh Receptor , 5HT3 Receptor
Mechanism: Ligand binding → opens ion channel → fast changes in membrane potential or ion flux
G-Protein Coupled Receptors ( GPCR )
critical for neuronal function
Signal Molecule binds and Activates GPCR (
binds and inhibits adenylyl cyclase
reduces PKA activation
reduces cell response ( gene transcription )
Signal Molecule binds and Activates GPCR (
binds and stimulates adenylyl cyclase
increases PKA activation
increases cell response ( gene transcription )
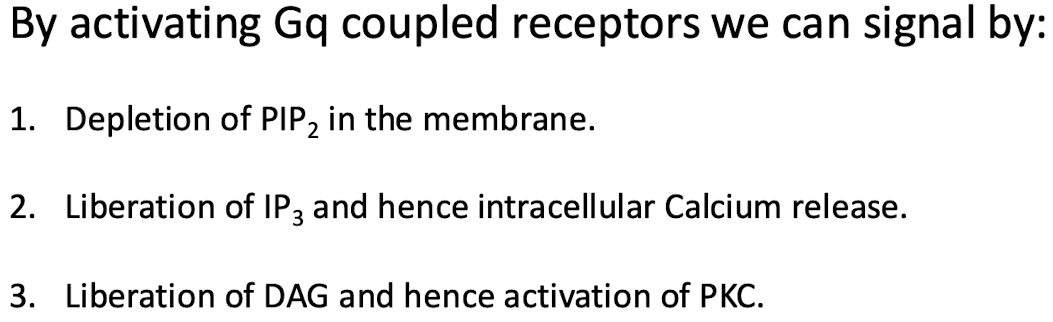
Signal Molecule binds and Activates GPCR (
this depletes levels of PIP2 in the membrane
but voltage gated M-channels ( potassium channels ) need PIP2 in order to open
so M-channels close
this is a SIGNALING event !
the removal of PIP2 closed potassium channels , depolarizes the membrane ,
makes it very easy to fire action potential now
only a little bit of sodium is need to reach the action potential threshold
DAG then activates PKC
IP3 causes calcium to be released from endoplasmic reticulum
the calcium can also reinforce / enhance signaling of PKC
3 Different Ways
Depletion of
Liberation of
Libration of DAG and hence activation of PKC
Describe one alternative pathway that G-protein activation may signal via
Conventional Way = producing signaling molecules
Alternative Way = reduction ! of
Example: β-adrenergic receptors , GABAB , muscarinic ACh , histamine receptors
Mechanism: Ligand binding → G-protein activation ( Gs , Gi , Gq ) → second messenger cascades (e.g., cAMP, IP3/DAG).
Kinase Coupled Receptors
much slower , hours
critical for hormonal function
Example: Insulin receptor ( tyrosine kinase ) , epidermal growth factor receptors , nerve growth factor receptors
Mechanism: Ligand binding → receptor dimerization/activation of intrinsic enzyme activity ( often tyrosine kinase ) → phosphorylation cascades.
Binding of ligand activates intracellular tyrosine kinase domain.
Phosphate from ATP transferred to selected tyrosine residues on side Chains, on receptor and on intracellular signalling proteins.
2 or more receptor oligomers then come together to form dimers or higher multimers.
secondary messenger systems and intermediary products can cross activate with other secondary messenger systems
Nuclear Receptors
very slow , transducer effect in hours
critical for steroid hormone function
Example: Steroid hormone receptors , thyroid hormones , retinoids , and vitamin D
receptors are NOT in the membrane , ONLY in the cytosol
Mechanism: Lipid-soluble ligand enters cell → binds cytosolic or nuclear receptor → alters gene transcription and protein synthesis
receptor generally held in in-active state by inhibitory protein
ligand binds , activating it
receptor moves into nucleus and acts as transcription factor
An important example of hormonal activation of nuclear receptors Is the action of the steroid hormone Cortisol
Describe 5 Routes of Drug Administration
Oral : Drugs are taken through the mouth and absorbed via the gastrointestinal tract
Rectal : Administered through the rectum , useful when oral administration is not feasible
Topical : Applied to the skin or mucous membranes , such as creams or eye drops
Injection : Includes intravenous ( IV ) , intramuscular ( IM ) , and subcutaneous ( SC ) methods for direct delivery into blood or tissue
Respiratory : Inhaled drugs ( e.g., nasal sprays, inhalers ) absorbed through the respiratory tract
O - R - T - I -R
Identify the 3 Compartments of Body Water
Intervascular = blood plasma within blood vessels
3 Liters = 4%
Interstitial = fluid surrounding the cells in tissues
9 Liters = 13%
Intracellular = fluid inside cells ( cytosol )
28 Liters = 41%
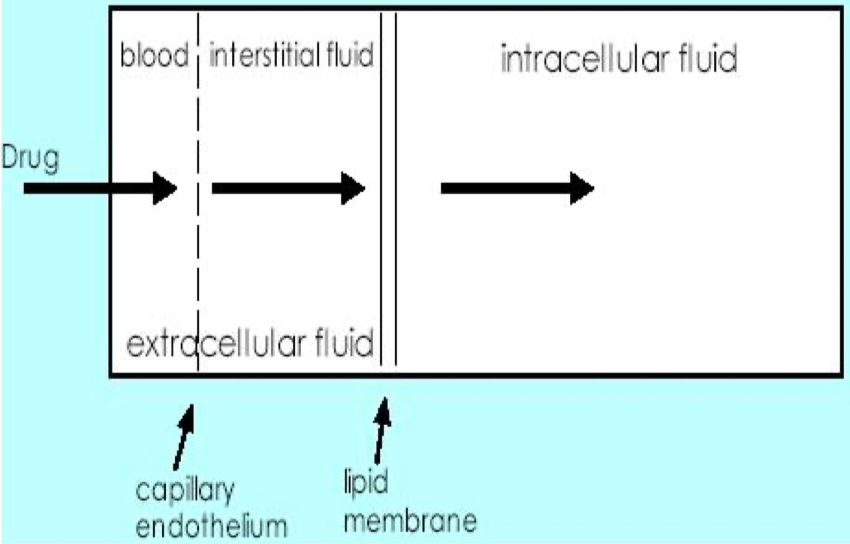
Identify 3 Things that Will Affect Drug Bioavailability
Absorption : Passage through membranes , impacted by drug solubility and ionization
First-Pass Metabolism : Degradation in the gut wall or liver before reaching systemic circulation
Chemical Stability : Destruction of the drug in the gastrointestinal tract ( e.g., stomach acid )
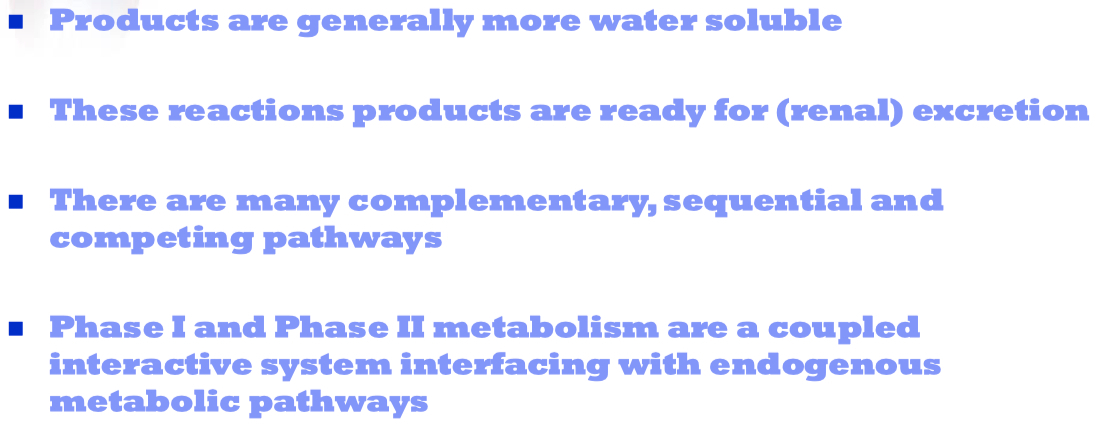
Describe the 2 Phases of Metabolism
Phase I :
Convert parent compound into a more polar / hydrophilic metabolite
Involves oxidation, reduction, or hydrolysis to add or unmask functional groups ( e.g., -OH , -NH2 ) , often preparing the drug for Phase II
Phase II : Conjugation reactions with endogenous substrates to further increase water solubility for excretion.
conjugation with glucoronide , sulfate , acetate , amino acid
try to make them even more polar , to get them out of the body and into the urine
Phase II is the true “detoxification” step in the metabolism process
Describe the 3 Ways that the Body Excretes Drugs
Renal Excretion : Through urine , involving filtration , secretion , and reabsorption in the kidneys
Biliary Excretion : Through bile , often leading to fecal elimination
Respiratory Excretion : Drugs exhaled through the lungs , especially volatile compounds
Cytokines Effects on Nervous System
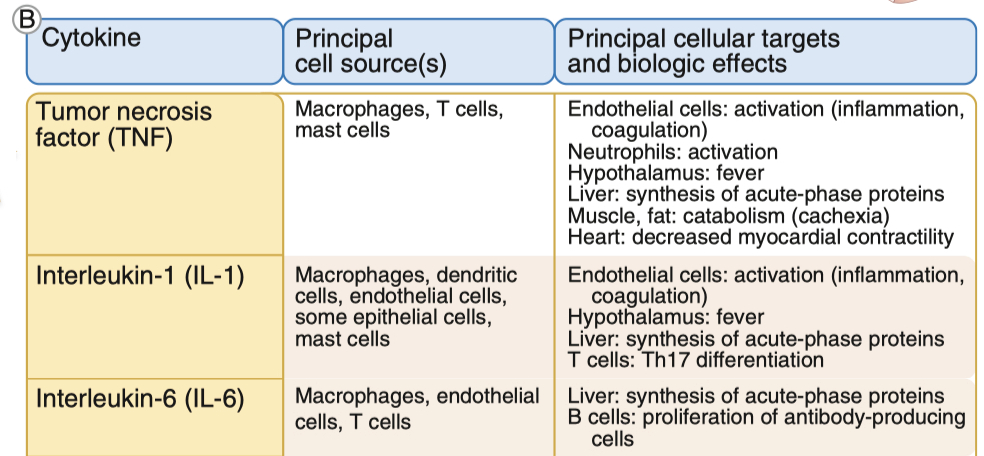
TNF :
induces apoptosis , which is damaging , but limits the spread of more damage in the long-term
increases inflammation , and BBB permeability
IL-1 :
Key driver of sickness behavior: fatigue, loss of appetite, fever, and social withdrawal.
Enhances HPA axis activation by stimulating CRH release → leads to higher cortisol levels.
In stroke and inflammation, IL-1 stimulates neurotrophic factors (like NGF), helping neurons recover.
Role in Stress Adaptation
Short-term : Enhances alertness , mobilizes energy, and promotes fever, which can help fight infections.
Long-term : Chronic IL-1 elevation disrupts cognition and mood ( linked to depression and anxiety in chronic stress conditions
IL-6 :
Activates Janus Kinase ( JAK ) and STAT signaling, which turn on genes related to immune response and neuronal plasticity.
Increases astrocyte proliferation (helps with neuroprotection but can also contribute to neuroinflammation).
Induces fever, sleep regulation, and food intake changes.
Helps modulate glutamate-induced neurotoxicity, protecting neurons.
Role in Stress Adaptation
Promotes neuronal survival, especially in glutamate toxicity scenarios.
Enhances resilience to stress by regulating the HPA axis.
However, excessive IL-6 can increase pain sensitivity (allodynia, hyperalgesia) and worsen neuroinflammation.
Misc
know timing differences for the 4 different receptor types