Glycolysis
Stages of Cellular Metabolism :
Stage 1 = large macromolecules are hydrolyzed into their building blocks.
Stage 2 = building blocks are further degraded into a few common metabolites.
Stage 3 = small molecular weight metabolites like acetyl-CoA are degraded yielding ATP.
ATP = High energy carrier
NADH = electron / proton carrier
In fermentation / anaerobic environments :
ATP is produced by regenerating NAD+ for glycolysis ( lactate dehydrogenase )
Fibromyalgia = decreased lactate dehydrogenase = increased pyruvate and lactate
Warburg Effect = tumors shift from aerobic to anaerobic metabolism
Regulated Glucose Entry :
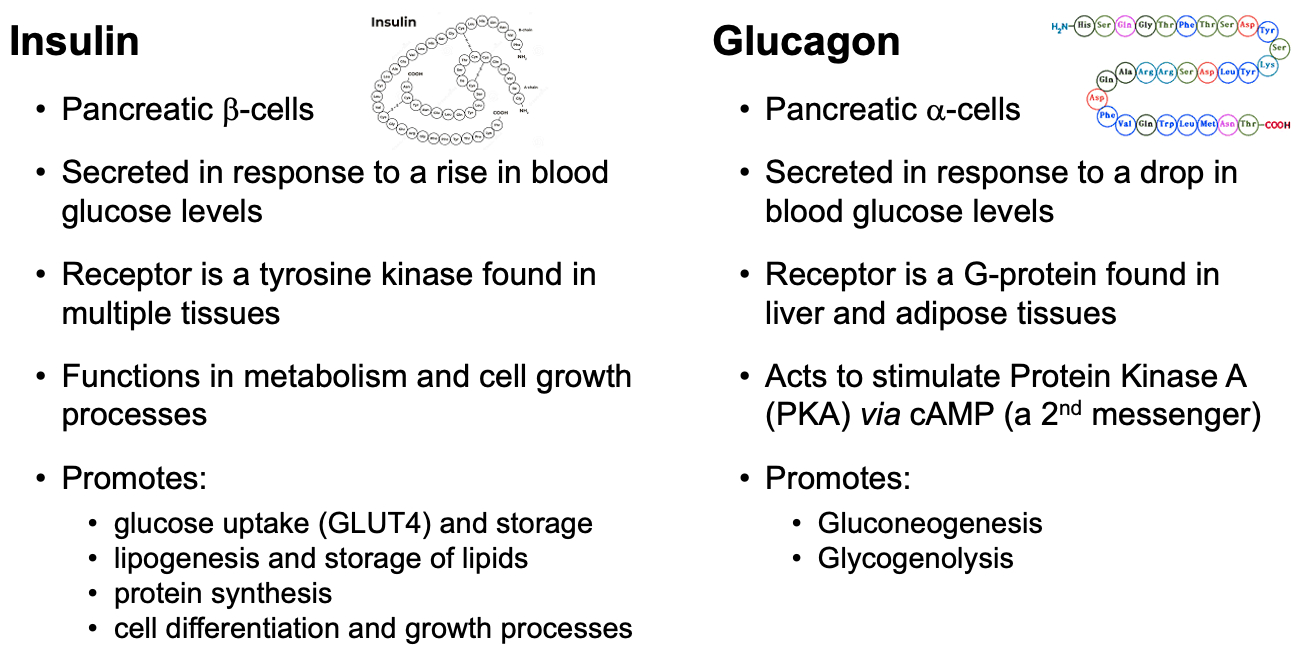
insulin binds to receptor , triggers translocation of GLUT4 into the cell membrane
TCA
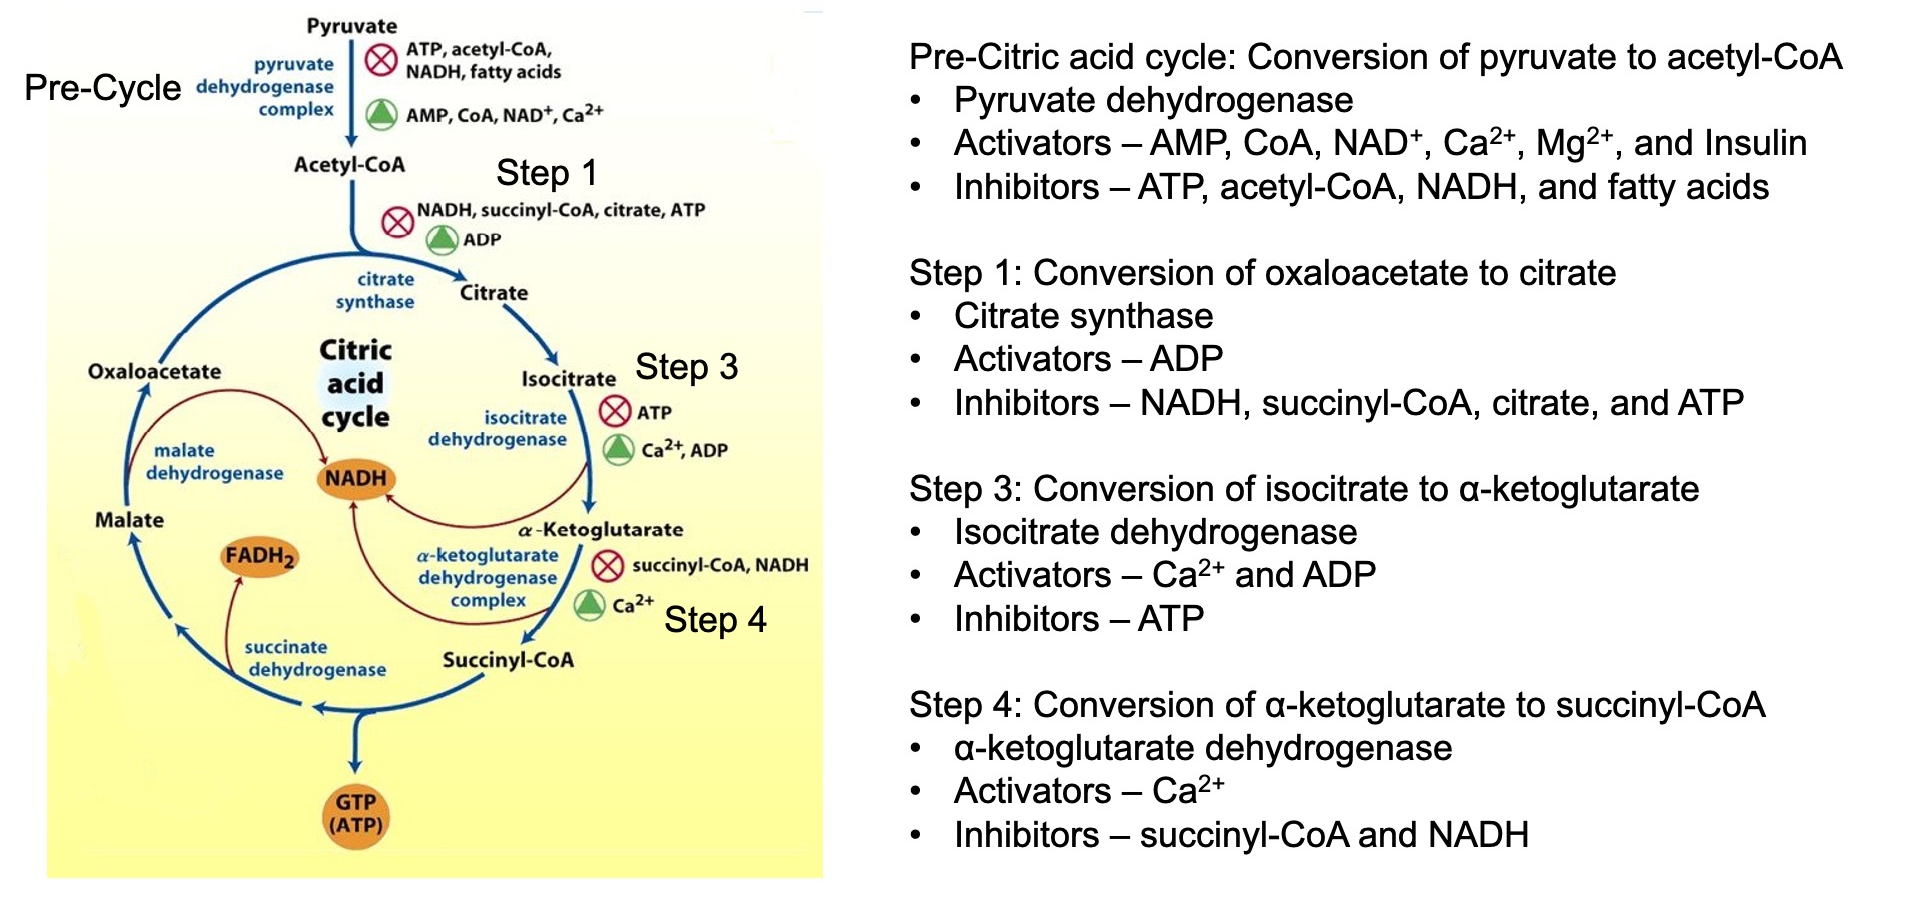
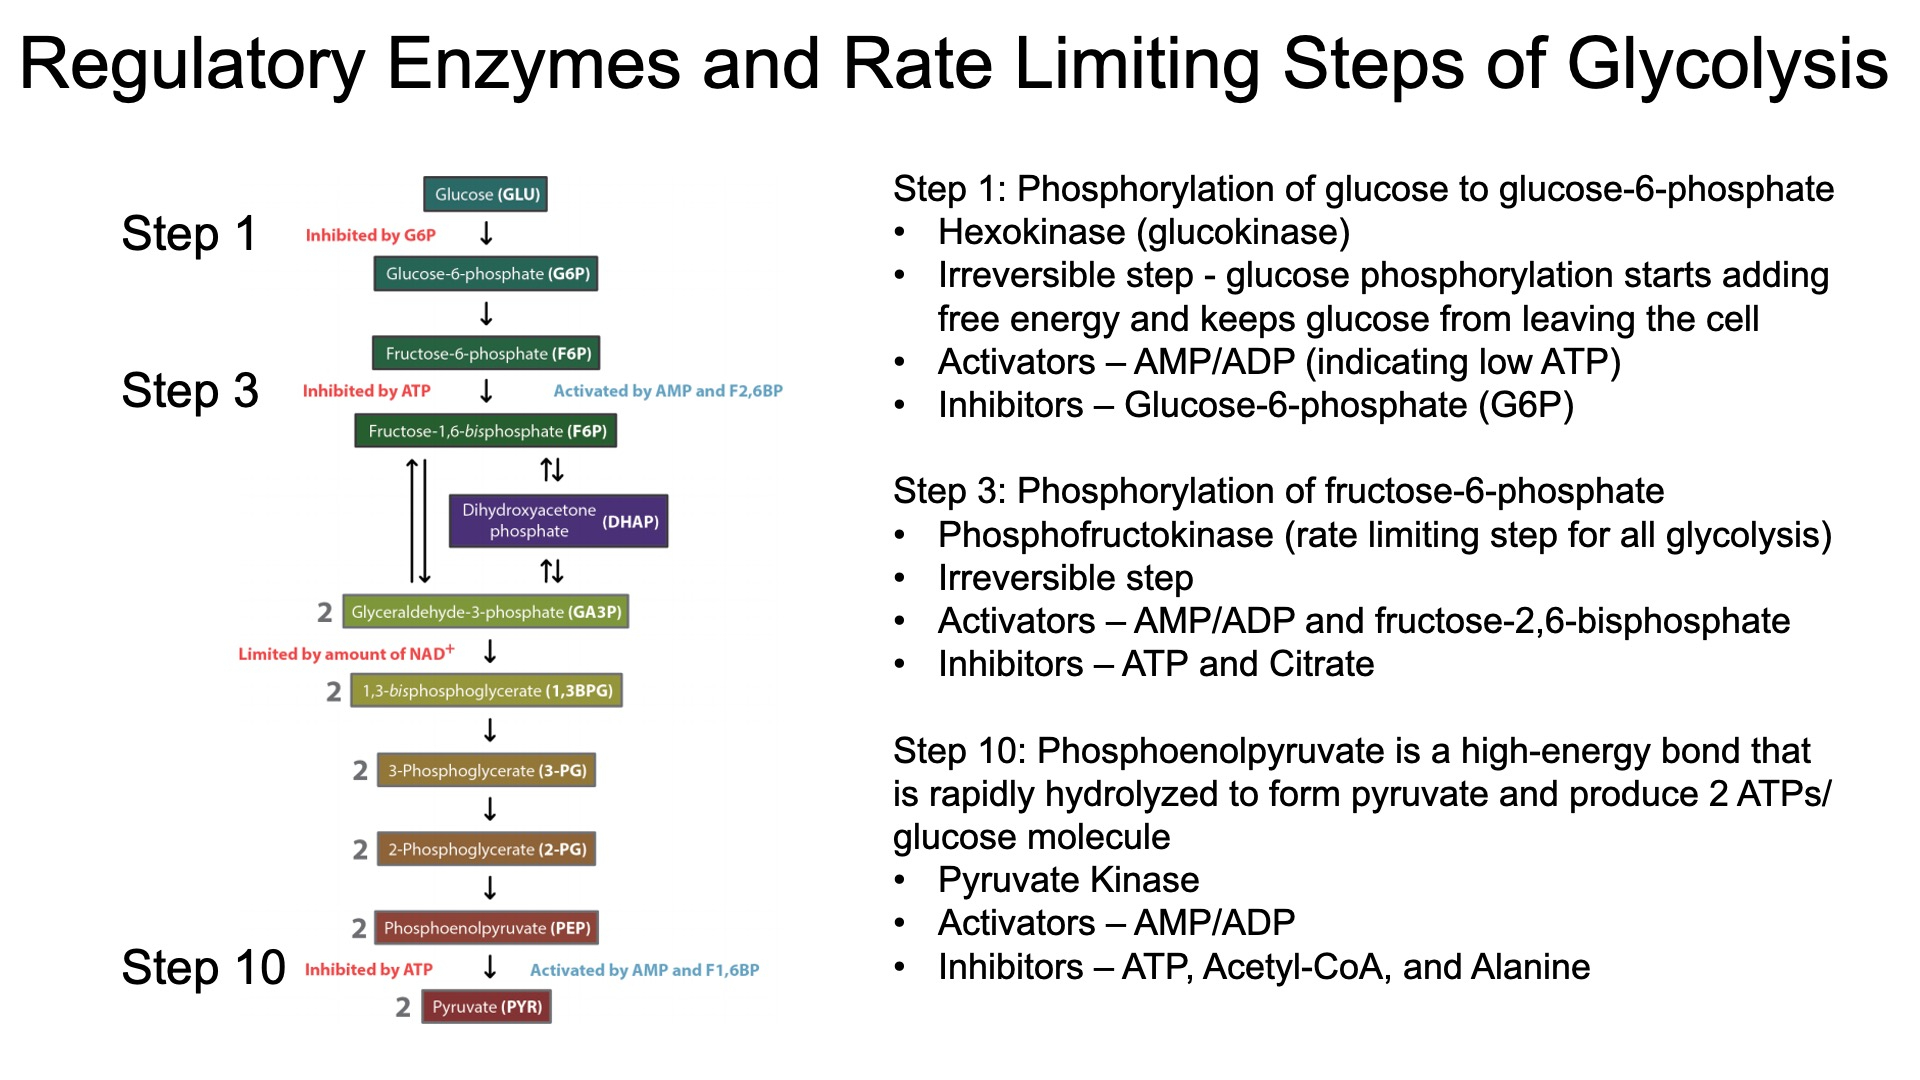
Regulation of Glycolysis :
The citric acid cycle indirectly regulates glycolysis through the levels of ATP , NADH , and citrate
High levels of these molecules signal that the cell has enough energy ,
leading to the inhibition of phosphofructokinase ( PFK )
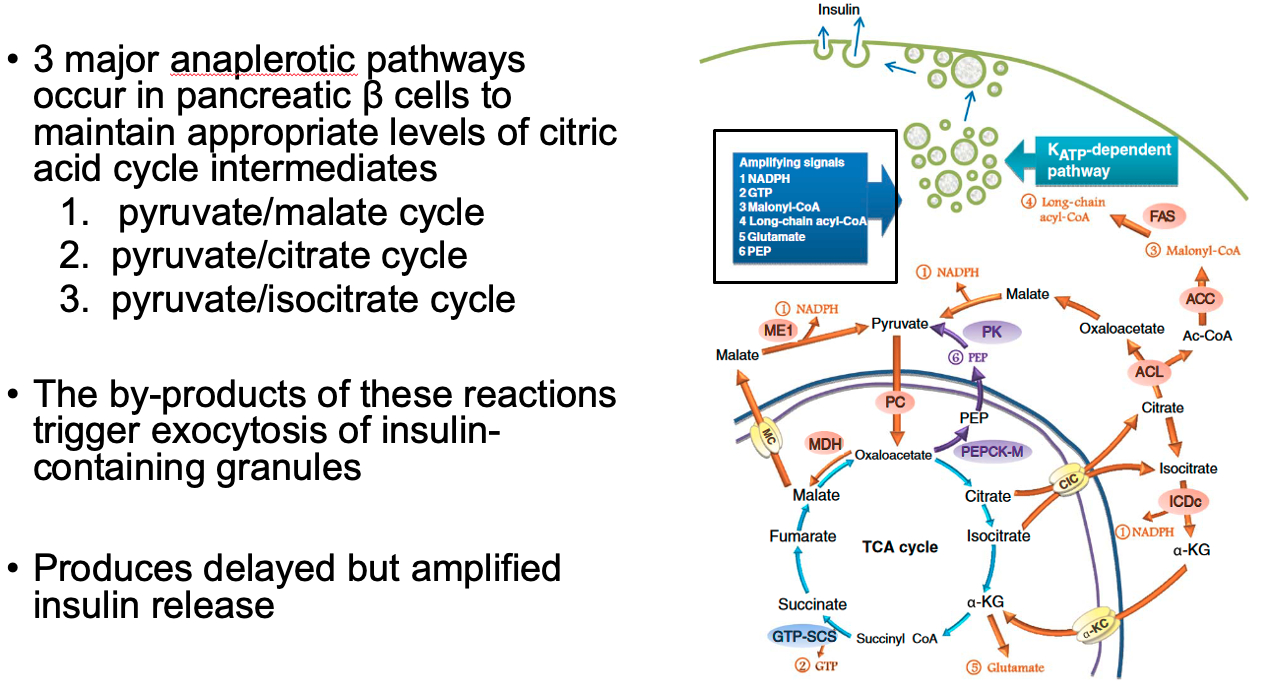
Cataplerotic TCA Reactions = decrease efficiency
Anaplerotic TCA Reactions = help beta cells in pancreas sustain TCA cycle
also by-products of these reactions help trigger exocytosis of insulin granules
Glucose-stimulated-insulin-release ( two phases ) :
Acute Phase of Insulin Release = pre-stored insulin granules released
glycolysis causes high ATP levels from glycolysis
ATP blocks potassium channels
cell depolarizes
calcium enters via voltage-gated calcium channels
causes insulin release from pre-stored insulin granules
lasts a few minutes
Latent Phase of Insulin Release = glucose enters beta cells of pancreas
by-products of anapleorotic pathways trigger exocytosis of insulin-containing granules
produces delayed but amplified insulin release
Bi-Functional Enzyme ( 6PFK2/FBPase2 ) :
Fasting :
Glucagon ➡️ PKA ➡️ Phosphorylates Bi-Functional Enzyme ➡️ Less Kinase Activity ➡️ Less F-2,6-BP ➡️ Less PFK1 Activation ➡️ Less Glycolysis
Fed :
Insulin ➡️ PI 3-Kinase ➡️ De-phosphorylates Bi-Functional Enzyme ➡️ More Kinase Activity ➡️ More F-2,6-BP ➡️ More PFK1 Activation ➡️ More Glycolysis
ETC
ETC makes 15 times more ATP than glycolysis , but glycolysis is way faster
Electron transport moves electrons from high-energy carriers ( NADH and FADH₂ ) through the electron transport chain , releasing free energy as they move to lower energy states towards oxygen.
This free energy is used by protein complexes to actively pump H⁺ ions from the mitochondrial matrix into the intermembrane space, establishing a chemiosmotic gradient.
The proton gradient stores potential energy , which drives protons back into the matrix through ATP synthase , converting the free energy into ATP synthesis.
NADH: Nicotinamide adenine dinucleotide ( reduced form )
NAD⁺: Nicotinamide adenine dinucleotide ( oxidized form )
CoQ: Coenzyme Q ( ubiquinone )
CoQH₂: Ubiquinol ( reduced form of CoQ )
Five Electron Carriers Used :
Flavoproteins ( FMN in Complex I , FAD in Complex II ) :
Accept and donate 2 electrons ( FMN/FMNH₂ , FAD/FADH₂ )
Iron-Sulfur ( Fe-S ) Proteins ( in Complexes I, II, and III ) :
Transfer one electron at a time using iron atoms in Fe-S clusters
Ubiquinone ( CoQ ) ( mobile between Complexes I , II , and III ) :
Transfers both electrons and protons , shuttling electrons between complexes
Cytochromes ( in Complexes III , IV , and mobile cytochrome c ) :
Heme proteins that carry one electron at a time , utilizing iron ( Fe²⁺ / Fe³⁺ ) in heme groups
Copper Centers ( CuA and CuB in Complex IV ) :
Transfer one electron at a time , with copper ions ( Cu⁺ / Cu²⁺ ) facilitating electron transfer and oxygen reduction
NADH ( Complex I entry ) :
Complex I pumps 4 H⁺
Complex III pumps 4 H⁺
Complex IV pumps 2 H⁺
Total: 10 H⁺ pumped per electron pair from NADH
Total ATP =
FADH₂ ( Complex II entry ) :
Complex II does not pump H⁺ but passes electrons to CoQ
Complex III pumps 4 H⁺
Complex IV pumps 2 H⁺
Total: 6 H⁺ pumped per electron pair from FADH₂
Total ATP =
H⁺ Required to Make ATP :
It is estimated that about 4 H⁺ ions are required to synthesize 1 ATP molecule. This includes:
3 H⁺ ions for ATP synthesis through ATP synthase.
1 H⁺ ion to transport ADP and phosphate ( Pi ) into the mitochondrial matrix for ATP synthesis.
Each full cycle of the ETC allows the production of roughly 2.5 ATP per NADH and 1.5 ATP per FADH₂ due to the difference in proton pumping.
Effect on pH :
The proton pumping into the intermembrane space causes :
a decrease in pH ( more acidic ) in the intermembrane space
and a relative increase in pH ( more basic ) in the mitochondrial matrix
This pH difference , along with the charge difference ( more positive in the intermembrane space ) , creates the proton motive force
Cytochrome C reduction by Cytochrome C Reductase ( complex III )
involves a unique mechanism known as the Q cycle
the Q cycle moves 4 H⁺ ions into the intermembrane space and transfers 2 electrons to reduce 2 cytochrome c molecules , while regenerating ubiquinol.
Ubiquinol (QH₂) Oxidation: One QH₂ molecule donates two electrons. One electron reduces cytochrome c, while the other is transferred to cytochrome b, where it reduces ubiquinone (Q) to semiquinone (Q•⁻).
Proton Release: During QH₂ oxidation, 2 H⁺ ions are released into the intermembrane space.
Second Ubiquinol Reaction: A second QH₂ molecule repeats the process, with one electron reducing another cytochrome c and the other fully reducing semiquinone to regenerate QH₂ at the Qi site.
Proton Release Again: Another 2 H⁺ ions are released, contributing to the proton gradient.
O Reduction to H₂O by Cytochrome C Oxidase (Complex IV) :
Electron Transfer from Cytochrome c:
Two cytochrome c molecules donate one electron each to Complex IV via CuA and heme a.
These electrons are transferred to the heme a₃-CuB center, where atomic oxygen (O) binds.
O Binding:
One atomic oxygen (O) binds to the heme a₃-CuB catalytic site in Complex IV.
Electron and Proton Transfers:
The two electrons from cytochrome c begin reducing the atomic oxygen (O).
Two protons from the mitochondrial matrix are used to form hydroxyl intermediates (OH⁻) at the active site.
Water Formation:
To fully reduce the hydroxyl intermediates (OH⁻) to water (H₂O), two additional protons from the mitochondrial matrix are used.
As a result, one water molecule (H₂O) is formed and released into the mitochondrial matrix.
Proton Pumping:
During the reduction of one oxygen atom, two protons from the mitochondrial matrix are pumped into the intermembrane space, contributing to the proton gradient.
Total ATP from "substrate level phosphorylation" in glycolysis :
Total ATP from "substrate level phosphorylation" in TCA Cycle :
Total NADH from 1 Glucose :
2 from Glycolysis directly
2 from converting the 2 Pyruvate into Acetyl-CoA
6 from running the 2 Acetyl-CoA through TCA
Total = 10
Total FADH2 from 1 Glucose :
2 from running the 2 Acetyl-CoA through TCA
Total = 2
Total ATP from NADH and FADH2 generated by previous glycolysis and TCA :
Combined Total ATP from 1 Glucose :
Coupling :
Glycolysis , TCA , and ETC are all synchronized by the demand for ATP
If ATP demand is high , glycolysis produces more NADH , which feeds electrons into the ETC to maintain the proton gradient and ATP production.
Conversely , if ATP demand is low , the ETC slows down , which reduces the oxidation of NADH , and in turn , slows glycolysis and other metabolic pathways.
Glycolysis produces NADH by oxidizing glucose to pyruvate.
this NADH must be reoxidized back to NAD⁺ for glycolysis to continue producing ATP.
The ETC is responsible for reoxidizing NADH ( and FADH₂ )
this reoxidation of NADH to NAD⁺ allows glycolysis to continue operating.
ATP Synthase Dimerization :
ATP synthase can dimerize on the inner mitochondrial membrane
These dimers help to stabilize the curvature of the cristae ( the folds of the inner membrane ) , enhancing the efficiency of proton flow through the enzyme.
This structural organization can lead to the formation of proton "funnels" that allow more effective use of the proton motive force for ATP production.
Dimerized ATP synthases can also increase the capacity for ATP production under conditions of high demand, such as in highly active cells.
By organizing into dimers , ATP synthases enhance the overall efficiency of chemiosmotic coupling, allowing for more ATP to be generated from the proton gradient created by the electron transport chain.
Inner Mitochrondrial Membrane Folds / Cristae :
Increase the Surface Area
concentrate the proton gradient
efficient spacial arrangement of enzymes
everything is right there in a pocket
Reactive Oxygen Species ( ROS ) :
Mitochondrial ROS, particularly superoxide (O₂⁻•), are produced by electron leakage from the electron transport chain (ETC), mainly at Complex I and Complex III.
Mode 1: High NADH/NAD⁺ ratio with low ATP demand causes superoxide production in Complex I. NADH accumulates, and fully reduced FMN reacts with oxygen, leading to superoxide formation.
Mode 2: High proton gradient and reduced CoQ pool (CoQH₂) can trigger reverse electron transport (RET), generating large amounts of superoxide. Common in ischemia/reperfusion injury.
ROS, particularly superoxide, can be converted to hydrogen peroxide (H₂O₂) by superoxide dismutase (SOD).
Hydrogen peroxide can react via the Fenton reaction to form highly reactive hydroxyl radicals (•OH), which can cause cellular damage.
Ubisemiquinone (CoQ•⁻), an unstable intermediate in Complex III, can contribute to ROS generation when it interacts with oxygen, forming superoxide.
ROS production increases in conditions of high mitochondrial membrane potential or low ATP consumption, slowing electron flow and promoting electron leakage.
Mitochondrial defenses, such as SOD, catalase, and glutathione peroxidase, neutralize superoxide and hydrogen peroxide to prevent excessive ROS buildup and oxidative stress.
Ubiquinol (CoQH₂) also has antioxidant properties, helping neutralize ROS under normal physiological conditions.
Metabolic Inhibitors :
Rotenone: Inhibits electron flow at Complex I, increasing ROS production and halting ATP synthesis.
Cyanide and Carbon Monoxide: Inhibit Complex IV, preventing oxygen reduction and halting ATP production.
Oligomycin: Inhibits ATP synthase, blocking ATP production by preventing proton flow through the enzyme.
Lipids
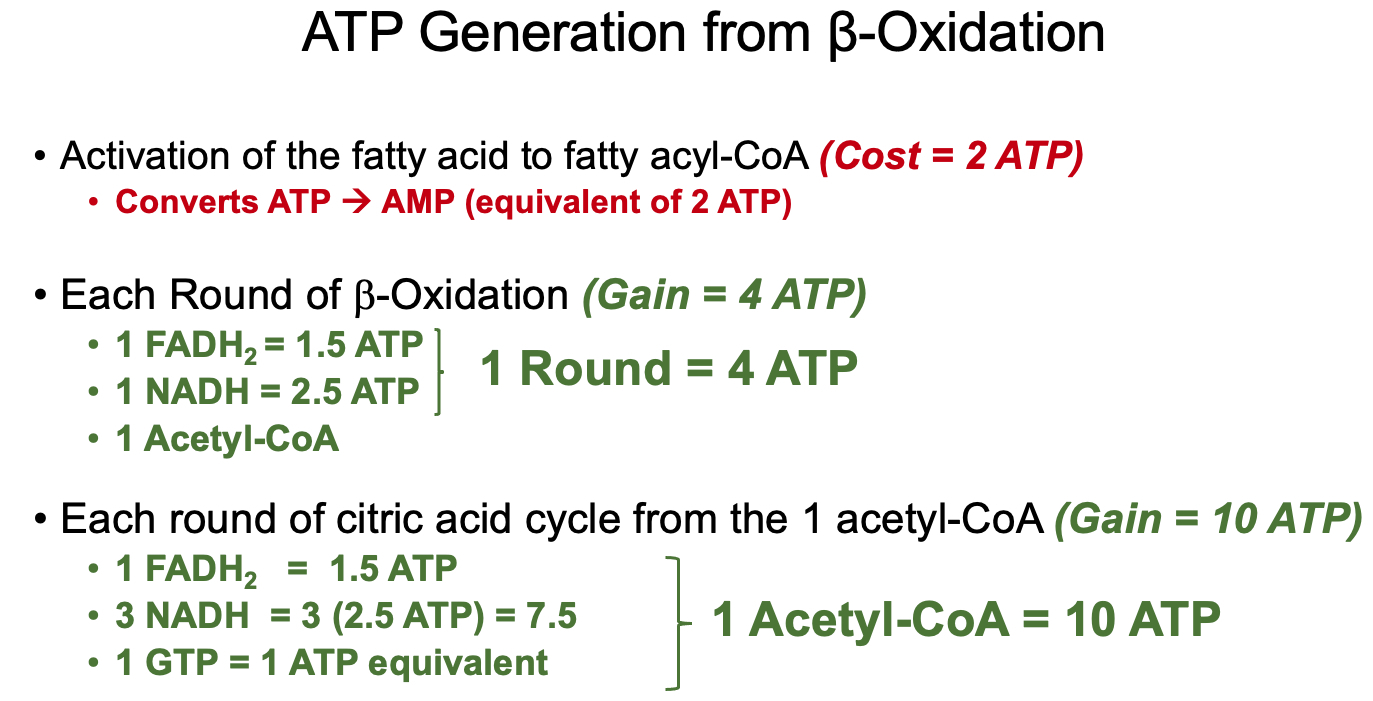
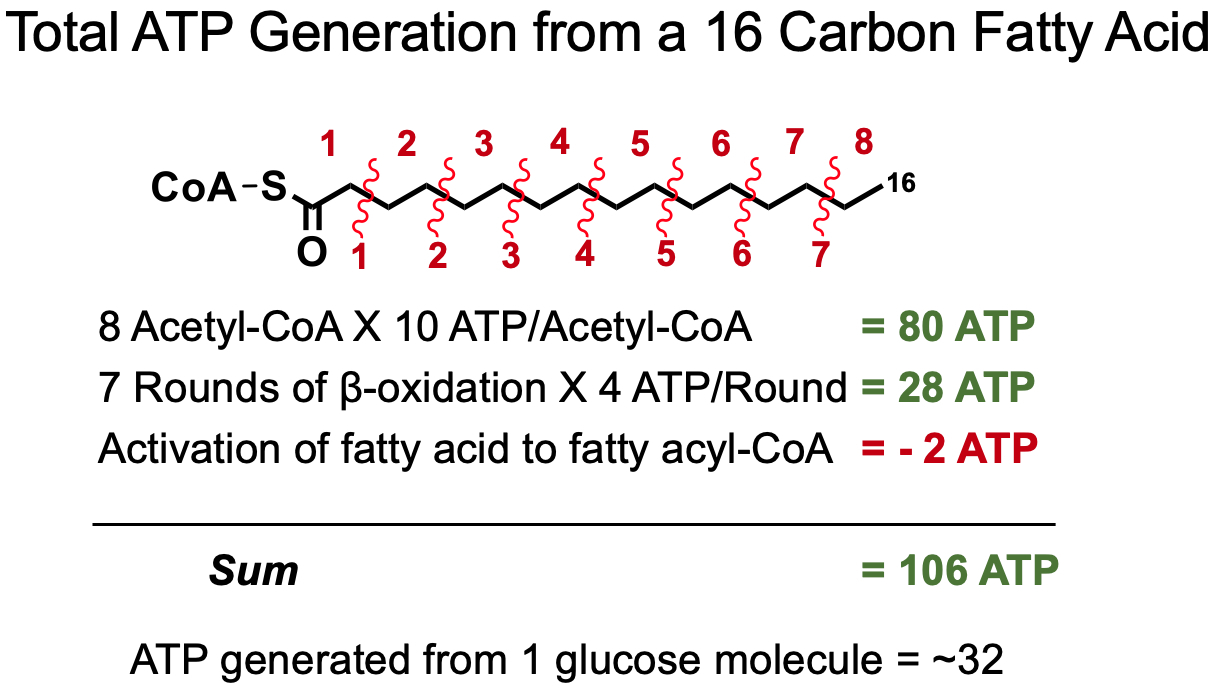
1.) Fatty Acyl-CoA Synthesis ( activation ) :
investment / activation cost = 2 ATP equivalents
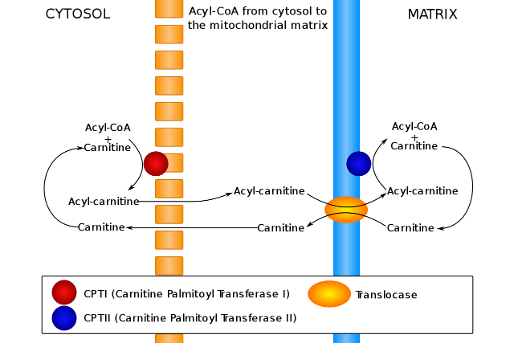
2.) Carnitine - Transport into Mitochondria :
Conjugate with Carnitine
CPT1 is an integral membrane protein found in the outer membrane of mitochondria
CPT1 is the rate-limiting enzyme of β-oxidation and is inhibited by malonyl-CoA
Acyl-Carnitine enters mitochondrial matrix using carnitine-acylcarnitine translocase ( CACT )
Acyl-Carnitine is converted back into Fatty Acyl-CoA
Carnitine recycles back to cytosol
3.) β-Oxidation :
Oxidation – Formation of a double bond in acyl-CoA dehydrogenase step.
Hydration – Addition of water across the double bond in enoyl-CoA hydratase step.
Oxidation – Conversion of hydroxyl to a keto group in L-3-hydroxyacyl-CoA dehydrogenase step.
Thiolysis – Cleavage of the carbon-carbon bond by β-ketothiolase, producing acetyl-CoA and a shortened acyl-CoA.
Net :
Total Acytl-CoA for Even Numbered Fatty Acid :
Total Rounds of β-Oxidation for Even Numbered Fatty Acid :
For Unsaturated Fatty Acids :
once it reaches the double bond , it has to be isomerized
this costs
therefore , unsaturated fatty acids yield less ATP than saturated
3 Fates of Fatty Acids in Enterocytes :
Reformed into TAGS , packaged into chylomicrons , shipped out
Act as transcription factors
Beta Oxidation
Lipid Transfer in Muscle Cells :
Absorption Option 1 :
Chylomicrons in the bloodstream are broken down by lipoprotein lipase ( LPL ) into FFAs
FFAs enter muscle cells directly via CD36 receptor
Absorption Option 2 :
VLDL in the bloodstream are broken down by LPL into FFAs
FFAs enter muscle cells directly via CD36 receptor
Once Inside :
FFAs enter nucleus and bind to PPARδ
1.1 PPARδ dimerizes with RXR
1.2 PPARδ genes are transcribed ( example = PDK4 )
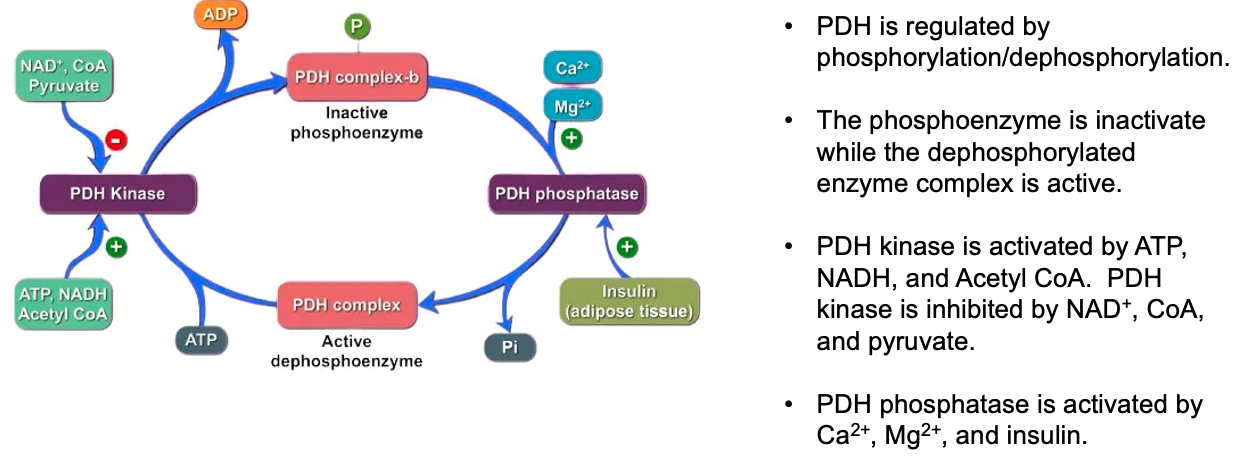
Pyruvate dehydrogenase kinase 4 ( PDK4 ) phosphorylates pyruvate dehydrogenase
decreases glycolysis
increases fatty acid oxidation
Triglyceride Synthesis :
Prep :
Glucose enters adipocytes via GLUT-4 ( insulin-dependent )
Dihydroxyacetone phosphate is converted into glycerol-3-phosphate via glycerol-3-phosphate dehydrogenase
TAG Generation :
Rate Limiting Enzyme = step 1 = conversion of glycerol-3-phosphate to 1-acylglycerol-3-phosphate
How can intermediates impact other cell functions ?
1,2-Diacylglycerol ( DAG ) is an important second messenger ( like cAMP ) that is involved in protein kinase C ( PKC ) signaling
Insulin Resistance and Impact of Plasma FFAs and Glucose on Cardiomyocytes :
Insulin Resistance:
Type 1: Genetic, no insulin production.
Type 2: Poor diet leads to insulin desensitization and reduced insulin production by beta cells.
Plasma Free Fatty Acids (FFAs) and Glucose in Cardiomyocytes:
Decreased insulin signals adipocytes to break down fats, increasing FFAs.
High FFAs disrupt insulin signaling, especially in muscle and heart cells.
Mechanism 1:
Increased FFAs boost beta-oxidation, raising NADH and acetyl-CoA.
Excess NADH and acetyl-CoA inhibit glucose metabolism, reducing glucose uptake.
Mechanism 2:
FFAs increase fatty acid metabolites, activating PKC.
PKC phosphorylates IRS-1/2, impairing insulin signaling and glucose transport.
Diabetic Cardiomyopathy (DCM):
Abnormal heart function linked to insulin resistance, ROS, and metabolic disruptions.
FFAs and high glucose levels cause oxidative stress and alter energy metabolism in heart cells, leading to damage.
Describe the lipid bilayer and how it varies between cells and organelles:
The lipid bilayer is a fundamental component of cellular membranes, composed of two layers of phospholipids. Each phospholipid molecule has a hydrophilic (water-attracting) head and hydrophobic (water-repelling) tails. These properties drive the bilayer to form, with hydrophobic tails facing inward and hydrophilic heads facing outward toward the aqueous environments inside and outside the cell.
Variations in the lipid bilayer between different cells and organelles arise from differences in the types of lipids present. For example, liver cells have a high concentration of cholesterol to help maintain membrane fluidity, while red blood cells have lipids that help them withstand the mechanical stress they encounter in circulation. Organelle membranes, like the endoplasmic reticulum or mitochondria, also differ in lipid composition to suit their specific functions
What is a lipid raft and why might they not exist?:
Lipid rafts are specialized microdomains within the plasma membrane that are rich in cholesterol and sphingolipids. These rafts are thought to serve as platforms for organizing signaling molecules, influencing membrane fluidity, and assisting in protein trafficking.
However, the existence of lipid rafts is debated because they are difficult to observe directly. Some argue that these rafts might not exist as stable structures but could instead be transient assemblies that form and disassemble quickly. The fluid nature of the lipid bilayer and the challenges in isolating these domains experimentally contribute to the skepticism about their existence
How can proteins insert into the lipid bilayer?:
Proteins can insert into the lipid bilayer through several mechanisms. Some are synthesized with hydrophobic regions that anchor them into the membrane, known as integral membrane proteins. Others attach to the bilayer by interacting with lipid molecules or by covalent attachment to lipids (lipid-anchored proteins). Transmembrane proteins span the bilayer, while peripheral proteins associate loosely with the membrane surface via interactions with integral proteins or the lipid head groups
Why do cell membranes have mechanisms to restrict or allow protein movement?:
Membranes regulate protein movement to maintain functional organization and facilitate processes such as signal transduction, cell communication, and transport. For example, restricting movement can keep proteins in specific regions of the membrane (like ion channels at synapses). Allowing movement, on the other hand, enables proteins to diffuse and participate in dynamic processes, such as signaling cascades, that require interactions with other membrane components. Mechanisms like cytoskeletal attachments and membrane microdomains (e.g., lipid rafts) play roles in these regulatory processes
Membrane Potential
Inside of cell = high potassium
Outside of cell = high sodium
2 Force Gradients :
electrical
chemical = mass = concentration
Lipid bilayer = insulator , separates 2 conductors. extracellular and intracellular
Asymmetries of ion concentration across lipid bilayer = voltage = membrane potential
Nernst Equation :
calculates membrane potential
The Nernst potential is the voltage that would exist if the membrane were only permeable to one ion
Electrochemical Equation :
accounts for how an ion behaves under the actual membrane potential , which is influenced by all ions and the currents across the membrane.
So how to find the actual membrane potential
its a "weighted average" of all the membrane potentials
It uses the "permeability" of some ion channel , aka its "conductance"
higher permeability = higher rate of ions traveling into or out of cell
So total averaged membrane potential over all the different types of ion channels in the membrane
This gives the true "resting membrane potential"
The Driving Force :
an ion will move down its electrochemical gradient
it wants to move , in or out of the cell , in such a way that the entire membrane potential
remember , sodium , if left to itself , balances out at
potassium , if left to itself ,
ok , so if we take a snapshot of the current membrane potential ,
and lets say the total
for sodium , it would love the cell to be at
so its goin to rush in , to try and bring
but for potassium , it wants the cell to be at
so its going to want to leave the cell , to make the membrane more negative , and closer to
Liddle's Syndrome :
hypokalemic ➡️ hyperpolarized cells ➡️ reduced firing rate ➡️ arrhythmia , seizures , muscle spasms
Cholera :
Vibrio cholare produces cholera toxin ➡️ stimulates adenylate cyclase ➡️ increased cAMP ➡️ blocks sodium and chloride transporters ➡️ high concentration of osmoles outside cells , in the gut ➡️ water dumps into gut ➡️ diarrhea ➡️ dehydration
Treatment = high sodium and glucose. The sodium-glucose co-transport system is not affected by cholera toxin. Water follows back into the cells
Small and lipophilic molecules
Everything else needs help
transporters and ion channels
3 Major Classes of Transmembrane Proteins :
receptors , ion channels , transport proteins ( ion transporters / carrier mediated transport )
S4 segment :
a conserved transmembrane region
consists of a series of positively charged amino acid residues that form a spiral of charges traversing the membrane.
It is likely that these S4 segments serve as voltage sensors.
That is, the positive charges “feel” the membrane potential , and move in response to changes in the membrane potential ,
such that channels activate following a depolarization.
Acetylcholine Receptors ( AChR ) :
hetropentamero
each of the five subunits winds through the plasma membrane 4 times
AChRs are kinked in the middle
when 2 ACTH bind between the residues , the kinks twist in opposite directions around each other
this forms a larger whole , opening the channel
Aquaporin:
Aquaporins are specialized water channels with both hydrophilic and hydrophobic regions.
Hydrophilic residues in the channel align H₂O molecules in a single file, allowing them to pass.
Hydrophobic regions repel ions, including H₃O⁺, ensuring only water passes through.
Asparagine residues in the central part of the channel disrupt proton transfer (Grotthuss mechanism), preventing H₃O⁺ from entering.
Potassium Channel:
Potassium channels have both hydrophilic and hydrophobic regions that create a selective environment for K⁺ ions.
The selectivity filter has binding sites optimized for K⁺, allowing it to interact with carbonyl groups in the filter.
Although Na⁺ is smaller, it cannot interact properly with the filter, making its passage energetically unfavorable.
This combination ensures only K⁺ is allowed through, maintaining ionic balance.
Cell Communication - Receptors
What are the four main receptor subtypes organized fastest to slowest?
Ligand-Gated Ion Channels ( ionotropic ) : Fastest response time ( milliseconds ); involved in rapid synaptic signaling.
G-Protein Coupled Receptors ( GPCRs ) ( metabotropic ) : Slower than ion channels ( seconds ); activate intracellular signaling pathways.
Enzyme-Coupled Receptors: Slower response ( minutes ); often involve kinase activity leading to phosphorylation cascades.
Nuclear / Intracellular Receptors: Slowest response ( minutes to hours ); typically involve changes in gene expression by interacting with DNA.
What do we mean by affinity and efficacy?
Affinity: The ability of a drug to bind to its receptor. High-affinity drugs bind effectively at lower concentrations.
Efficacy: The ability of a drug-receptor complex to produce a physiological response. A drug can have high affinity but low efficacy.
The dissociation constant
determined, representing the concentration at which 50% of receptors are occupied.
Left shift on velocity vs concentration curve = more affinity
Right shift on velocity vs concentration curve = less affinity
Let some binding event / reaction of Agonist ( A ) and Receptor ( R ) :
Agonists: binds to a receptor = produces a response
Example = fentanyl
Antagonists: binds to the same receptor = doesn't produce a response
Example = narcan
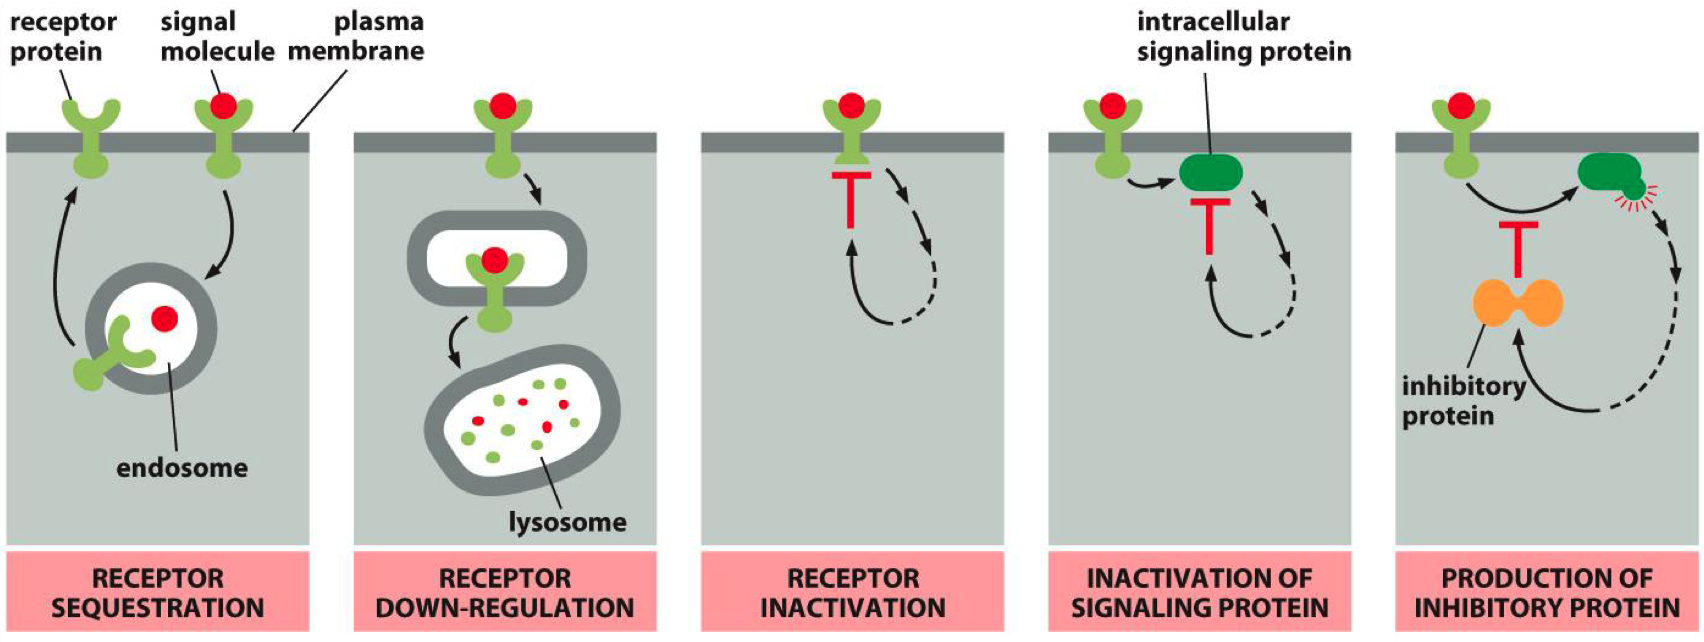
Mechanisms that can inactivate a receptor :
Receptor Sequestration: Receptors are internalized and temporarily unavailable.
Receptor Down-Regulation: Receptors are degraded, reducing their numbers on the cell surface.
Receptor Inactivation: Receptors are modified to become less responsive.
Inactivation of Signaling Protein: Some third party protein inactivates a secondary messenger protein
Inhibitory Protein Production: Signaling pathways produce proteins that inhibit receptor activity.
Tolerance and Opioid Addiction Progression
Normal State:
Baseline: Receptor activity is regulated by endogenous ligands (e.g., endorphins). Receptor numbers are stable.
Euphoria (Initial drug use):
Increased ligand (opioid) concentration overstimulates opioid receptors, producing euphoria. No tolerance yet.
Tolerance:
With repeated opioid use, receptor downregulation occurs. More ligand (drug) is required to achieve the same effect due to fewer receptors available.
Dependence:
The body adapts to high ligand levels, becoming dependent on external opioids. Endogenous ligands no longer maintain normal function, leading to withdrawal symptoms if opioids are stopped.
Post-Abstinence Risk
Normal After Abstinence:
After stopping the drug, receptor upregulation restores receptor levels to baseline, but endogenous ligand production is still low.
Withdrawal:
Without external ligand (opioid), receptors are understimulated, causing withdrawal symptoms due to insufficient receptor activation.
Recovery:
Over time, the body’s endogenous ligands regain normal function, and receptor activity stabilizes.
Overdose (High Risk):
If opioid use resumes at prior doses, the upregulated receptors are overstimulated by the same ligand concentration, leading to overdose.
Cell Communication - Control of Cell and System Functions
Steroid Family 1: Includes common steroids like glucocorticoids, androgens, estrogens, progesterones, and mineralocorticoids.
These receptors are cytosolic,
Upon ligand binding, the receptor forms a homodimer and translocates into the nucleus, initiating gene transcription.
steroid crosses cell membrane
steroid binds to receptor / heat shock protein complex
heat shock proteins dissociate , receptor is activated
receptor moves into nucleus
receptro binds to DNA as a dimer
receptor alters gene transcription , mRNA is made
target protein is made , elicits biological response
Steroid Family 2: Includes T3, retinoid acid, RXR, and vitamin D receptors.
These receptors are nuclear
After ligand binding, they form a heterodimer (often with RXR) before binding to DNA and initiating gene transcription.
steroid crosses cell membrane
steroid moves into nucleus
steroid binds receptor , activates receptor ( heterodimer )
receptor binds to DNA as heterodimer
receptor alters gene transcription
target protein is made , elicits biological response
Steroid Receptors Contain :
Zinc finger motifs in the DNA-binding domain.
These are essential for binding to hormone response elements (HREs) on the DNA.
HRE = nucleotide sequence unique to zinc-finger
regulate the rate of transcription
zink is used as the coordinating ion
Receptor Tyrosine Kinase Activation :
Binding of ligand causes dimerization
dimerized receptor phosphorylates tyrosine
either auto-phosphorylation or cross-phosphorylation
phosphorylated receptor recruits and activates adapter proteins
kinase cascade
MAP kinases are one of the most common pathways involved in kinase signaling, especially in regulating the cell cycle.
MAP kinases activate CDKs (Cyclin-Dependent Kinases), which in turn regulate cyclins. These cyclins phosphorylate key proteins like RB (Retinoblastoma protein), which regulates whether the cell can progress through the cell cycle. Phosphorylated RB allows progression, driving the cell from G1 into S phase.
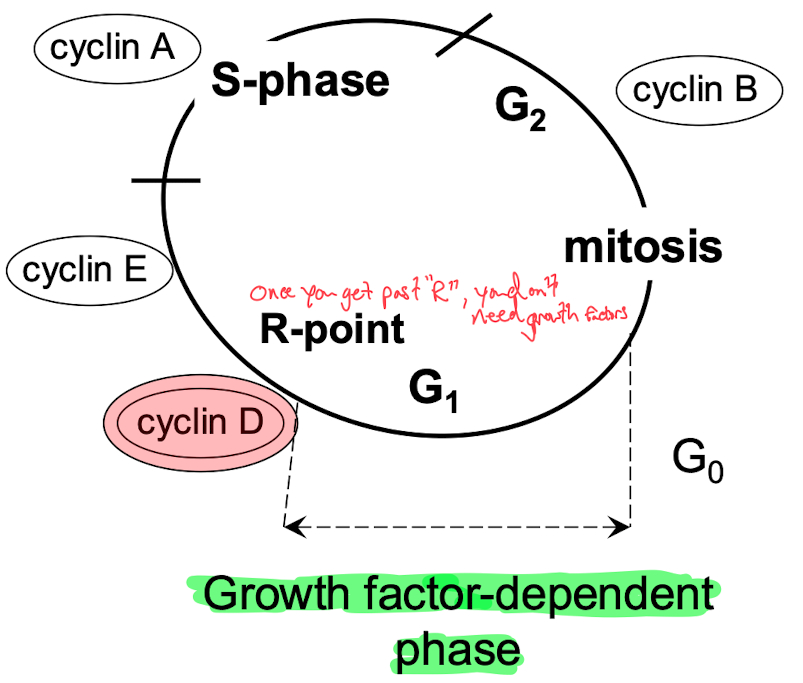
CDKs and Cyclins Act on the Cell Cycle :
They control cell cycle checkpoints, ensuring proper cell cycle progression.
Misregulation (e.g., through oncogene mutations like KRAS or loss of tumor suppressors like RB) can lead to uncontrolled cell proliferation, a hallmark of cancer.
Growth Factor ➡️ MAP Kinase ➡️
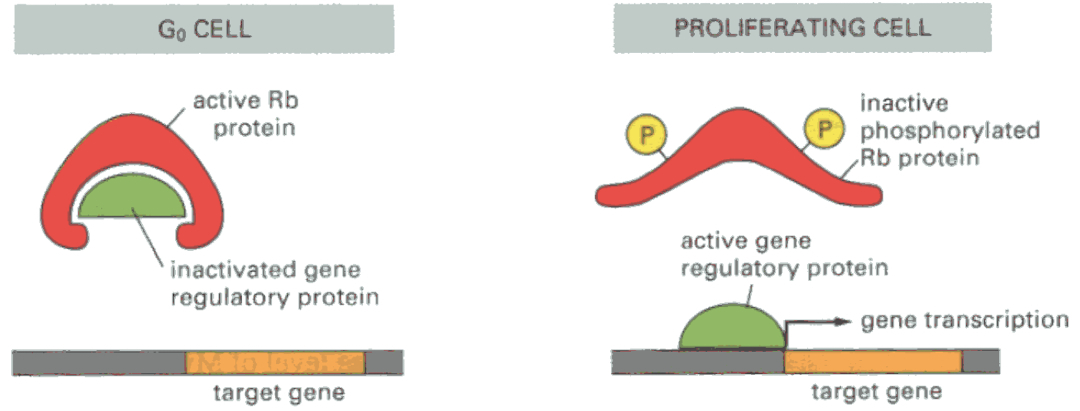
Rb = prevents cell cycle progression via inhibition of gene transcription :
blocks expression of myc and fos
binds to E2F ( needed to go past R-site )
Phosphorylated Rb allows transition from G1 to S-phase