Eye-Specific Segregation Requires Neural Activity in Three-Eyed Rana Pipiens
10.1523/JNEUROSCI.05-05-01132.1985
Abstract
The addition of a third eye primordium to the forebrain region of a Rana pipiens embryo invariably results in the development of a series of periodic, mutually exclusive eye-specific bands in tectal lobes dually innervated by the host and supernumerary fibers. A number of investigators have proposed that such source-specific segregation arises as a compromise between two mechanisms that are normally involved in retinotectal map formation: one which is dependent on cell surface affinities to align the map and produce a rough retinotopy and a second that “fine tunes” the map by stabilizing adjacent terminals from neighboring retinal ganglion cell bodies at the expense of terminals from non-neighboring cells. In this study we have tested the idea that this second “fine-tuning” mechanism is dependent on neural activity by blocking impulse activity in the optic nerves of three-eyed tadpoles.
To assess the requirement for activity on the formation of bands, both normal optic nerves of 17 three-eyed tadpoles were crushed intraorbitally. Two weeks after this operation, the supernumerary retinal projection had debanded and spread to cover the entire tectum in a continuous fashion. By 4 weeks, however, the host optic fibers regenerated back to the tecta and began to form segregated stripes with the fibers from the third eye. Six to 7 weeks after the optic nerve crush the periodic pattern of eye-specific segregation characteristic of dually innervated tecta was again pronounced. When activity in all three optic nerves was eliminated with tetrodotoxin (TTX; embedded in a slow release plastic) during the last 3 weeks of this process, the fibers from the two competing eyes failed to segregate and, instead, formed two completely overlapping, continuous projections across the tectal surface.
To test for the requirement of activity in the maintenance of segregation, we also subjected three-eyed tadpoles without optic nerve crush to TTX blockade for 2, 3, and 4 weeks. Animals sacrificed at 2 weeks show overlap of the projections in the rostral tectum but distinct interdigitating stripes in other regions of these lobes. After 3 weeks of blockade, segregation of the projections was less distinct in the central tectum as well. After 4 weeks of TTX blockade the terminals from both eyes spread to form continuous overlapping projections throughout the tectum. Examination of well isolated, individual retinal ganglion cell terminal arbors during this period reveals that they occupy a significantly greater area of tectum following the TTX treatment.
These results indicate that Nat-dependent action potentials in the optic nerves of three-eyed tadpoles are necessary for the formation and maintenance of eye-specific segregation in dually innervated tecta. They are also consistent with the hypothesis that the competitive fiber interactions that "fine tune" the normal pattern of retinotectal connections are mediated by the pattern of impulses in the optic nerve.
Intro
The segregation of afferent fiber projections from two or more sources into patches, columns, or bands occurs widely in the vertebrate central nervous system. The mechanisms which mediate this segregation are not yet understood; however, several investigators have proposed that segregation might be linked to the normal process of topographic map formation. In this view, when two similarly aligned, topographically organized projections attempt to innervate the same population of postsynaptic cells, one mechanism spreads the fibers throughout the entire postsynaptic structure, while a second mechanism tends to group together those fibers from the same source. The division of the neuropil into interdigitating zones of sourcespecific termination optimizes both of these processes This hypothesis has received some experimental support from the retinotectal system of cold-blooded vertebrates. In normal frogs, the projection of retinal ganglion cell (RGC) axons to their terminal sites in the superficial neuropil of the optic tectum is organized as a continuous map of the retinal surface. However, when two eyes are forced to innervate a single tectum, either by the embryonic transplant of an additional eye primordium, or by the surgical removal of one tectum in a normal frog or tadpole, the terminals from the two eyes divide the tectal neuropil into a series of alternating, mutually exclusive, eye-specific bands. Surgical deflection of optic tibers to the ipsilateral tectum in goldfish have yielded a similar pattern of eye-specific segregation.
Thus, although such segregation is not present in the normal retinotectal projection, it can be experimentally induced when two eyes are forced to compete for the same postsynaptic cells. Therefore, it is likely that the mechanisms that are responsible for segregation are the same as those that operate to ensure an appropriately organized retinotopic map in normal animals. We have proposed that the mechanism that spreads the fibers across the tectum is mediated by regionally varying adhesive interactions that align and grossly match appropriate regions of the retina and the optic tectum , whereas the second mechanism, which groups fibers from the same source, is mediated by competitive interactions that stabilize adjacent terminals from neighboring RGC bodies at the expense of terminals from nonneighboring cells. In this model, the second mechanism would normally act to "fine-tune" the retinotectal projection to its characteristic high degree of retinotopy, whereas in the three-eyed animal it would cause the axons from the same retina to terminate together.
Several possible origins of this eye-specific information have been examined in prior publications. Intrinsic differences in laterality have been shown to be uninvolved, since segregation will occur between two eyes of the same original laterality in three-eyed frogs. Histocompatibility differences between donor and host have been ruled out by the fact that the two eyes of a normal frog or goldfish can be made to segregate when forced to innervate a single tectum. Selective fasciculation of fibers in the optic tract is also unlikely to provide source-specific information since the terminals that comprise one band have been shown to travel to the tectum in numerous different age-related bundles. Furthermore, experiments using compound eyes, formed by fusing embryonic retinal fragments or by inducing mirror-symmetric duplication of eye primordia by partial ablation, have demonstrated that ganglion cell arbors from the two half-eyes will segregate in the tectum. This indicates that axon terminals from cells of a single continuous presynaptic sheet will segregate in the tectal neuropil, depending only on differences in the position of the ganglion cell somas.
In this report we have tested the hypothesis that Na*-dependent action potentials in the optic nerves provide the information that RGC terminals arise from neighboring retinal cells and thereby cause terminals from different eyes of a three-eyed frog to segregate into eye-specific stripes.
Materials and Methods
Animals. The animals used in this study were laboratory-reared Northern leopard frogs, Rana pipiens. Adult breeders (J. M. Hazen & Co., Alburg, VT) were ovulated and the eggs were fertilized artificially. Three-eyed animals were produced by transplanting an eye primordium from a Shumway stage 17 to 19 embryo (Shumway, 1940) into the forebrain region of a sibling at the same stage. Further details of the operation and the animal rearing procedures have been published previously (Law and Constantine-Paton, 1981). Animals were kept in a constant 23°C environment with a 12-hr light/ dark cycle throughout their rearing and the experiments described in this study. Elvax-40P. In order to ensure a sustained release of tetrodotoxin (1X) over a relatively long period, we suspended the material in a slow release plastic, ELVAX-40P (a gift from DuPont Co., Wilmington, DE), using the method described by Silberstein and Daniel (1982). The rate of release of fluorescein, a substance close in molecular weight to TTX, was determined using absorbance measures at 460 nm from a Beckman spectrophotometer. With daily changes of solution, we found that an initial rapid release of fluorescein was followed by a slow decline of from 10-8 mol/hr to 10-" mol/ hr over the next 40 days. This rate of release is consistent with the protracted time course of release found when other materials have been embedded in Elvax (Langer and Folkman, 1976; Rhine et al., 1980; Silberstein and Daniel, 1982). Since TTX is effective at concentrations as low as 10-* M and we estimated the intraocular fluid to be between 50 and 100 ul, we reasoned that a release rate of 10-" mol/hr would still be sufficient to effectively block RGC action potentials. Therefore, TTX (Sigma Chemical Co., St. Louis, MO) was suspended in the Elvax in the same manner as for fluorescein (1 mg/gm of Elvax), and its rate of efflux was presumed to be similar. The Elvax pellets containing the TTX (TTX-Elvax) were used in two ways in our experiments. In one series of animals small pellets, approximately 1 mg, were placed in the posterior eye chamber through an incision made in the cornea. The eyes were then sealed with Histoacryl tissue glue and they subsequently healed with the Elvax pellet inside. In another group of tadpoles, the optic nerves were exposed and threads of Elvax, which had been stretched from small pellets, were tied around the nerves. Again the incision was sealed with tissue glue and the Elvax cuffs usually stayed in place for several weeks postoperatively. Immediately after the implant of TTX-Elvax, the tadpoles were usually completely paralyzed, and it was found necessary to oxygenate their water continuously for the first 2 or 3 days. After this the water was oxygenated approximately 12 hr/day in both control and experimental animals. Optokinetic response. To assess the effectiveness of the TX-containing Elvax in blocking the retinotectal impulse transmission, both behavioral and electrophysiological techniques were employed. For the behavioral test we examined the optokinetic response (OKR) in the tadpoles prior to and following the insertion of the Elvax. The OKR can be elicited very reliably in normal tadpoles by placing them in a small dish under a slowly rotating plastic dome that has been marked with an alternating pattern of light and dark vertical stripes. When this dome is rotated in either the clockwise or counterclockwise direction, a highly stereotyped response is evoked. As the rotation of the dome begins, the animal's tail flexes in a direction opposite site to that in which the stimulus pattern is turning. Soon after, the tadpole begins to swim in a circular manner, with the direction and speed of the rotating dome. The OKR was tested in TTX-treated tadpoles on alternate days during their 1 - to 4-week survival. Electrophysiological recording. Tadpoles to be used for physiological recording were anesthetized with methanesulfonic acid (MS-222) and both optic tecta were exposed; the animals were then paralyzed with succinylcholine and all wound surfaces were treated with lidocaine. In addition, a small cannula was cemented into the mouth and oxygenated charcoal-filtered water was continuously pertused through the gills via a peristaltic pump. Electrical activity was recorded using tungsten in glass microelectrodes, amplified via a Grass extracellular amplitier and further procesed with a Computerscope digital oscilloscope (R. C. Electronics, Inc., Santa Barbara, CA). Stimuli for the field potential analysis were delivered with a Grass strobe stimulator. Since the animals frequently did not survive the recording sessions, the three-eyed tadpoles were not examined in this way. instead, a group (10) of normal tadpoles at midlarval stages (Taylor and Kollros, 1946; T&K stages XII to XVIII) received unilateral intraocular pellets or nerve cuffs of TTXcontaining Elvax and were examined for the effectiveness of the implants at weekly intervals. Figure 1 shows the averaged response of 40 flashes to the normal and poisoned eyes as recorded in the superficial tectal neuropil 3 weeks after a TTX-Elvax cuff was placed on the animal's left optic nerve. Even aiter 3 weeks the TTX is being released at a high enough concentration to poison the optic nerve. Moreover, no single- or multiple-unit activity could be evoked from the TTX-poisoned retinas of any of these animals using a variety of visual stimuli. From these recording sessions we determined that the Elvax was releasing TX at effective concentrations to block ali activity in the optic nerves for at least 3 weeks. However, removal of the cuffs in two animals after 1 week resulted in the recovery of visual responsiveness within 24 hr. Histochemistry and autoradiography. To label both of the projections to the dually innervated tecta of three-eyed tadpoles we used the doublelabeling technique described in an earlier publication (Constantine-Paton et al., 1983). Briefly, [®H]proline (10 to 15 Ci) was injected into the two normal eyes while a small recrystallized pellet of horseradish peroxidase (HRP; Sigma) was placed on the cut end of the third nerve. The tadpoles were allowed to survive for 1 to 2 days for adequate transport of the labels, and the brains were reacted as whole mounts following a modification of the procedures of Fugisawa et al. (1981) as described in Reh et al. (1983). The brains were then photographed, fixed in Bouin's solution, dehydrated, and embedded in paraffin. Sections were cut at 10 um and processed with standard autoradiographic techniques so that both labels could be visualized in the same section. In those cases in which the ganglion cell terminals were to be traced, the third nerve was labeled with a small pellet of HRP that had been dried onto the tip of a pin. These brains were also reacted as whole mounts. They were then split at the rostral and caudal poles and dried flat onto a slide. After they had been cleared in xylene and coverslipped, well isolated terminals were drawn at x 1000 using a Leitz drawing tube.
Morphometry. The average RGC areas and numbers were determined for similarly staged normal and chronically poisoned tadpoles from 10-um paraffin sections through the dorsoventral axis of their retinas following fixation in Bouin's solution. For the cell numbers, all large, clear nuclei in the ganglion cell layer were counted in every 10th section through the retinas. This sampling method has been shown to provide an accurate estimate of total RGC numbers and is described in more detail in a previous publication (Reh and Constantine-Paton, 1983). Cross-sectional areas of cells in the ganglion cell layer were measured from toluidine biue-stained sections by projecting the retinas directly with a Leitz Dialux 20 microscope and drawing tube onto a Summagraphics bit pad interfaced with a Terak 8510 microcomputer. Approximately 200 cells/retina were measured. The areas of RGC terminals from their first branch points were measured using this same system, by first drawing the entire terminal arborization and then measuring the envelope of the arbor with the bit pad (Constantine-Paton et al., 1983).
Results
Retinotectal projection in normal and three-eyed tadpoles. When HRP pellets are placed on the cut optic nerves of normal tadpoles, the entire projection is labeled. The normal retinotectal projection is completely crossed and forms a continuous dense network of axonal arborizations throughout the superficial tectal neuropil (layers 7 to 9). However, in all tadpoles the projection fails to cover a small region of the caudomedial tectum where cell division and differentiation are still occurring (Currie and Cowan, 1974; Reh and Constantine-Paton, 1983) In the three-eyed tadpoles there is a striking difference when the projection from the third eye is labeled with HRP and the brain is reacted as a whole mount (Constantine-Paton and Law, 1978; Constantine-Paton, 1982). The projections of both the host and the supernumerary optic nerves in a dually innervated tectum are divided into a series of regular alternating bands (e.g., Figs. 2e, 3, b and d, and 4a). The fact that the third eye bands interdigitate with the host eye projection has been shown in previous publications (Law and Constantine-Paton, 1981; Law, 1982), in which the host retinal projection has been labeled with [?]proline and the third eye has been labeled with HRP. Several features of these dual projections are noteworthy in their similarity to the normal tadpole: (1) as Figure 6a, shows, the retinotectal terminals in dually innervated tecta still terminate through the full depth of the superficial neuropil; (2) the projections of each eye cover approximately the same area of tectum, but as in the normal tadpole they never completely reach the most caudomedial region of the structure (see Fig. 4a); and (3) previous physiological investigations have demonstrated that both retinal projections are aligned according to the initial embryonic axes of the eye primordia (Law and Constantine-Paton, 1981). The third eye projection spreads following crush of the normal nerves. The initial segregation of optic fibers into eye-specific bands occurs very early during development; segregation is present at T&K stage IV, which is as early as we have been able to use the neuroanatomical tracing methods. Therefore, in order to study the effects of silencing optic nerve activity on the formation of eyespecific bands, the projection of the third nerve was allowed to spread over the tectum by crushing the normal optic nerves, and the process of resegregation was studied as the host nerve fibers regenerated to the tectum. A total of 30 three-eyed tadpoles at midlarval stages received bilateral optic nerve crushes, leaving the third nerve intact. Fourteen of these animals were used to examine the normal time course of debanding and rebanding using the double-labeling technique; in all cases the normal eyes were labeled with ['Hi|proline and the supernumerary nerve was labeled with HRP. Following crush of the optic nerves in these tadpoles, most of the severed axons and their tectal terminals degenerated within 1 week.
The time course of degeneration was determined by severing the optic nerve and using the anterograde transport of HRP to visualize the terminals over the next several days. After 2 days at 23°C, the terminals were well labeled and appeared structurally intact; however, by 3 days they showed definite signs of degeneration (e.g., beaded). By 4 days after the optic nerve was severed, the axons and terminals were hardly recognizable as such, and instead the label had a granular appearance indicating that the beaded axons and endings had fractionated. In the next few days this granular label becomes much less intense as the degenerated terminals are cleared from the tectum. This time course of degeneration is consistent with that observed in unlabeled optic fibers in larval Xenopus (Gaze et al., 1979; Ostberg and Norden, 1979) and therefore is unlikely to be due to necrotic effects of the HRP itself. With the degeneration of the host RGC terminals, the terminals of the third nerve soon began to spread into the interband region. Figure 2, a and b, shows the whole mounted brain of an animal after the supernumerary optic nerve was labeled with HRP. This tadpole received a bilateral crush of the host optic nerves 11 days earlier. Although one can still discern the regular striped pattern, the supernumerary projection has spread to the interband regions and the edges of the bands have become less distinct. By 15 days after the operation there is little evidence of the original banding; the fibers from the third eye cover the tectum in a fairly continuous fashion (Fig. 2c).
As the host optic nerves began to regenerate, the fibers entered the tectum and grew selectively into the superficial neuropil. Three weeks after the crush, autoradiography revealed that the regenerating axons had reached the tectum. At this time, however, there was still no evidence of segregation of the two projections; the HRP-filled terminals of the third nerve still projected continuously across the tectum. Four weeks after the bilateral host optic nerve crush, eyespecific bands began to form. This segregation can be seen both in the projection of the third nerve (Fig. 2d), labeied with HRP, and in the terminals of the regenerated host nerve, labeled with [H] proline. This segregation of the projections became more pronounced with time, and by 6 weeks after the optic nerve crush, the periodic banding pattern was indistinguishable from that of unoperated three-eyed tadpoles (see Fig. 4a). Figure 2e shows the whole mounted brain of a tadpole that sustained a bilateral crush of the host optic nerves 10 weeks earlier. it should be noted that the regular striped pattern seen in three-eyed tadpoles was often (although not always) much more patch-like following regeneration. We have earlier proposed that patches, rather than stripes, occur when the innervation density falls below a certain critical value (Law, 1982). This is entirely consistent with the appearance of patchy termination in regenerates, since it is likely that fewer than normal fibers reach the tectum. TX blocks resegregation following regeneration of the host optic nerves. Twelve three-eyed tadpoles (T&K XII-XVI) received bilateral host optic nerve crush and, 4 weeks later, after the normal optic fibers had regenerated to the tectum, had all three optic nerves poisoned with TTX-Elvax, applied either as intraocular pellets or as optic nerve cuffs. Four additional control animals received bilateral host optic nerve crushes; however, Elvax without TTX was used for the intraocular pellets and optic nerve cuffs. Of the five experimental animals that survived the 3-week TTX treatment, three were successfully processed for both [°H]proline autoradiography and HRP histochemistry, whereas one animal only had label in the supernumerary optic fibers. In two of the four control animals both the normal and third eyes were labeled, whereas in the other two, only the third nerve was labeled with HRP. The result of blocking activity in the optic nerves for 3 weeks, between the fourth and seventh weeks after the initial bilateral optic nerve crush, was consistent for all animals: segregation into eye-specific bands was prevented only in those cases in which the Elvax contained TTX.
Two examples of whole mounted brains from tadpoles treated with TTX are shown in Figure 3, a and c. The brains of two control animals are shown in Figure 3, b and d, for comparison. Although the Elvax alone does not disrupt band formation, segregation is prevented when the TTX is used to block the activity in the optic nerve. Since the host eyes were labeled with ['H]proline, it was possible to determine that the regeneration of the host optic nerves had not been slowed or prevented by the TTX. Although the autoradiographic process does not allow a quantitative measure of the number of regenerating fibers or their rate of growth, in all cases the autoradiographs showed that the host optic nerves had regenerated and overlapped in a continuous dense projection with the supernumerary eye. TX prevents maintenance of segregation. In another group of three-eyed tadpoles the optic nerves were poisoned without prior crush to study the effects of TTX on the maintenance of the banding pattern. Intraocular pellets or nerve cuffs of TTX-Elvax were implanted in a total of 29 midlarval stage three-eyed tadpoles. Evidence that the TTX was effective in silencing activity in the optic nerves of these animals was provided by testing the tadpoles for the presence of an optokinetic turning response, as described previously. When responses in either direction returned, or when a particular animal began to look sickly, the optic nerves were labeled with HRP or [°H] proline and the brains were reacted for these labels. Twelve animals survived the implants for varying lengths of time and were successfully processed for the labels; 3 tadpoles were poisoned for 2 weeks, 4 tadpoles were poisoned for 3 weeks, and 5 tadpoles were poisoned for 4 weeks. Over the 4-week period in which the activity in the optic nerves was eliminated, there was a progressive spreading of fibers from their eye-specific bands, into the interband regions. Figure 4b shows a whole mounted brain of a three-eyed tadpole in which the optic nerves had been continuously silenced by the TTX over a 2-week period. After 2 weeks of poisoning, the eye-specific bands are still clearly present in the central tectum; however, in the rostral tectum, the segregation is less distinct. When the brains of these animals were sectioned and processed for autoradiography, there was considerable overlap between the HRP-containing terminals and the ['H]proline-containing terminals in the sections of rostral tectum, but segregation between the two labels was still evident in more central tectal sections. After 3 weeks of silencing the optic nerves in three-eyed tadpoles, the changes in the normal segregated pattern became even more pronounced. It is still possible to distinguish band and interband regions of the dually innervated tectum, but the boundaries are much less distinct, and one can now see overlap between the host and third eye terminals throughout the tectum in the sectioned material. As in the 2-week cases, the overlap is still most pronounced in the peripheral tectum with some segregation still present in the central tectum. Four weeks after the three-eyed animals received TTX-Elvax implants, there was little evidence of eye-specific segregation of terminals. Figure 4, c and d, shows the whole mounted brains of two three-eyed tadpoles that had TTX-Elvax cuffs placed on all nerves for 4 weeks; the third nerve was labeled with HRP and the terminals of the host eye were labeled with intraocular injections of [Hiproline in each case. By this time, the terminals from the third eye no longer show eye-specific bands but spread evenly across the entire tectal surface. Likewise, the projection of the host eye also shows no banded pattern in the autoradiographs (see Fig. 6, b to e), as contrasted with the striking striped pattern seen in the autoradiographs of untreated or control three-eyed tadpoles (see Fig. 6a). In three control animals, Elvax pellets without TTX were implanted intraocularly, and after 4 weeks, examination of the projections of the three eyes (Fig. 4a) showed the normal pattern of segregation present in three-eyed tadpoles. In some cases, following reaction with diaminobenzidine, the optic tecta of the tadpoles were mounted flat on slides, fixed, and cleared Figure 5 shows micrographs of such tecta from three-eyed animals detailing the sequence of debanding with TTX treatment. In the cases shown in Figure 5, a to d, the three-eyed animals had all three eyes silenced with TX for progressively longer periods of time, with a correspondingly greater degree of debanding. After 3 weeks of TTX treatment (Fig. 5d), there is again little evidence of stripes. The higher power views in Figure 5, e and f, show an untreated animal (Fig. 5e) and a tadpole that had all three optic nerves blocked with TTX for 3 weeks (Fig. 5f). Although control three-eyed animals have a few tibers running between the stripes, the region of dense arborization is within the stripes (Fig. 5e). However, in the TTX treated animals, the terminal arborizations have now spread into the former interband regions (Fig. 5f).
Changes in terminal arbors with TTX. The tecta of 11 normal tadpoles and 6 three-eyed tadpoles were flat mounted and cleared following small localized injections of HRP into the optic nerve or tract. In these tecta, axon terminal arbors could frequently be visualized in a sufficiently low density to enable us to trace them in their entirety with the camera lucida. The terminal arbors of normal tadpoles have been described previously (Reh and Constantine Paton, 1984); therefore, only those terminals drawn from the threeeyed tadpoles will be detailed.
As in the normal tadpole, the axon terminals in three-eyed tadpoles were of two major classes. The most superficial terminal arbors had parent axons of very fine caliber that gave rise to branches of approximately the same diameter as the parent fiber. Few examples of this type were drawn, as they usually showed signs of significant degeneration with the survival times we used. The second type of terminal arbor had a parent axon of intermediate caliber and was located at an intermediate depth within the neuropil. Most of the terminal arbors that were drawn, and all of those in which the area was measured in this study, were of this type. The morphology of these arbors was found to vary slightly with the position of the terminal along the rostrocaudal axis of the tectum; however, the major features remained constant. The parent fiber typically split into two or three major branches that then give rise to numerous finer branches in a restricted locus on the tectum (Fig. 7a). The overall area over which this more profuse arborization occurred was measured for 10 terminals from three-eyed tadpoles and 9 terminals drawn from similarly staged normal tadpoles. No significant difference (Mann-Whitney U test) was found in the overall tangential area of the terminal arbors from the two classes of animals; therefore, they were grouped together (Fig. 8). In both the three-eyed tadpoles and the normal animals, the terminal arbors were more extensive along the rostrocaudal axis than along the mediolateral axis, and the terminal arbors in the rostral tectum occupied a somewhat smaller
188: eh a i on it thine dal, 1984) Constantin to ere of the terminals of the three-eyed animals is that the region of profuse arborization was always within a band of other labeled fibers even though the main axon cylinder of these terminals often crossed interband regions in their course from the tract.
It was also possible to draw and measure 17 of the larger class terminal arbors of three-eyed animals that had been poisoned for 2 to 4 weeks. An example of a typical terminal arbor from such an animal is shown in Figure 7b. Several aspects of these arborizations are noteworthy in their differences from those of the untreated threeeyed tadpoles. Many of the branches of the terminal arbors from the TTX-poisoned animals extend into the interband region, whereas in the untreated three-eyed animal the fine branches of the arbor are almost entirely confined to the bands of their eye of origin. Also, the arbors from the TTX-treated animals are more variable in their overall areal extent and on the average occupy a significantly greater tectal area (Mann-Whitney U test, <0.002) than do those from the untreated, dually innervated tecta. This can be seen more easily in Figure 8, where the areas of the terminal arbors have been plotted for both TIX-treated and nontreated three-eyed animals and similarly staged normal tadpoles.
RGCell number and area following chronic TX treatment. To determine the effects of chronic TTX treatment on the retinal cells, the total number of ganglion cells in both eyes of 13 midlarval staged (T&K X to XVI) tadpoles was calculated as described under "Materials and Methods." The ratio of right to left eye cell counts for four normal animals is plotted in Figure 9, along with the ratios of the RGC numbers from the TTX-treated eyes to those in the control eyes in animals that received a TX-Elvax pellet in one eye or as a cuff around one nerve for 20 to 40 days. It can be seen from Figure 9 that no appreciable loss of cells occurs in the TIX-treated eye, even after 40 days. Moreover, no differences in overall numbers of RGCs were found between the TTX-treated tadpoles and those values reported previously for similarly staged tadpoles (Reh and Constantine-Paton, 1983), indicating the absence of a systemic effect of the TTX on the growth and development of the larvae.
The average area of cells in the ganglion cell layer was also determined in seven of the same tadpoles in which activity was blocked monocularly with TTX for between 20 and 40 days. The average somal area of cells in this layer was 51.41 5.88 um for the control eye and 53.67 6.61 um for the TTX-treated eye. The small increase in mean cell area following the TTX administration, although not statistically significant, may indicate a slight chromatolytic response, similar to that observed in motoneurons following muscle paralysis with TTX (Czeh et al., 1978).
Discussion
Previous studies in three-eyed frogs have eliminated several factors from consideration as potential mechanisms by which the fibers from the two eyes are able to segregate in dually innervated tecta. As mentioned in the introduction, intrinsic laterality differences, histocompatibility differences, or different trajectories of fibers from the two eyes have all been shown to be uninvolved in the ability of optic terminals to "recognize" their source and segregate accordingly (Constantine-Paton and Law, 1978; Law and Constantine-Paton, 1980; Constantine-Paton et al., 1983). Furthermore, eye-specific segregation is a robust phenomenon that occurs over a wide range of innervation densities (Law, 1982; Norden and Constantine-Paton, 1983) and is not disrupted by dark rearing (Law, 1982).
The results presented in this study indicate that the neural activity in the optic nerves of three-eyed tadpoles is involved in the process of eye-specific segregation. Chronic blockade of Nat-dependent action potentials prevents segregation between the fibers of the third eye and the host eye during regeneration of the host optic nerve. Moreover, the fibers in previously formed eye-specific bands desegregate when the activity in the optic nerves is blocked with TTX, indicating that the maintenance of segregation is also activity dependent This conclusion is further supported by similar recent studies in the goldfish (Boss and Schmidt, 1982; Meyer, 1982) in which repeated intraocular injections of TTX were found to prevent eyespecific segregation when optic fibers from both eyes were surgically forced to regenerate to the same tectum.
In all of these experiments there remains the possibility that TTX is influencing some aspects of the system other than its activity. The fact that the optic fibers continue to transport both HRP and [°H] proline indicates that they have relatively normal axonal transport, and the HRP filled terminal arbors that we traced from the flat mounts did not show any signs of degeneration. We have not found any significant differences in the number or somal area of cells in the RGC layer of Rana tadpoles following treatment with TTX for up to a month. This indicates that retinal development is proceeding normally despite the lack of Na*-dependent action potentials, consistent with the report of Harris (1980) that axolotl eyes transplanted to TTX-secreting Taricha newts develop and differentiate normally. However, a recent study of the effects of chronic TTX administration on regeneration (Edwards and Grafstein, 1983) indicates that 11X slows the overall rate of regeneration and reduces the fast axonal transport of nucleosides (Grafstein and Edwards, 1982) in the regrowing fibers. Thus, it could be argued that the TX-induced prevention of resegregation during host optic nerve regeneration in the three-eyed tadpoles after optic nerve crush was the result of a slowing of the regeneration process and, hence, a delay in the formation of eye-specific bands. Moreover, this same criticism applies to the studies in goldfish (Boss and Schmidt, 1982; Meyer, 1982), since the method used to produce segregation involves forcing regenerating fibers to the ipsilateral tectum. We do not believe that a slowing of the regeneration process is responsible for the prevention of segregation for two reasons. First, both in the studies of goldfish and in our experiments in the three-eyed tadpoles, the eye-specific segregation was blocked for a longer duration than would be expected, given the delay in regeneration reported for goldfish optic nerve during chronic TTX treatment (Edwards and Grafstein, 1983). Second, the fact that TTX poisoning of intact nerves causes the already banded projections to desegregate in three-eyed tadpoles provides stronger evidence for the specific role of activity in eye-specific segregation since the decline in nucleoside synthesis and transport that occurs in regenerating fibers treated with TTX apparently does not occur in intact fibers following chronic activity blockade (Grafstein and Edwards, 1982).
Thus, eye-specific segregation in the experimentally induced dually innervated tecta of Rana pipiens and goldfish appears to share a common mechanism with ocular dominance columns in the cat visual cortex, where intraocular 11X injections have also been shown to inhibit segregation (Stryker, 1981, 1983). Since the retinotectal projection of the frog and the fish are normally entirely crossed, these animals do not have any need for a special mechansm for eye-specific segregation; therefore, it is reasonable to assume that the segregation of two competing afferent projections in some way reflects the response of the normal mapping mechanisms to this unique situation. In fact, several theoretical models of map formation predict the source-specific segregation of afferents when the fibers are made to interact competitively (von der Malsburg and Willshaw, 1976; von der Malsburg, 1979; Constantine-Paton, 1982).
The essential element in these models is that two independent mechanisms operate in the normal animal to ensure appropriate map formation. The overall alignment and gross topography of the map are provided by differential adhesion between ganglion cell terminals and tectal cells from corresponding retinal and tectal regions. Such gross adhesion differences have been demonstrated (Gottlieb et al., 1976; Bonhoeffer and Huf, 1980). However, a second mechanism preserves the relative order among the fibers by some type of competitive interaction, which stabilizes adjacent terminals if they arise from neighboring ganglion cell bodies and destabilizes adjacent terminals if they arise from spatially distant cells in the retina. When two ganglion cell terminal populations attempt to innervate the same postsynaptic cells, the adhesive interactions spread both projections across the tectum, to connect with the appropriate tectal regions. If only this mechanism were in operation, the terminals from both eyes would form completely overlapping, continuous projections. However, if in addition, there is a mechanism that stabilizes terminals from neighboring ganglion cells when they synapse on the same tectal cell or group of cells, the fibers from the one eye will tend to terminate in the same region, whereas those from different eyes will tend to segregate. The result of both processes operating simultaneously is the formation of eye-specific bands.
In this context, we interpret the results of our experiments on TTX and segregation to indicate that the role of activity during normal map formation is to mediate the competition among terminals that stabilizes terminals from neighboring retinal cells. This interpretation is consistent with recent reports that TTX blocks the "fine-tuning" of the retinotectal map during optic nerve regeneration in goldfish (Meyer, 1983; Schmidt and Edwards, 1983), but not the overall alignment or gross topography of the projection (Harris, 1980; Meyer, 1983; Schmidt and Edwards, 1983). This conclusion is further supported by the present experiments. Occasionally the fibers from the third eye split to innervate both host tecta, but they only form bands in the retinotopically appropriate region, not through the full extent of the tectum (Law and Constantine-Paton, 1981). When animals with these split projections are treated with TTX to cause fiber desegregation, the fibers remain in the roughly appropriate tectal region. Therefore, we propose that the activity in the optic nerves normally acts to refine the topography of the retinotectal map by providing a basis for preservation of the neighborhood relations of ganglion cell bodies in their tectal terminal arbors. Furthermore since elimination of patterned visual input by dark rearing three-eyed tadpoles fails to prevent band formation, (Law, 1982), it is likely that the spontaneous activity in the ganglion cell axons is sufficient for the fiber interactions.
At present, the details of the activity-dependent mechanism are unknown. In all of the models cited above, in order for the activity of the presynaptic cells to code for their retinal proximity, the action potentials of neighboring RGCs must be temporally correlated to a greater degree than that of non-neighboring cells. There is considerable evidence in several species that the spontaneous activity patterns of ganglion cells of the same center type are highly correlated when their receptive fields overlap; no correlation in spontaneous activity is observed between cells with nonoverlapping receptive fields (Rodieck, 1967; Arnett, 1978; Arnett and Spraker, 1981; Mastronarde, 1983a, b, c). Recent data in Rana tadpoles indicate that ganglion cells of similar type with overlapping receptive fields have temporally correlated patterns of spontaneous activity in this species as well (T. A. Reh, unpublished observation). Another essential element in our model, as well as in those of others that postulate the involvement of neural activity in eye-specific segregation and map formation (von der Malsburg and Willshaw, 1976; Whitelaw and Cowan, 1981), is that the synapses between RGC axons and tectal cells vary in their strength depending on the temporal correlation of the synaptic transmission. When two axons that have formed synapses on the same tectal cell fire coincidently, both synapses will be strengthened. Alternatively, if the two tibers have asynchronous patterns of activity, the connections they have with the same cell will be weakened. The strengthening of mutual connections as a result of coincident firing patterns in two fibers could operate by a mechanism such as that proposed by Hebb (1949) as a model for learning. Hebb (1949) proposed that connec tions might be strengthened if the pre- and postsynaptic cells were coincidently active. The temporal summation provided by the simultaneous activation of two (or more) presynaptic fibers with synapses on the same cell would thus increase the likelihood of postsynaptic activation for that cell and concomitantly would stabilize the active synapses. Although there has yet to be any direct demonstration that synapses can behave along the lines envisioned by Hebb (1949) in the retinotectal system, the computer models of map formation and eve-specific segregation have successfully employed this idea (von der Malsburg and Willshaw, 1976; Willshaw and von der Malsburg, 1976; Whitelaw and Cowan, 1981).
The hypothesis that the pattern of electrical activity might specify the connections made during neural ontogenesis has been considered as a potential explanation for a wide variety of experimental results, obtained in several systems (see Stent, 1973; Changeux and Danchin, 1976; Harris, 1981, for review). However, although it appears likely that a certain amount of activity is necessary for the normal maturation of many areas of the nervous system, e.g., the neuromuscular junction, it is not clear to what extent a particular pattern of activity is involved in determining which connections are sustained. Evidence demonstrating that binocularity of visual neurons is affected by modifications in the visual world in mammals (for review see Movshon and Van Sluyters, 1981) and by eye rotation in Xenopus (Keating, 1981; Udin and Keating, 1981) supports the hypothesis that coincident activity causes the selective stabilization or maintenance of synapses from positions on the two retinas viewing corresponding points of the visual world. The possibility that the pattern of spontaneous activity provides some degree of specificity has been dramatically demonstrated by recent results in the kitten visual cortex (Stryker, 1983), in which ocular dominance column formation, blocked by intraocular injections of TTX, could be induced by asynchronous but not synchronous direct electrical activation of the optic nerves. Thus, in addition to providing some trophic support to the developing visual system (Kupperman and Kasamatsu, 1983), the pattern of spontaneous discharge may also contribute to the selective synaptogenesis and synapse elimination that occurs prior to, and after, eye opening in the cat (Archer et al., 1982; Kalil et al., 1983). In this context, the effects seen from modification of the visual world are superimposed upon a tonic discharge and may act via the same mechanism to use the pattern of activity to specify the connections between neurons.
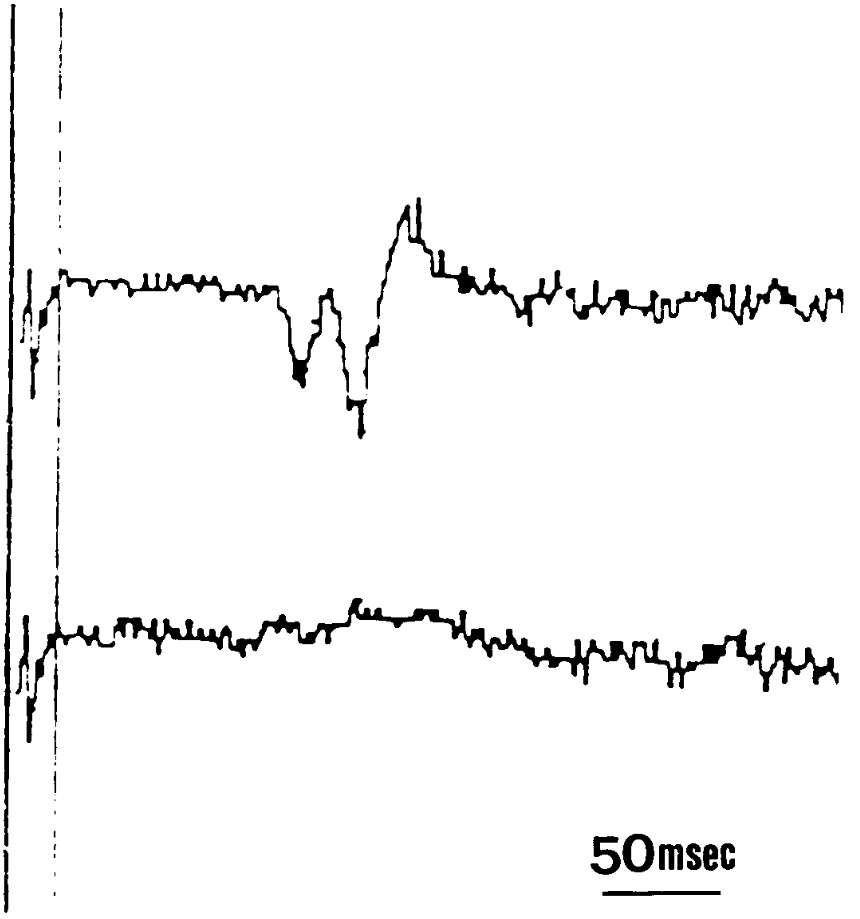
Figure 1. Averaged responses to 40 strobe flashes recorded in the tectal neuropil of a tadpole that has had a TTX-containing Elvax cuff on one optic nerve for 3 weeks. The upper trace shows the response recorded from the tectum ipsilateral to the TX-blocked nerve; the lower trace shows the response recorded from the contralateral tectum.
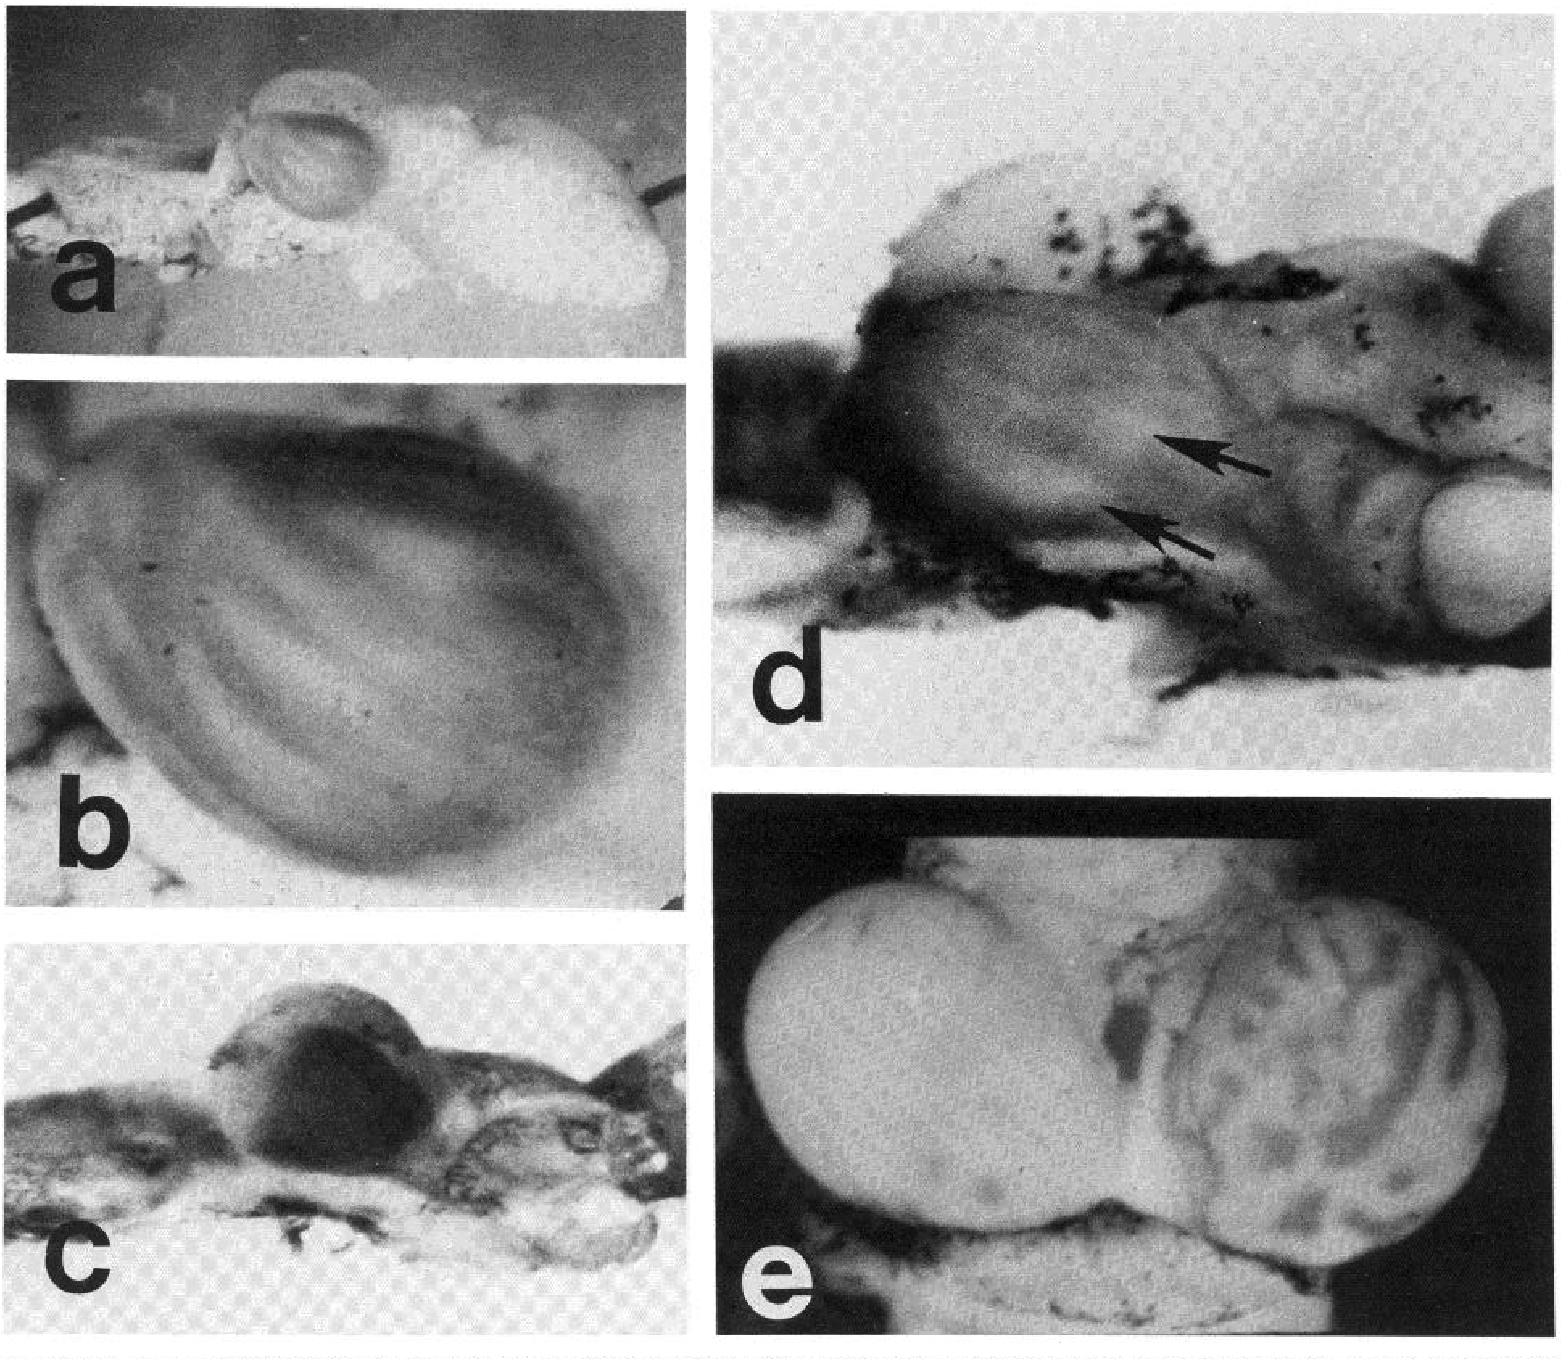
Figure 2. Whole mounted brains of three-eyed tadpoles in which the fibers from the third eye have been labeled with HRP at progressively later times after the bilateral crush of the host optic nerves. The brain shown in a (X 8) and b (x 33) was labeled and processed 10 days after crush of the host optic nerve. Note that, although the bands are still present, they are much less distinct as fibers spread into the interband region. This process is largely complete by 2 weeks (c, x 13). By 3 weeks, however, the fibers from the host eyes have begun to regenerate, and slight bands once again begin to form (arrows in d, x 20), and by 7 weeks after the nerve crush (e, * 20), the host optic nerve fibers have regenerated and completely resegregated to again form the banded pattern characteristic of three-eyed animals.
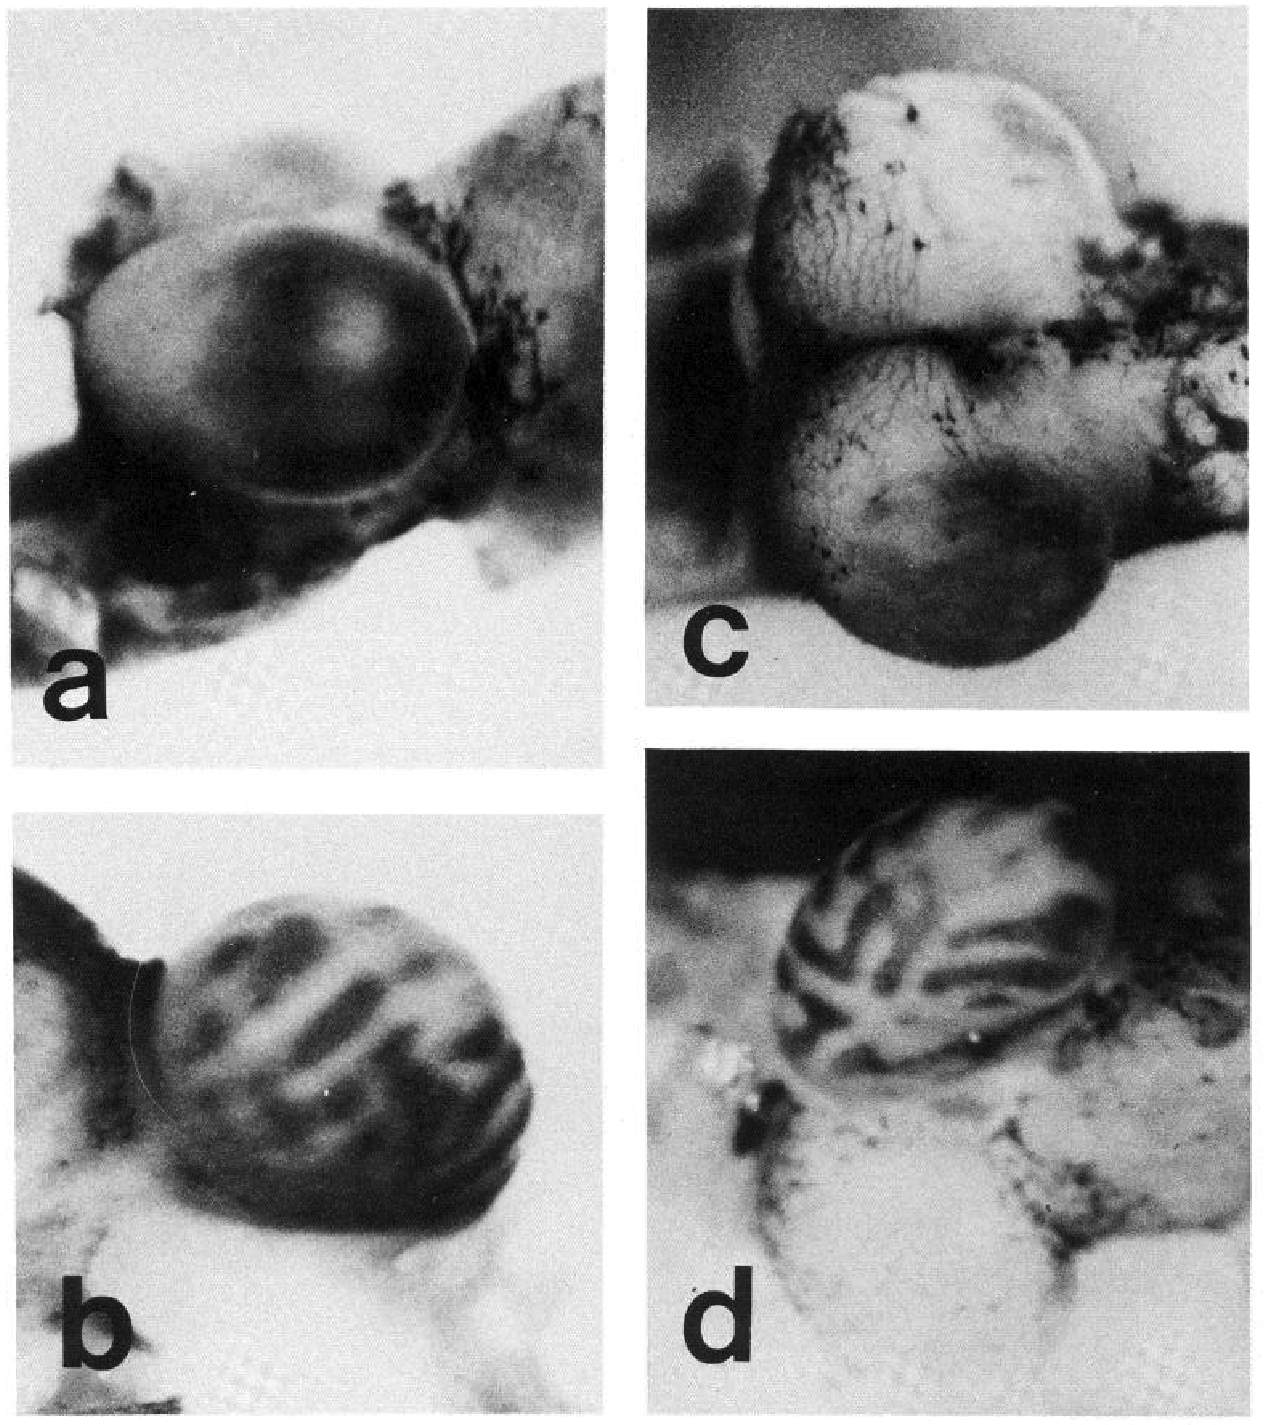
Figure 3. Whole mounted brains of four three-eyed tadpoles in which the host optic nerves were crushed 7 weeks before labeling the third nerve with HRP. The brains shown in a and c are from animals that had all three eyes poisoned with TTX during the first 3 weeks, and those shown in b and o are from tadpoles in which Elvax pellets without TTX were added in all three eyes during the same period. All brains are at approximately the same magnification (x 22). Rostral is to the right for a, c, and d, and to the left for b.
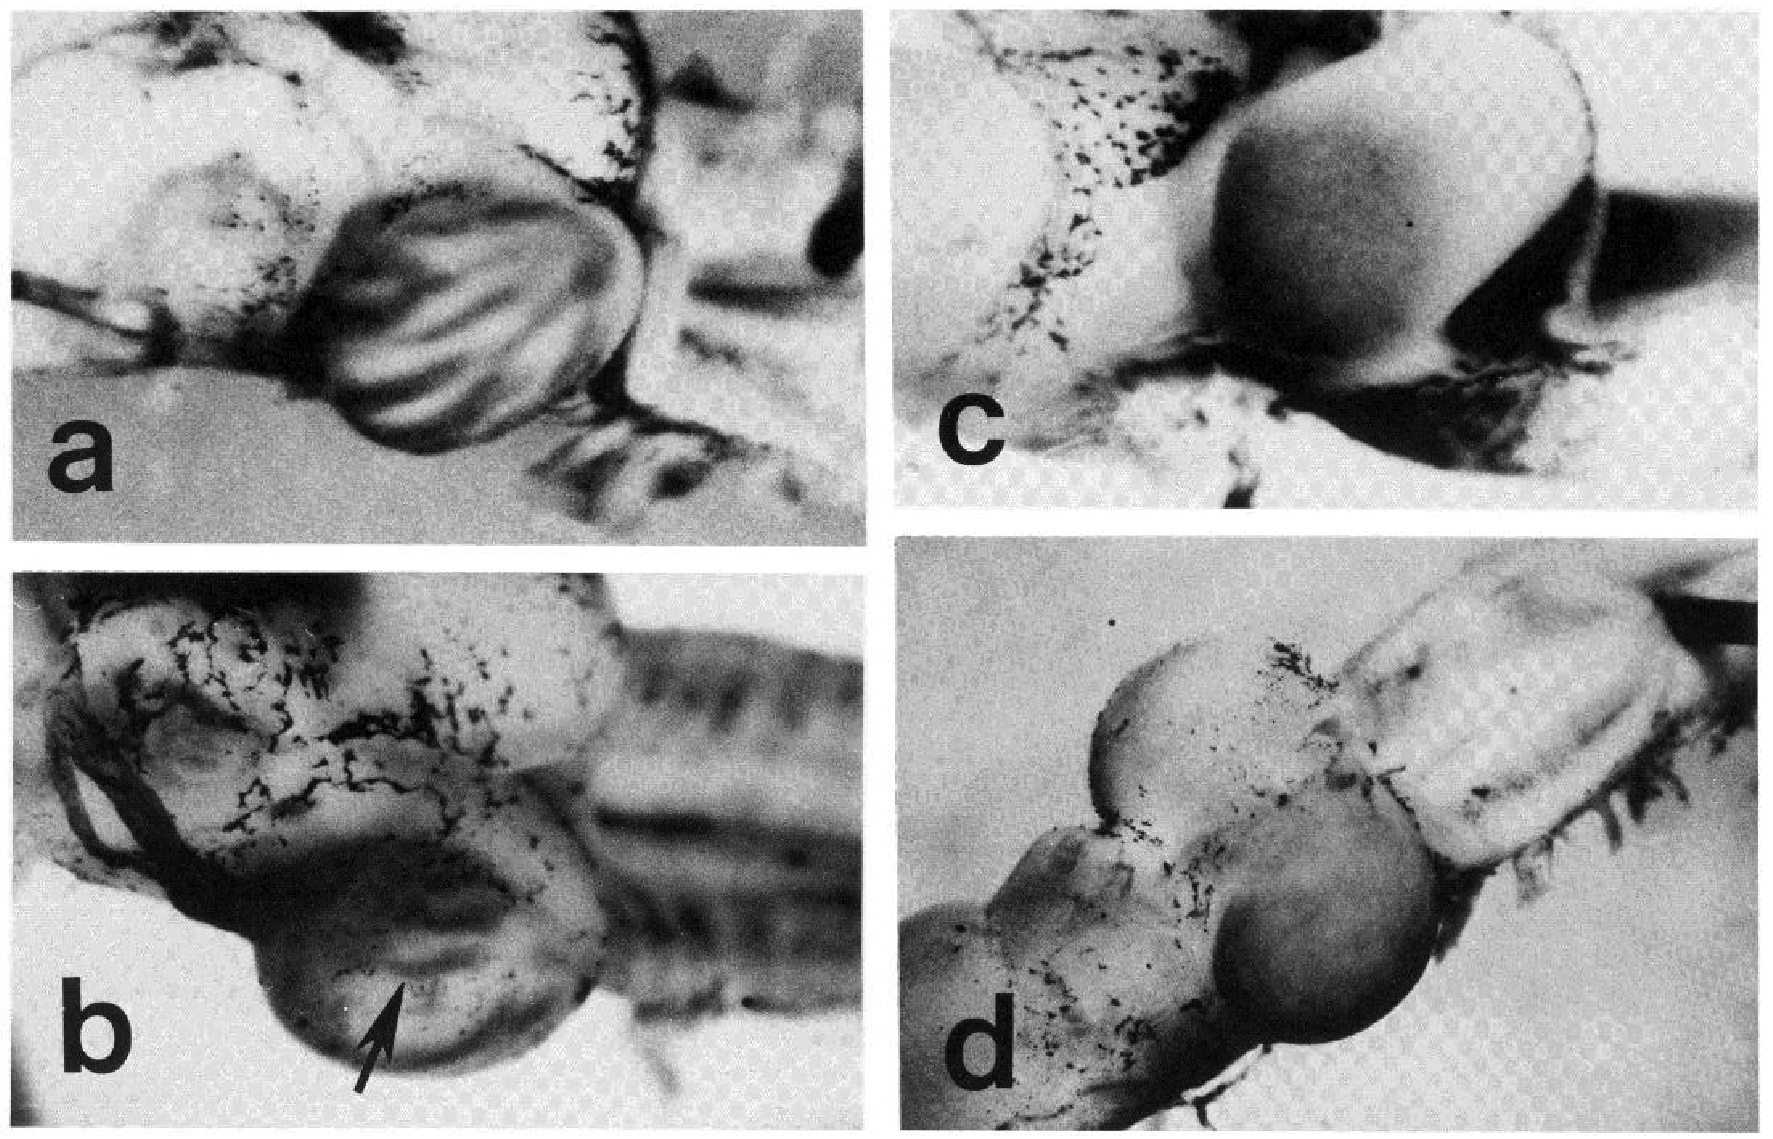
Figure 4. Whole mounted brains of four three-eyed tadpoles in which the third nerve was labeled with HRP. The brain shown in a is from an animal that had intraocular pellets of Elvax without TTX in all three eyes for 4 weeks. The brain shown in b had all nerves poisoned with TTX-containing Elvax cuffs for 2 weeks; notice that the rostral half of the tectum is continuously labeled, whereas stripes are still present in the caudal half (arrow). In c and d the brains are from tadpoles in which all activity was blocked by a TTX-containing Elvax as intraocular pellets (c) or as cuffs around all nerves (d) for 4 weeks. No evidence of stripes can be seen at this time. All brains are at approximately the same magnification (x 20), with d at a slightly lower power. Rostral is to the left in all of the photographs.
Figure 5. Flat mount preparations of optic tecta from three-eyed tadpoles following anterograde labeling with HRP of the third optic nerve. The animal whose tecta is shown in a had all three optic nerves silenced with TTX for 1 week. Note that there is a slight spreading of the fibers from the bands to the interband regions in rostral tectum (to the left); however, most of the terminals remain well segregated. In b to d the bands become progressively less distinct in animals treated with TTX for 2 weeks (b) and 3 weeks (c and d). In e, higher power views of flat mounted tecta from three-eyed animals show that, in the normally segregated projection, only a few axons pass between the bands (arrows), whereas in the TTX-treated animal fine arborizations have spread into the formerly interband regions. a to d are at the same magnification; scale bar = 500 um. e and f are at the same magnification; scale bar = 100 um.
Figure 6. Sections through the tecta of three-eyed tadpoles to show the double-label technique. The sections shown in a and b were illuminated in darkfield and the sections shown in c to e were photographed under brightfield illumination. The brain shown in a is from an animal that had Elvax pellets in all three eyes without TTX, showing the regular alternating banded pattern characteristic of doubly innervated tecta. The section shown in the remaining micrographs is from a three-eyed tadpole in which all three optic nerves were poisoned with TTX for 4 weeks. In the low power micrographs (b and c), the even distribution of both labels can be seen, and in the higher power micrographs (d and e), the fibrous nature of the HRP-filled axons (d) and the grains from the autoradiographic label (e) are in focus. In both the control and the TTX-poisoned cases the host nerve was labeled with ["Hiproline and the third nerve was labeled with HRP. Scale bars = 200 um (a), 400 pm (b and c), and 50 um (d and e). The white rectangle in c outlines the area shown in d and e.
Figure 7. Camera lucida drawings of retinal ganglion cell terminal arbors from the third eye labeled with HRP and drawn from approximately the same region (central) of flat mounted tecta. The terminal arbor shown in a is from a three-eyed tadpole without TTX treatment, and that shown in b is from an animal that had all three eyes poisoned for 3 weeks: Notice that the terminal in a has its long axis oriented with the band and its branches are confined to the band (B) containing the rest of the terminals from that eye, whereas that in b has many branches in the interband (1) regions which, prior to the TTX treatment, only contained terminal arbors from the host eye. In general, the arbors of three-eyed tadpoles have an average width (short axis) that is slightly smaller than that of the bands they occupy; however, following TTX treatment, both the short and long dimensions increase. Scale bar = 100 um.
Figure 8. The number of terminals is plotted according to their area for control tadpoles (normal and three-eyed not treated with TTX) in the upper histogram and for TTX-blocked three-eyed tadpoles in the lower histogram. Means for both groups are also included.
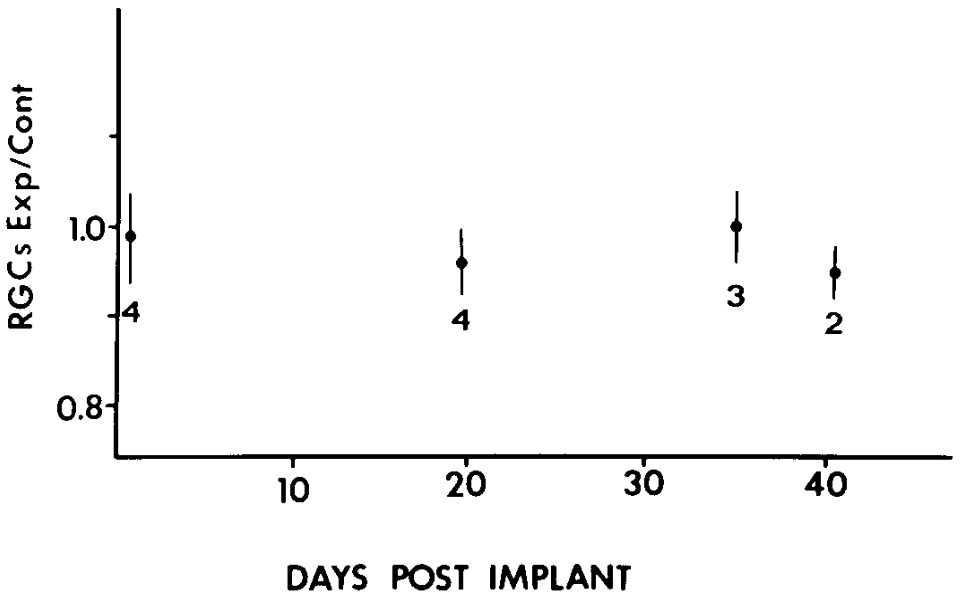
Figure 9. The ratio of cell number in the RGC layer of experimental eyes to that of control eyes is plotted against the number of days after the TTX. Elvax pellet was implanted. No significant difference was found between those animals with nerve cuff implants versus those with intraocular implants; therefore, the data from both groups have been pooled for this figure. Error Dars represent standard error at each time point.
N-Methyl-D-Aspartate Receptor Antagonist Desegregates Eye-Specific Stripes
10.1073/pnas.84.12.4342
Abstract
The optic tecta of surgically produced threeeyed tadpoles were chronically exposed to the N-methyl-Daspartate (NMDA) receptor antagonist aminophosphonovaleric acid (APV), or to NMDA itself, to assess the influence of NMIDA receptor/channels on the eye-specific segregation of retinal ganglion cell (RGC) terminals that occurs whenever two retinas innervate one tectal lobe. Exposure of the tectum to the active isomer of APV produces desegregation of the RGC terminals without blocking electrical activity in the afferents or altering their terminal arbor morphology. Exposure to the inactive isomer of APV causes no perturbation of the normal stripe pattern. APV-induced desegregation is completely reversible within 2 weeks of removal of the APV. In addition, exposure of the optic tectum to NMDA results in stripes with sharper borders and fewer forks and fusions than untreated animals. These results suggest that the NMDA receptor/ channel plays a role in eye-specific segregation in the three-eyed tadpole.
Intro
Studies on the establishment of topography in the central visual pathway suggest that retinotopic maps develop by a two-step process, whereby a coarse projection of afferents onto target neurons is followed by a dynamic sorting of relative synaptic positions based on stabilization of coactive afferent terminals. The same cellular mechanisms are believed to be involved in the formation of ocular dominance columns in the visual cortex (1-3), where inputs driven by left and right eyes converge within the same cortical layer. A model system in which to study the fine-tuning of synaptic positions is provided by implanting a supernumerary eye primordium into embryonic Rana pipiens. In surgically produced three-eyed tadpoles, retinal ganglion cells (RGCs) from the normal and supernumerary eyes project to the same optic tectum and their terminals segregate into highly stereotyped ocular dominance stripes (4, 5). Despite asymmetric patterns of retinal and tectal cell proliferation (6-8), both retinotopy and eye-specific segregation are maintained throughout the 3-6 months of larval development by a constant shifting of RGC terminals over the tectal surface (1, 9). Consequently, the mechanisms responsible for fine-tuning the retinotectal projection operate continuously throughout larval life, presumably by selectively increasing the lifetimes of coactive connections (10, 11). In the three-eyed frog, disruption of the fine-tuning mechanisms is detectable as a gradual degradation of the stripe pattern (9, 12).
Studies using tetrodotoxin (TTX) to block RGC action potentials have demonstrated that afferent activity is required for the refinement of both the retinotopic projection and eye-specific segregation (13-17). It is thought that retinal inputs confer their neighbor relations to the target neurons by virtue of their highly correlated action potentials (10, 11,@ 18-21). To understand how correlated inputs may be selectively stabilized, we are attempting to identify the events associated with close temporal activation of multiple inputs to the same postsynaptic cell.
Recent work on synaptic plasticity (22-24) has focused attention on the N-methyl-D-aspartate (NMDA) receptor/ channel, a subtype of glutamate-sensitive receptor/channel (25-27). The NMDA receptor/channel conducts calcium When the receptor binds transmitter, while the membrane is simultaneously depolarized by other inputs (25, 28, 29) and is therefore uniquely capable of recognizing coincident synaptic activity. In addition, the calcium may trigger biochemical events resulting in synaptic stabilization (30, 31). Since glutamate is a favored candidate neurotransmitter in the RGCs (32, 33), we tested whether activation of the MDA receptor/ channel could play a role in eye-specific segregation in three-eyed tadpoles.
We report that chronic application of aminophosphonovaleric acid (APV), a specific antagonist of the NMDA receptor/channel (34), to the optic tectum of three-eyed tadpoles results in a pronounced but reversible desegregation of RGC terminals without adverse effects on the tectum. APVinduced desegregation of RGC terminals differs from that produced by TTX, because AP V has no detectable effect on RGC activity or on RGC terminal arbor size. In addition, chronic application of NMDA itself to the optic tectum appears to produce stripes with sharper borders and fewer forks and fusions. These results suggest that the activation of the NMDA receptor/channel is essential for the fine-tuning of neural maps.
Materials and Methods
DL- or L-APV (1 mM, 0.1 mM, or 0.01 mM), NMDA (0.1 mM), or fluorescein isothiocyanate (0.1 mM) was suspended in the polymer Elvax (35) (a gift of Du Pont) and the solidified polymer was cut on a cryostat into thin slices (=500 × 500 x 30 um), which were implanted under the pia over the optic tecta of three-eyed R. pipiens tadpoles. After 2.5-5 weeks, the supernumerary retinal projection was labeled with horseradish peroxidase applied to the severed optic nerve. One or 2 days later, the brain underwent reaction with diaminobenzidine tetrachloride in whole mount (9, 36). Subsequently, the tecta were dissected and flattened between coverslips, fixed in 4% paraformaldehyde overnight, dehydrated, and cleared in xylene to produce the flat-mount preparations shown in the figures. Tadpoles were anesthetized by topical application of 0.1% MS222 before all surgical procedures and growth stage was determined according to Taylor and Kollros (37). Electrophysiological recordings of visually evoked responses were taken with tungsten electrodes from the tectal neuropil of tadpoles, which were continuously perfused through the heart with oxygenated Ringer's solution (9).
Results
The effects of the NMDA receptor/channel antagonist APV and of the agonist itself on the segregation of the RGC terminals in the optic tecta of three-eyed tadpoles are illustrated in Fig. 1. In unoperated or sham-operated tadpoles (Fig. la), the supernumerary retinal afferents terminate in eye-specific interdigitating bands =200 um wide, oriented along the rostrocaudal axis of the tectum (5) (n = 5). In contrast, the supernumerary retina of animals treated with APV for 4 weeks projects evenly over the tectum (n = 4; Fig. 1c). Tecta exposed to APV for shorter periods exhibit an intermediate stage of desegregation (Fig. 1b). The dose dependence and timing of the APV-induced desegregation appears to vary with the stages of all nine of the animals showing the effect, such that younger animals, whose tecta grow at a greater rate than older animals, exhibit more complete desegregation at lower APV concentrations or with shorter exposure times than older animals. The APV-induced desegregation was completely reversible within 2 weeks by the removal of the APV-Elvax slice from the brain (n = 4), so that the supernumerary eye projected in a striped pattern indistinguishable from unoperated animals. These data suggest that APV must be present to maintain desegregation. Furthermore, these data indicate that APV is released from the Elvax and is active throughout the exposure times used in these experiments. Exposure of the optic tectum to the inactive isomer L-APV for 4 weeks did not alter the normal striped pattern (Fig. 1d; n = 3). The eye-specific stripes in the tecta of animals chronically treated with NMDA (Fig. le) differ from the stripes in sham-operated or control tecta in three respects: the stripes in the NMDA-treated tecta are invariably straight and uniform in their periodicity, they have no forks or fusions (38), and the borders of the stripe and interstripe zones are sharper than in controls (n = 4). NMDA treatment appears to increase the capacity of tectal neurons to discriminate between afferents from each eye, resulting in less mixing of uncorrelated inputs in the eye-specific termination zones. We examined the morphology of RGC terminal arbors and the physiology of visually evoked responses in the optic tecta of APV-treated and untreated animals. The terminal arbors from APV-treated animals have the same tangential area as the arbors from untreated animals of the same age (Fig. 2). Furthermore, extracellular recordings taken from the optic tectum during the presentation of visual stimuli reveal that RGC afferent activity in APV-treated animals is indistinguishable from that in normal animals (Fig. 3). APV-induced desegregation is not due to toxic effects of the drug on either the tectum or the retinal afferents. As mentioned above, the APV-induced desegregation was completely reversible after removal of the APV-Elvax slice. Histological examination of sectioned tecta treated with APV revealed no obvious disruption in cell number, lamination, or neuropil thickness. In addition, we estimated cell densities in layer 6 by counting cells in a 625-um? x 10-um volume under ×400 magnification (38). Cell densities from untreated and APV-treated tecta were not significantly different (15.7 ÷ 1.6 cells per 6250 um' and 15.4 # 0.5 cells per 6250 um', respectively; n = 3 for each group). In short, no signs of cell damage or death were observed in treated animals.
Discussion
The results demonstrate desegregation of ocular dominance stripes by the specific MDA receptor/channel antagonist APV. We suggest that activation of the MDA receptor/ channel allows tectal neurons to recognize and maintain coactive afferent synapses; while inappropriate converging inputs are lost. Because ganglion cells that are retinal neighbors are known to be coactive (18-21), whereas the activity pattern in non-neighboring RGCs is relatively uncorrelated, coactive neighboring RGCs whose arbors converge on the same population of tectal neurons would activate NMDA receptor/channels as their postsynaptic potentials summate. Normal activation of the NMDA receptor/ channel would initiate a process of synapse stabilization and thereby preserve the neighbor relations in the target tissue during the formation of the retinotopic map. Exogenous NMDA would desensitize the NMDA receptors so that a higher degree of afferent coactivity is required to stabilize synapses, resulting in stripes with sharper borders. Blocking the NMDA receptor/channels would prevent recognition of afferent coactivity and eliminate selective synapse stabilization, thereby producing desegregation in the face of normal patterns of presynaptic activity. Singer et al. (22) have reported that chronic infusion of APV into the striate cortex of kittens blocks the physiologically determined ocular dominance shift normally seen in response to monocular deprivation. These results are consistent with the role we propose for the NMDA receptor/channel in the structural stabilization of coactive visual synapses.
Chronic application of TTX to the optic nerves of threeeyed tadpoles results in the desegregation of the striped pattern in the tectum that is similar to the effect of chronic APV treatment and occurs over roughly the same time period (12). However, TTX-induced desegregation and APV-induced desegregation differ in at least three respects: TTX blocks visually evoked activity in the retinal afferents, the RGC terminal arbors of TTX-treated animals occupy 2-3 times as much area as arbors from untreated animals, and growth cones are more prevalent on the RGC terminals of TTX-treated animals (12). There are three possible interpretations for TTX-induced desegregation. First, TTX-induced desegregation might be due to sprouting of RGC terminals, since decreased action potential activity facilitates sprouting in cultured Helisoma neurons (39). Alternatively, TTX, by decreasing the activation of tectal cells, may cause desegregation through a mechanism similar to that proposed for the neuromuscular junction (40). Namely, inactive target neurons would actively, but nonselectively, recruit inputs by releasing a sprouting factor. Finally, TTX-induced desegregation may be attributed to a disruption of the process of synaptic stabilization. We believe that the APV-induced desegregation lends support to the third interpretation of the TTX-induced desegregation. Our results suggest that desegregation and sprouting are governed by different mechanisms and that TTX-induced desegregation results from the indirect block of postsynaptic NMDA receptor/channels.
This study suggests a general mechanism for the development and maintenance of neural maps in the vertebrate central nervous system based on a scheme originally proposed by Hebb (10, 11). The model we present closely parallels the proposed cellular mechanisms underlying long term potentiation (LTP) in the CAl region of the hippocampus, where a particular spatiotemporal pattern of preand postsynaptic activity produces a long-lasting increase in synaptic efficacy through the activation of postsynaptic NMDA receptor/channels (23, 24, 41-45). The desegregation of eye-specific stripes in APV-treated animals provides anatomical evidence for a role of the NMDA receptor/ channel in determining the relative positions of synaptic inputs in central nervous system projections. Our data, in the context of the extensive work on LTP, suggest that a single mechanism has properties that would allow it to control structural refinement in the developing nervous system and plasticity in the mature brain.
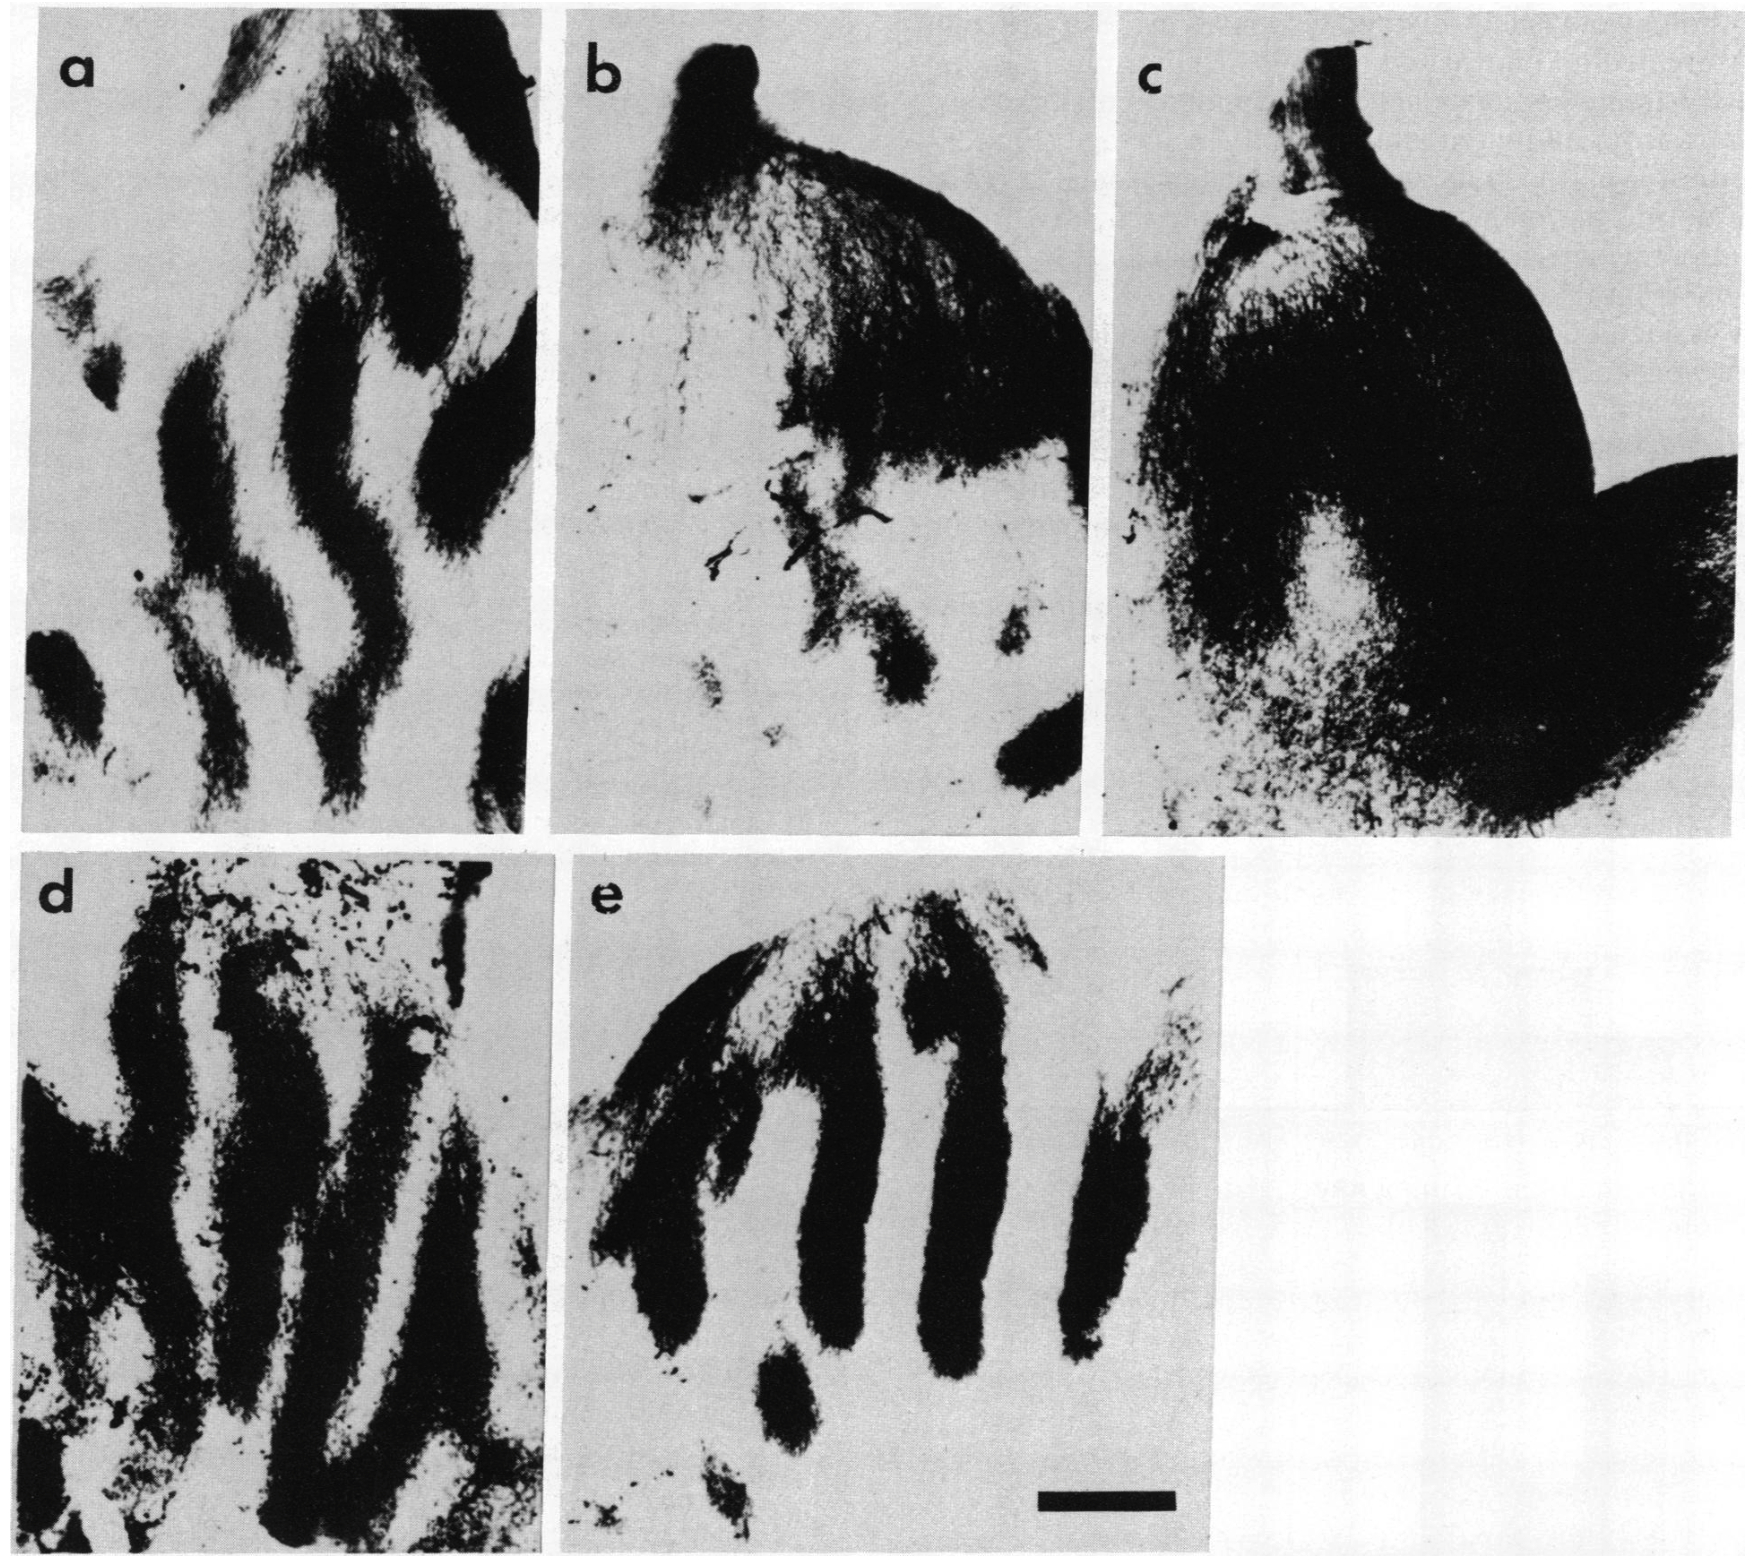
FiG. 1. Effect of the receptor/channel agonist MDA and of the antagonist DL-APV on segregation of RGC afferents in doubly innervated optic tecta. (a) A tectum from a sham-operated animal implanted with fluorescein-conjugated isothiocyanate-Elvax [Taylor and Kollros (T&K) stage XV] (37) shows the stereotypical striped pattern representing the segregation of the supernumerary retinal afferents from the afferents of the normal eye. The segregation of the inputs is not altered by the operation or by the mechanical effect of the Elvax on the tectum. (b) A tectum from an animal (T&K stage XIV) treated with DL-APV (0.01 mM) for 2.5 weeks displays an intermediate stage of desegregation. The striped pattern in the rostral tectum has lost its integrity, although periodic variation in horseradish peroxidase staining intensity remains. In the caudal tectum, the terminals are clumped into smaller units called "puffs," which have been previously noted in sparsely innervated tectal lobes (38). (c) A tectum from an animal (T&K stage VIII) treated with DL-APV (0.01 mM) for 4 weeks displays complete overlap of the supernumerary abdled witherseratist ioroxidoe. Four ofeseere antia w sheweda continuous suretrumerary ont herve proecction. ad) Atectue from an animal (T&K stage XIV) treated with the inactive isomer of APV (0.1 mM) for 4 weeks displays normal eye-specific segregation. (e) A tectum from an animal (T&K stage IX) treated with NMDA (0.1 mM) for 4 weeks. This animal and three others similarly treated show stripes that are straighter and have sharper stripe-interstripe boundaries than control tecta. Rostral is up. (Bar = 200 um.)
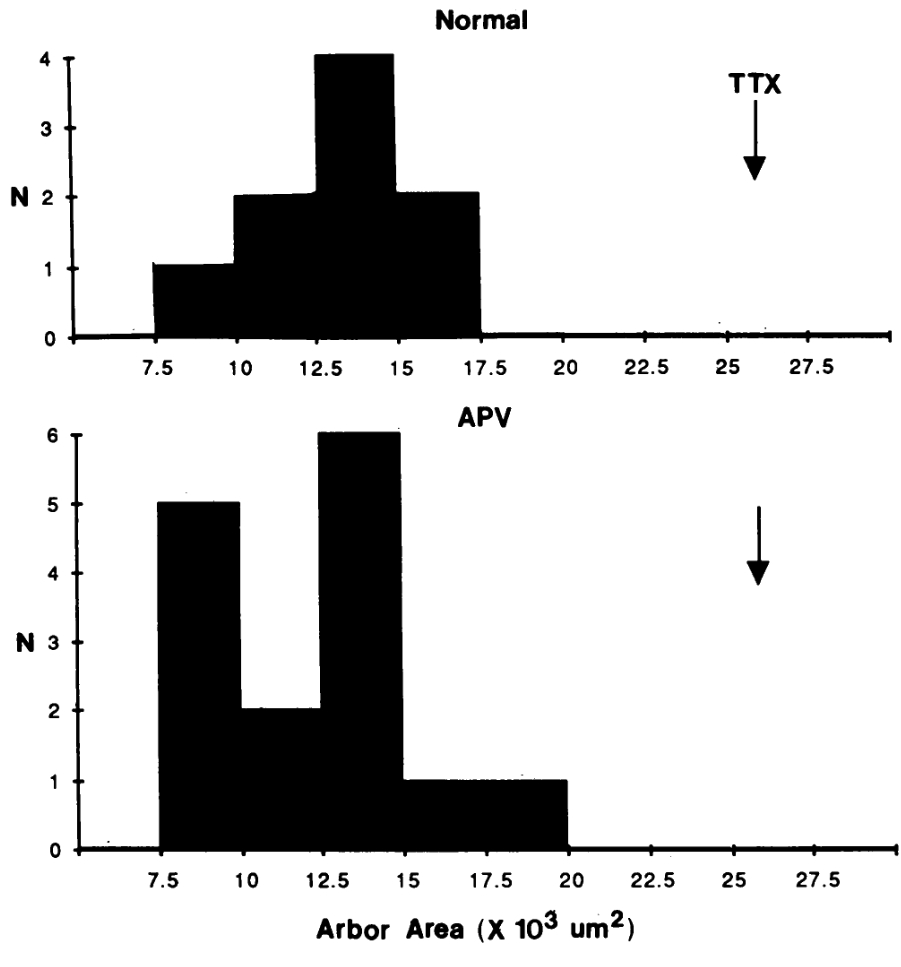
FiG. 2. The number of RGC terminals (N) plotted against their tangential area for untreated animals (mean area # SD = 13.3 × 10³ ‡ 2.5 × 10³ um?; n = 9; Upper) and for DL-APV-treated tadpoles (mean area ‡ SD = 12.2 × 10³ ÷ 2.8 × 10³ um; n = 15; Lower). The areas occupied by arbors of the two groups are not significantly different (two-tailed / test), whereas the mean area occupied by arbors from TTX-treated animals (12) is 25.3 × 10³ um? (arrow), about twice the size of the controls.
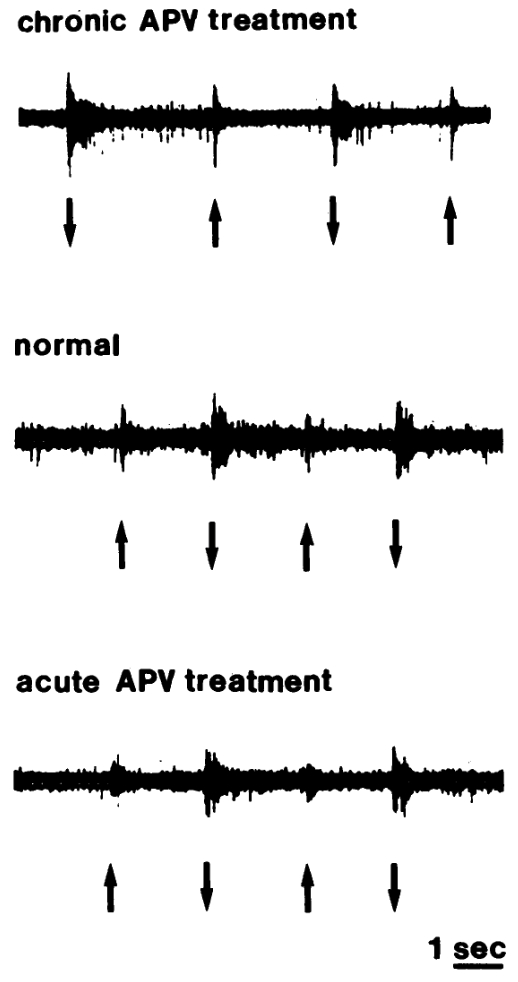
FIG. 3. Visually evoked responses recorded from the optic tecta of tadpoles chronically treated with DL-APV (n = 3) (Top), untreated (n = 5) (Middle), and acutely treated by topical application of APV (0.1 mM in Ringer's solution) to the exposed optic tectum (n = 3) (Bottom). Lights were turned on (upward arrows) and off (downward arrows) as indicated under each trace. In animals treated chronically with APV, the entire dorsal surface of the tectum had been exposed to APV-Elvax (1 mM) for 5-6 weeks prior to the recording session. To control for the possibility that any effect of chronically applied APV on spike invasion into the afferent terminals was washed out by the perfusion system before the recordings were taken, we applied APV solution directly to the exposed optic tectum (i.e., acutely treated) and tested for the presence of afferent activity every 10 min for 1 hr.