Lineweaver-Burke Plots
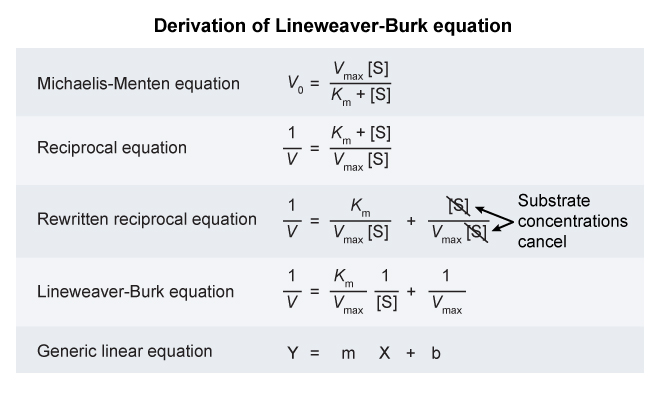
- The Michaelis-Menten equation describes the rate of an enzymatic reaction as a function of substrate concentration.
- It is written in the form :
where :
= substrate concentration
= observed reaction rate at a given
= maximum possible reaction rate
:
Michaelis constant
substrate concentration at which
is achieved also a "measure" of the affinity of Enzyme for Substrate
Binding Tightness of ES complex
- smaller values of
mean the Enzyme is more tightly bound to the Substrate
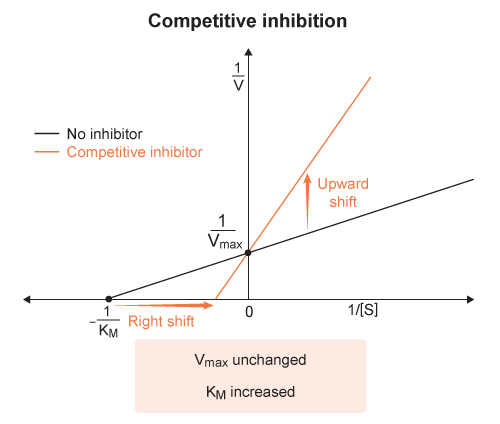
Lineweaver-Burke plots are used to determine Michaelis-Menton kinetic parameters.
These linear plots relate the inverse of reaction velocity
on the y-axis to the inverse of the substrate concentration on the x-axis. This linear relationship is based on rearrangements of the Michaelis-Menton equation.
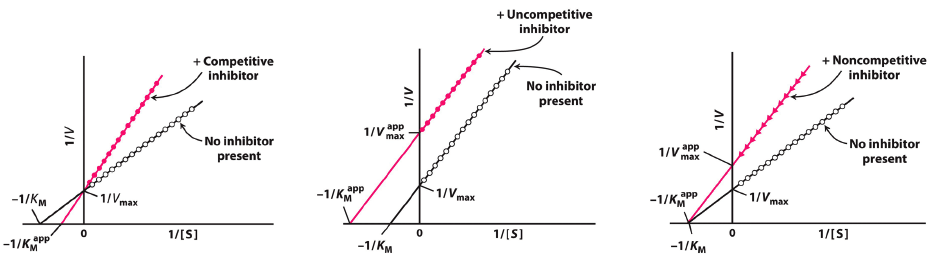
On a Lineweaver-Burke plot :
the x-intercept corresponds to the negative inverse of the Michaelis constant
- ( x-intercept =
) And the y-intercept corresponds to the inverse of the maximum velocity
- ( y-intercept =
) Because the y-intercept in a Lineweaver-Burke plot is
, an increase in would lower the y-intercept.
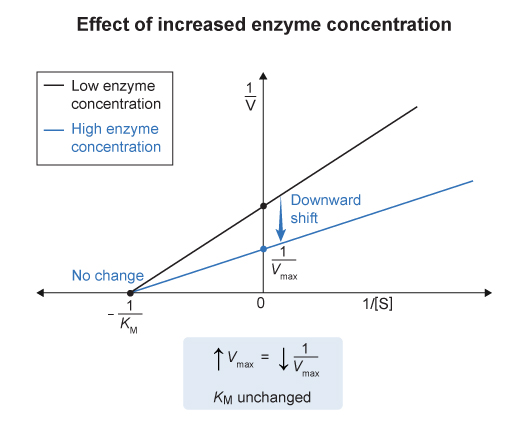
The enzyme affinity for substrate (
) is independent of enzyme concentration
- so the x-intercept (
) would remain unchanged with varying enzyme concentration
- In this example , interleukin-
upregulates the synthesis of PGE1 , which results in increased enzyme concentration. - The maximum velocity (
) of the enzyme-catalyzed reaction , which occurs when the enzyme is saturated with substrate , is equal to the product of the catalytic rate constant ( ) and the concentration of enzyme in solution :
- Therefore , increasing enzyme concentration would result in an increase in the maximum velocity o fhte reaction and a decrease in the y-intercept.
- An in crease in the amount of enzyme available in a particular system will cause an increase in
but no change in in Michaelis-Menten kinetics. - Lineweaver-Burke graphs are linear plots that relate inverse reaction velocity (
) to inverse substrate concentration ( ) - An increase in enzyme concentration would cause a decrease in the y-intercept (
) and no change in the x-intercept ( ) in a Lineweaver-Burke plot. #concept , #graph , #enzyme , #kinetics