Chapter 8 - Figures

A sample of “diverse animalcules” seen by van Leeuwenhoek using his simple microscope. (A) Bacteria seen in material he excavated from between his teeth. Those in fig. B he described as “swimming first forward and then backwards” (1692). (B) The eucaryotic green alga Volvox (1700). (Courtesy of the John Innes Foundation.)
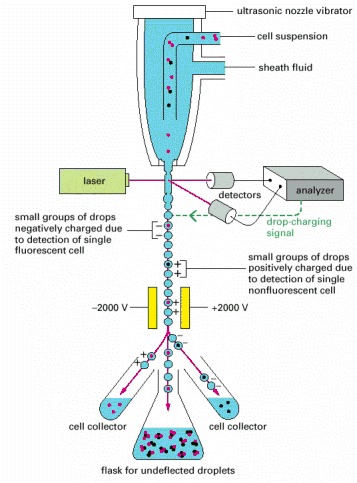
. A cell passing through the laser beam is monitored for fluorescence. Droplets containing single cells are given a negative or positive charge, depending on whether the cell is fluorescent or not. The droplets are then deflected by an electric field into collection tubes according to their charge. Note that the cell concentration must be adjusted so that most droplets contain no cells and flow to a waste container together with any cell clumps.
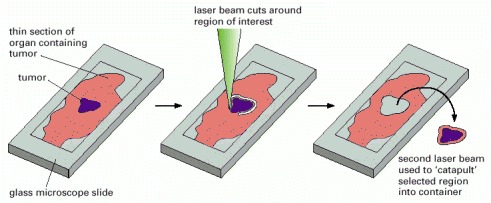
This method uses a laser beam to excise a region of interest and eject it into a container, and it permits the isolation of even a single cell from a tissue sample.
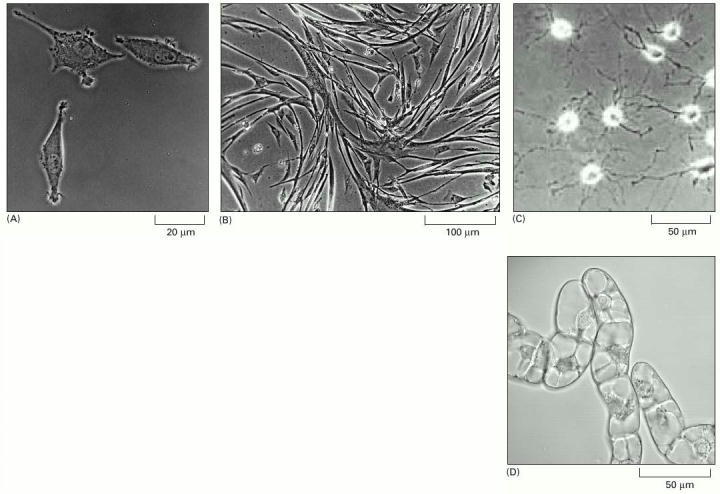
(A) Phase-contrast micrograph of fibroblasts in culture. (B) Micrograph of myoblasts in culture shows cells fusing to form multinucleate muscle cells. (C) Oligodendrocyte precursor cells in culture. (D) Tobacco cells, from a fast-growing immortal cell line called BY2, in liquid culture. Nuclei and vacuoles can be seen in these cells. (A, courtesy of Daniel Zicha; B, courtesy of Rosalind Zalin; C, from D.G. Tang et al., J. Cell Biol. 148:971–984, 2000. © The Rockefeller University Press; D, courtesy of Gethin Roberts.)
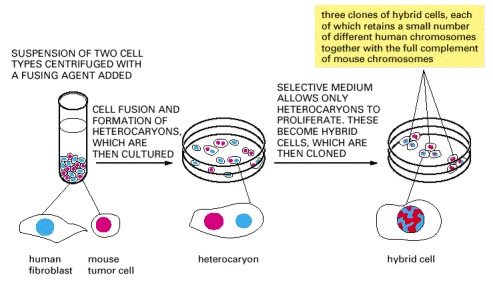
Human cells and mouse cells are fused to produce heterocaryons (each with two or more nuclei), which eventually form hybrid cells (each with one fused nucleus). These particular hybrid cells are useful for mapping human genes on specific human chromosomes because most of the human chromosomes are quickly lost in a random manner, leaving clones that retain only one or a few. The hybrid cells produced by fusing other types of cells often retain most of their chromosomes.
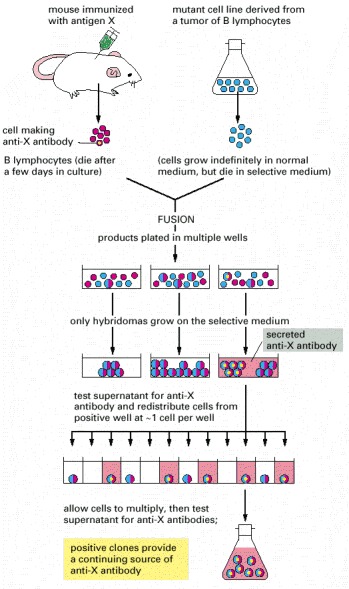
Here the antigen of interest is designated as “antigen X.” The selective growth medium used after the cell fusion step contains an inhibitor (aminopterin) that blocks the normal biosynthetic pathways by which nucleotides are made. The cells must therefore use a bypass pathway to synthesize their nucleic acids. This pathway is defective in the mutant cell line derived from the tumor, but it is intact in the cells obtained from the immunized mouse. Because neither cell type used for the initial fusion can grow on its own, only the hybrid cells survive.
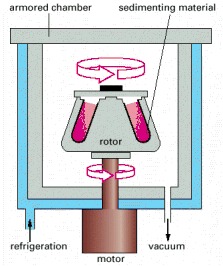
The sample is contained in tubes that are inserted into a ring of cylindrical holes in a metal rotor. Rapid rotation of the rotor generates enormous centrifugal forces, which cause particles in the sample to sediment. The vacuum reduces friction, preventing heating of the rotor and allowing the refrigeration system to maintain the sample at 4°C.
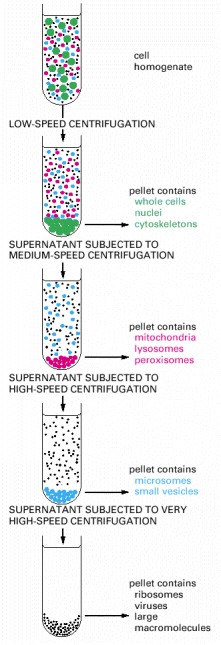
Repeated centrifugation at progressively higher speeds will fractionate homogenates of cells into their components. In general, the smaller the subcellular component, the greater is the centrifugal force required to sediment it. Typical values for the various centrifugation steps referred to in the figure are:
| low speed | 1000 times gravity for 10 minutes |
| medium speed | 20,000 times gravity for 20 minutes |
| high speed | 80,000 times gravity for 1 hour |
| very high speed | 150,000 times gravity for 3 hour |
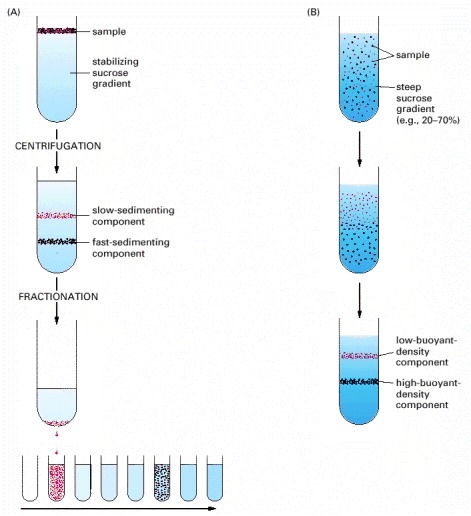
In velocity sedimentation (A) subcellular components sediment at different speeds according to their size and shape when layered over a dilute solution containing sucrose. To stabilize the sedimenting bands against convective mixing caused by small differences in temperature or solute concentration, the tube contains a continuous shallow gradient of sucrose that increases in concentration toward the bottom of the tube (typically from 5% to 20% sucrose). Following centrifugation, the different components can be collected individually, most simply by puncturing the plastic centrifuge tube and collecting drops from the bottom, as illustrated here. In equilibrium sedimentation (B) subcellular components move up or down when centrifuged in a gradient until they reach a position where their density matches their surroundings. Although a sucrose gradient is shown here, denser gradients, which are especially useful for protein and nucleic acid separation, can be formed from cesium chloride. The final bands, at equilibrium, can be collected as in (A).
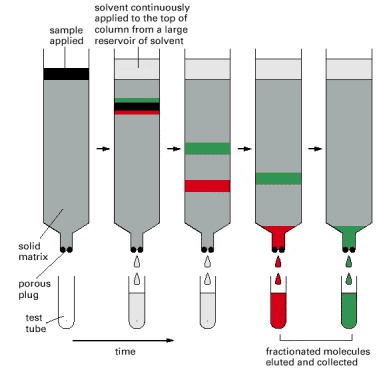
The sample, a mixture of different molecules, is applied to the top of a cylindrical glass or plastic column filled with a permeable solid matrix, such as cellulose, immersed in solvent. A large amount of solvent is then pumped slowly through the column and collected in separate tubes as it emerges from the bottom. Because various components of the sample travel at different rates through the column, they are fractionated into different tubes.
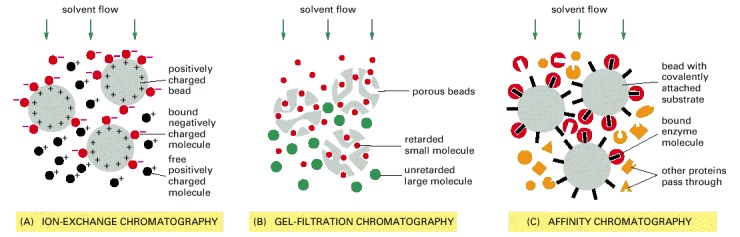
In ion-exchange chromatography (A) the insoluble matrix carries ionic charges that retard the movement of molecules of opposite charge. Matrices used for separating proteins include diethylaminoethylcellulose (DEAE-cellulose), which is positively charged, and carboxymethylcellulose (CM-cellulose) and phosphocellulose, which are negatively charged. Analogous matrices based on agarose or other polymers are also frequently used. The strength of the association between the dissolved molecules and the ion-exchange matrix depends on both the ionic strength and the pH of the solution that is passing down the column, which may therefore be varied systematically (as in Figure 8-12) to achieve an effective separation. In gel-filtration chromatography (B) the matrix is inert but porous. Molecules that are small enough to penetrate into the matrix are thereby delayed and travel more slowly through the column. Beads of cross-linked polysaccharide (dextran, agarose, or acrylamide) are available commercially in a wide range of pore sizes, making them suitable for the fractionation of molecules of various molecular weights, from less than 500 to more than 5 × 10⁶. Affinity chromatography (C) uses an insoluble matrix that is covalently linked to a specific ligand, such as an antibody molecule or an enzyme substrate, that will bind a specific protein. Enzyme molecules that bind to immobilized substrates on such columns can be eluted with a concentrated solution of the free form of the substrate molecule, while molecules that bind to immobilized antibodies can be eluted by dissociating the antibody-antigen complex with concentrated salt solutions or solutions of high or low pH. High degrees of purification are often achieved in a single pass through an affinity column.
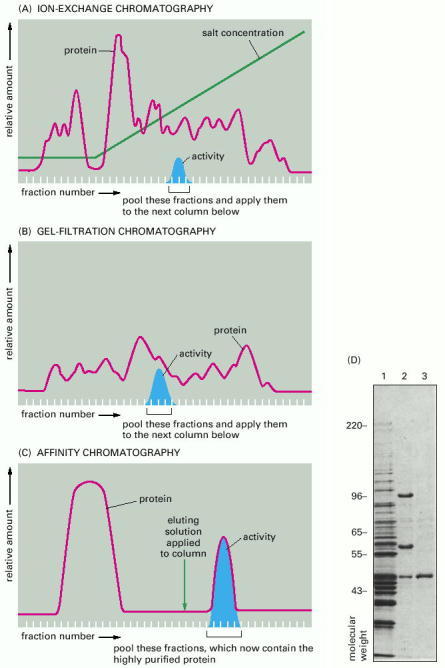
Typical results obtained when three different chromatographic steps are used in succession to purify a protein. In this example a homogenate of cells was first fractionated by allowing it to percolate through an ion-exchange resin packed into a column (A). The column was washed, and the bound proteins were then eluted by passing a solution containing a gradually increasing concentration of salt onto the top of the column. Proteins with the lowest affinity for the ion-exchange resin passed directly through the column and were collected in the earliest fractions eluted from the bottom of the column. The remaining proteins were eluted in sequence according to their affinity for the resin—those proteins binding most tightly to the resin requiring the highest concentration of salt to remove them. The protein of interest was eluted in several fractions and was detected by its enzymatic activity. The fractions with activity were pooled and then applied to a second, gel-filtration column (B). The elution position of the still-impure protein was again determined by its enzymatic activity and the active fractions were pooled and purified to homogeneity on an affinity column (C) that contained an immobilized substrate of the enzyme. (D) Affinity purification of cyclin-binding proteins from S. cerevisiae, as analyzed by SDS polyacrylamide-gel electrophoresis (see Figure 8-14). Lane 1 is a total cell extract; lane 2 shows the proteins eluted from an affinity column containing cyclin B2; lane 3 shows one major protein eluted from a cyclin B3 affinity column. Proteins in lanes 2 and 3 were eluted with salt and the gels was stained with Coomassie blue. (D, from D. Kellogg et al., J. Cell Biol. 130:675–685, 1995. © The Rockefeller University Press.)
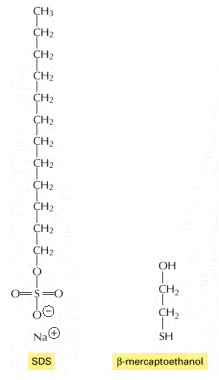
These two chemicals are used to solubilize proteins for SDS polyacrylamide-gel electrophoresis. The SDS is shown here in its ionized form.
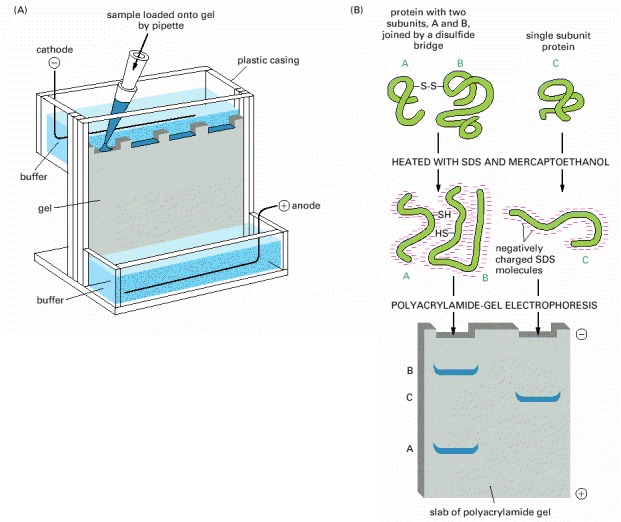
(A) An electrophoresis apparatus. (B) Individual polypeptide chains form a complex with negatively charged molecules of sodium dodecyl sulfate (SDS) and therefore migrate as a negatively charged SDS-protein complex through a porous gel of polyacrylamide. Because the speed of migration under these conditions is greater the smaller the polypeptide, this technique can be used to determine the approximate molecular weight of a polypeptide chain as well as the subunit composition of a protein. If the protein contains a large amount of carbohydrate, however, it will move anomalously on the gel and its apparent molecular weight estimated by SDS-PAGE will be misleading.
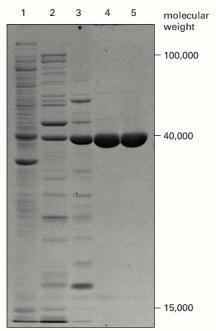
The photograph shows a Coomassie-stained gel that has been used to detect the proteins present at successive stages in the purification of an enzyme. The leftmost lane (lane 1) contains the complex mixture of proteins in the starting cell extract, and each succeeding lane analyzes the proteins obtained after a chromatographic fractionation of the protein sample analyzed in the previous lane (see Figure 8-12). The same total amount of protein (10 μg) was loaded onto the gel at the top of each lane. Individual proteins normally appear as sharp, dye-stained bands; a band broadens, however, when it contains too much protein. (From T. Formosa and B.M. Alberts, J. Biol. Chem. 261:6107–6118, 1986.)
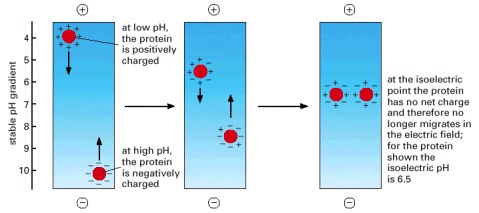
At low pH (high H+ concentration) the carboxylic acid groups of proteins tend to be uncharged (-COOH) and their nitrogen-containing basic groups fully charged (for example, -NH3 +), giving most proteins a net positive charge. At high pH the carboxylic acid groups are negatively charged (-COO-) and the basic groups tend to be uncharged (for example, -NH2), giving most proteins a net negative charge. At its isoelectric pH a protein has no net charge since the positive and negative charges balance. Thus, when a tube containing a fixed pH gradient is subjected to a strong electric field in the appropriate direction, each protein species present migrates until it forms a sharp band at its isoelectric pH, as shown.
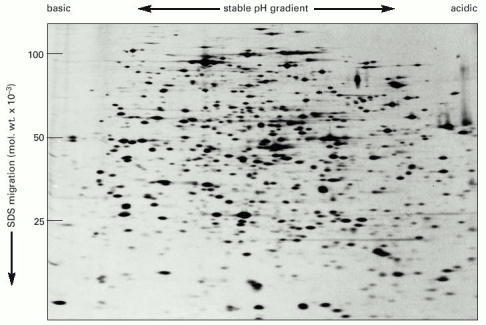
All the proteins in an E. coli bacterial cell are separated in this gel, in which each spot corresponds to a different polypeptide chain. The proteins were first separated on the basis of their isoelectric points by isoelectric focusing from left to right. They were then further fractionated according to their molecular weights by electrophoresis from top to bottom in the presence of SDS. Note that different proteins are present in very different amounts. The bacteria were fed with a mixture of radioisotope-labeled amino acids so that all of their proteins were radioactive and could be detected by autoradiography (see pp. 578–579). (Courtesy of Patrick O'Farrell.)
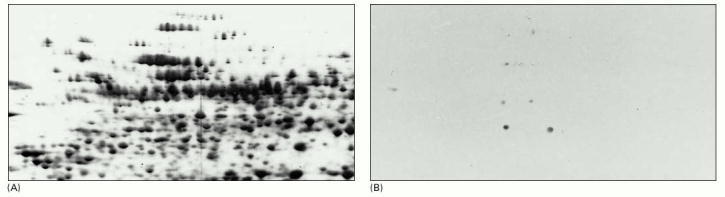
The total proteins from dividing tobacco cells in culture are first separated by two-dimensional polyacrylamide-gel electrophoresis and in (A) their positions are revealed by a sensitive protein stain. In (B) the separated proteins on an identical gel were then transferred to a sheet of nitrocellulose and exposed to an antibody that recognizes only those proteins that are phosphorylated on threonine residues during mitosis. The positions of the dozen or so proteins that are recognized by this antibody are revealed by an enzyme-linked second antibody. This technique is also known as immunoblotting. (From J.A. Traas, A.F. Bevan, J.H. Doonan, J. Cordewener, and P.J. Shaw, Plant J. 2:723–732, 1992. © Blackwell Scientific Publications.)
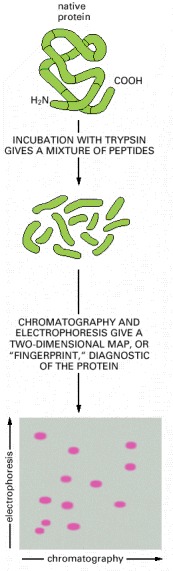
Here, the protein was digested with trypsin to generate a mixture of polypeptide fragments, which was then fractionated in two dimensions by electrophoresis and partition chromatography. The latter technique separates peptides on the basis of their differential solubilities in water, which is preferentially bound to the solid matrix, as compared to the solvent in which they are applied. The resulting pattern of spots obtained from such a digest is diagnostic of the protein analyzed. It is also used to detect posttranslational modifications of proteins.
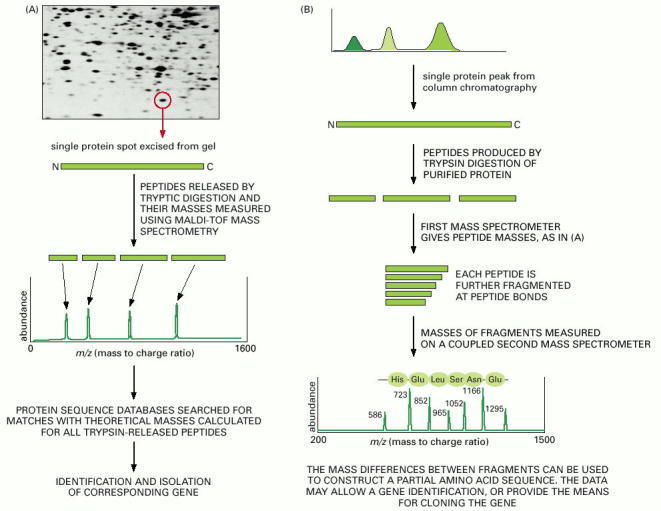
(A) Mass spectrometry can be used to identify proteins by determining their precise masses, and the masses of peptides derived from them, and using that information to search a genomic database for the corresponding gene. In this example, the protein of interest is excised from a two-dimensional polyacrylamide gel and then digested with trypsin. The peptide fragments are loaded into the mass spectrometer and their masses are measured. Sequence databases are then searched to find the gene that encodes a protein whose calculated tryptic digest profile matches these values. (B) Mass spectrometry can also be used to determine directly the amino acid sequence of peptide fragments. In this example, proteins that form a macromolecular complex have been separated by chromatography, and a single protein selected for digestion with trypsin. The masses of these tryptic fragments are then determined by mass spectrometry as in (A). To determine their exact amino acid sequence, each peptide is further fragmented, primarily by cleaving its peptide bonds. This treatment generates a nested set of peptides, each differing in size by one amino acid. These fragments are fed into a second coupled mass spectrometer and their masses are determined. The difference in masses between two closely related peptides can be used to deduce the “missing” amino acid. By repeated applications of this procedure, a partial amino acid sequence of the original protein can be determined. (Micrograph courtesy of Patrick O'Farrell.)
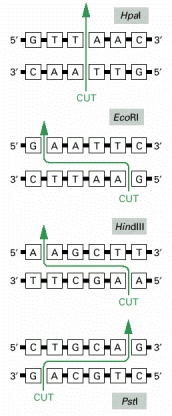
As in the examples shown, such sequences are often six base pairs long and “palindromic” (that is, the nucleotide sequence is the same if the helix is turned by 180 degrees around the center of the short region of helix that is recognized). The enzymes cut the two strands of DNA at or near the recognition sequence. For some enzymes, such as HpaI, the cleavage leaves blunt ends; for others, such as EcoRI, HindIII, and PstI, the cleavage is staggered and creates cohesive ends. Restriction nucleases are obtained from various species of bacteria: HpaI is from Hemophilus parainfluenzae, EcoRI is from Escherichia coli, HindIII is from Hemophilus influenzae, and PstI is from Providencia stuartii.
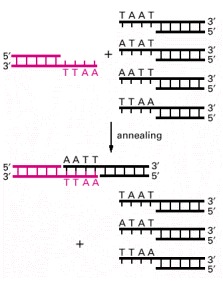
Fragments with the same cohesive ends can readily join by complementary base-pairing between their cohesive ends, as illustrated. The two DNA fragments that join in this example were both produced by the EcoRI restriction nuclease, whereas the three other fragments were produced by different restriction nucleases that generated different cohesive ends (see Figure 8-21). Blunt-ended fragments, like those generated by HpaI (see Figure 8-21), can be spliced together with more difficulty.
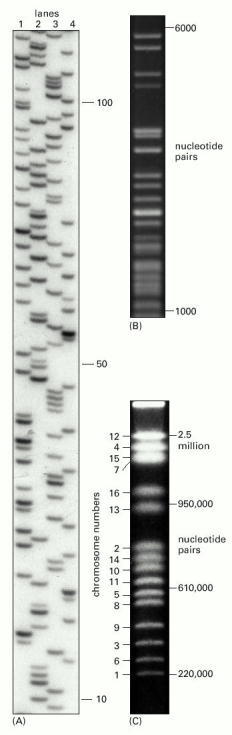
In the three examples shown, electrophoresis is from top to bottom, so that the largest—and thus slowest-moving—DNA molecules are near the top of the gel. In (A) a polyacrylamide gel with small pores is used to fractionate single-stranded DNA. In the size range 10 to 500 nucleotides, DNA molecules that differ in size by only a single nucleotide can be separated from each other. In the example, the four lanes represent sets of DNA molecules synthesized in the course of a DNA-sequencing procedure. The DNA to be sequenced has been artificially replicated from a fixed start site up to a variable stopping point, producing a set of partial replicas of differing lengths. (Figure 8-36 explains how such sets of partial replicas are synthesized.) Lane 1 shows all the partial replicas that terminate in a G, lane 2 all those that terminate in an A, lane 3 all those that terminate in a T, and lane 4 all those that terminate in a C. Since the DNA molecules used in these reactions are radiolabeled, their positions can be determined by autoradiography, as shown. In (B) an agarose gel with medium-sized pores is used to separate double-stranded DNA molecules. This method is most useful in the size range 300 to 10,000 nucleotide pairs. These DNA molecules are fragments produced by cleaving the genome of a bacterial virus with a restriction nuclease, and they have been detected by their fluorescence when stained with the dye ethidium bromide. In (C) the technique of pulsed-field agarose gel electrophoresis has been used to separate 16 different yeast (Saccharomyces cerevisiae) chromosomes, which range in size from 220,000 to 2.5 million nucleotide pairs (see Figure 4-13). The DNA was stained as in (B). DNA molecules as large as 107 nucleotide pairs can be separated in this way. (A, courtesy of Leander Lauffer and Peter Walter; B, courtesy of Ken Kreuzer; C, from D. Vollrath and R.W. Davis, Nucleic Acids Res. 15:7865–7876, 1987. © Oxford University Press.)
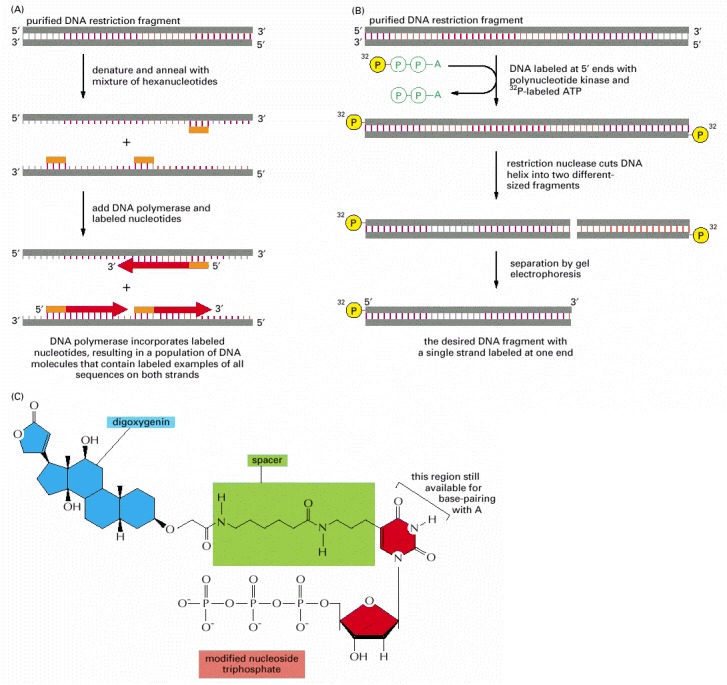
(A) A purified DNA polymerase enzyme labels all the nucleotides in a DNA molecule and can thereby produce highly radioactive DNA probes. (B) Polynucleotide kinase labels only the 5′ ends of DNA strands; therefore, when labeling is followed by restriction nuclease cleavage, as shown, DNA molecules containing a single 5′-end-labeled strand can be readily obtained. (C) The method in (A) is also used to produce nonradioactive DNA molecules that carry a specific chemical marker that can be detected with an appropriate antibody. The modified nucleotide shown can be incorporated into DNA by DNA polymerase so as to allow the DNA molecule to serve as a probe that can be readily detected. The base on the nucleoside triphosphate shown is an analog of thymine in which the methyl group on T has been replaced by a spacer arm linked to the plant steroid digoxigenin. To visualize the probe, the digoxigenin is detected by a specific antibody coupled to a visible marker such as a fluorescent dye. Other chemical labels such as biotin can be attached to nucleotides and used in essentially the same way.
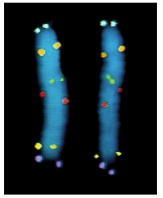
Here, six different DNA probes have been used to mark the location of their respective nucleotide sequences on human chromosome 5 at metaphase. The probes have been chemically labeled and detected with fluorescent antibodies. Both copies of chromosome 5 are shown, aligned side by side. Each probe produces two dots on each chromosome, since a metaphase chromosome has replicated its DNA and therefore contains two identical DNA helices. (Courtesy of David C. Ward.)
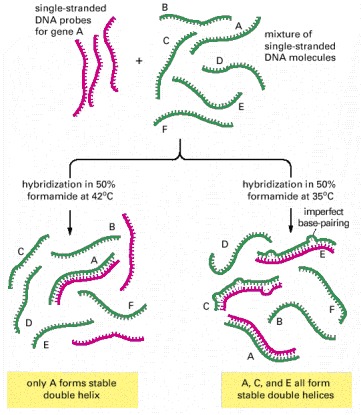
When only an identical match with a DNA probe is desired, the hybridization reaction is kept just a few degrees below the temperature at which a perfect DNA helix denatures in the solvent used (its melting temperature), so that all imperfect helices formed are unstable. When a DNA probe is being used to find DNAs that are related, but not identical, in sequence, hybridization is performed at a lower temperature. This allows even imperfectly paired double helices to form. Only the lower-temperature hybridization conditions can be used to search for genes (C and E in this example) that are nonidentical but related to gene A (see Figure 10-18).
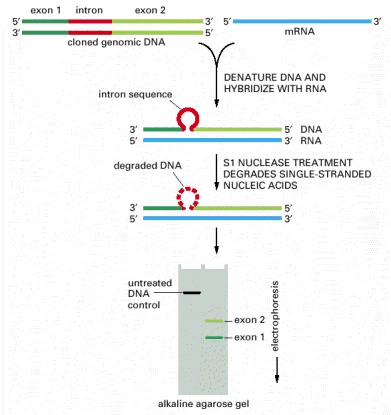
The method shown requires a nuclease that cuts the DNA chain only where it is not base-paired to a complementary RNA chain. The positions of the introns in eucaryotic genes are mapped by the method shown; the beginning and the end of an RNA molecule can be determined in the same way. For this type of analysis the DNA is electrophoresed through a denaturing agarose gel, which causes it to migrate as single-stranded molecules.
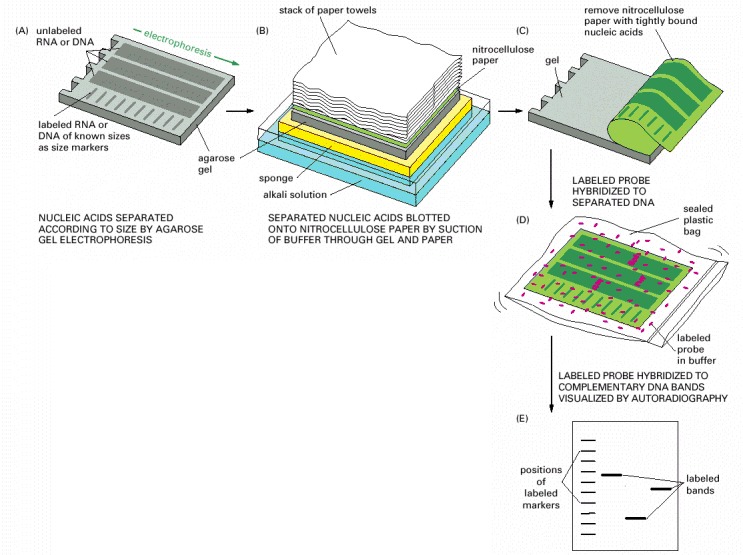
In this example, the DNA probe is detected by its radioactivity. DNA probes detected by chemical or fluorescence methods are also widely used (see Figure 8-24). (A) A mixture of either single-stranded RNA molecules (Northern blotting) or the double-stranded DNA molecules created by restriction nuclease treatment (Southern blotting) is separated according to length by electrophoresis. (B) A sheet of either nitrocellulose paper or nylon paper is laid over the gel, and the separated RNA or DNA fragments are transferred to the sheet by blotting. (C) The nitrocellulose sheet is carefully peeled off the gel. (D) The sheet containing the bound nucleic acids is placed in a sealed plastic bag together with a buffered salt solution containing a radioactively labeled DNA probe. The paper sheet is exposed to a labeled DNA probe for a prolonged period under conditions favoring hybridization. (E) The sheet is removed from the bag and washed thoroughly, so that only probe molecules that have hybridized to the RNA or DNA immobilized on the paper remain attached. After autoradiography, the DNA that has hybridized to the labeled probe shows up as bands on the autoradiograph. For Southern blotting, the strands of the double-stranded DNA molecules on the paper must be separated before the hybridization process; this is done by exposing the DNA to alkaline denaturing conditions after the gel has been run (not shown).
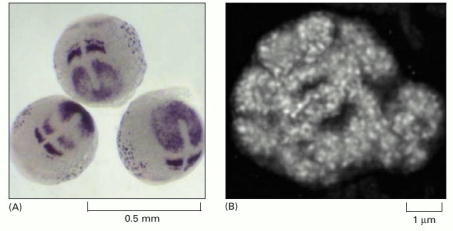
(A) Expression pattern of deltaC in the early zebrafish embryo. This gene codes for a ligand in the Notch signaling pathway (discussed in Chapter 15), and the pattern shown here reflects its role in the development of somites—the future segments of the vertebrate trunk and tail. (B) High-resolution RNA in situ localization reveals the sites within the nucleolus of a pea cell where ribosomal RNA is synthesized. The sausage-like structures, 0.5–1 μm in diameter, correspond to the loops of chromosomal DNA that contain the genes encoding rRNA. Each small, white spot represents transcription of a single rRNA gene. (A, courtesy of Yun-Jin Jiang; B, courtesy of Peter Shaw.)
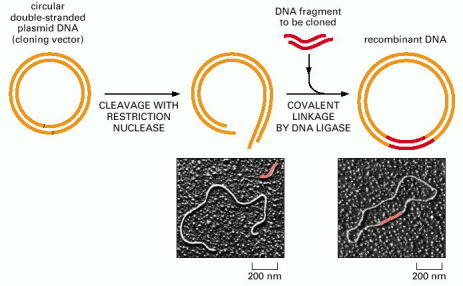
The plasmid is cut open with a restriction nuclease (in this case one that produces cohesive ends) and is mixed with the DNA fragment to be cloned (which has been prepared with the same restriction nuclease), DNA ligase, and ATP. The cohesive ends base-pair, and DNA ligase seals the nicks in the DNA backbone, producing a complete recombinant DNA molecule. (Micrographs courtesy of Huntington Potter and David Dressler.)
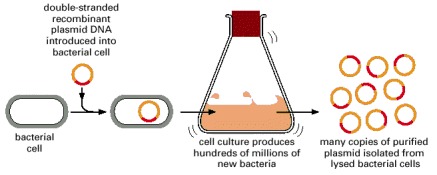
To produce many copies of a particular DNA sequence, the fragment is first inserted into a plasmid vector, as shown in Figure 8-30. The resulting recombinant plasmid DNA is then introduced into a bacterium, where it can be replicated many millions of times as the bacterium multiplies.
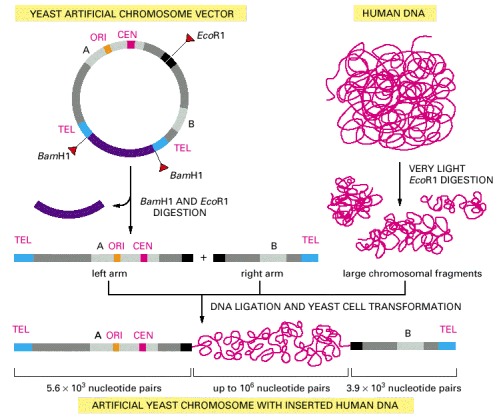
A YAC vector allows the cloning of very large DNA molecules. TEL, CEN, and ORI are the telomere, centromere, and origin of replication sequences, respectively, for the yeast Saccharomyces cerevisiae. BamH1 and EcoR1 are sites where the corresponding restriction nucleases cut the DNA double helix. The sequences denoted A and B encode enzymes that serve as selectable markers to allow the easy isolation of yeast cells that have taken up the artificial chromosome. (Adapted from D.T. Burke, G.F. Carle, and M.V. Olson, Science 236:806–812, 1987.)

A genomic library is usually stored as a set of bacteria, each carrying a different fragment of human DNA. For simplicity, cloning of just a few representative fragments (colored) is shown. In reality, all of the gray DNA fragments would also be cloned.
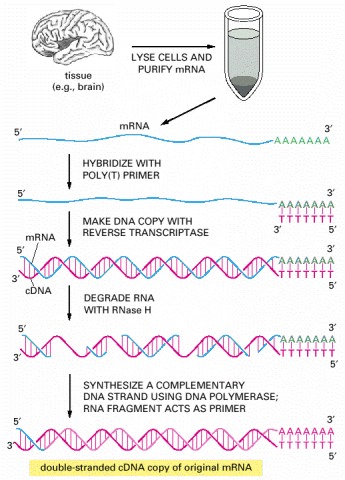
Total mRNA is extracted from a particular tissue, and DNA copies (cDNA) of the mRNA molecules are produced by the enzyme reverse transcriptase (see p. 289). For simplicity, the copying of just one of these mRNAs into cDNA is illustrated. A short oligonucleotide complementary to the poly-A tail at the 3′ end of the mRNA (discussed in Chapter 6) is first hybridized to the RNA to act as a primer for the reverse transcriptase, which then copies the RNA into a complementary DNA chain, thereby forming a DNA/RNA hybrid helix. Treating the DNA/RNA hybrid with RNase H (see Figure 5-13) creates nicks and gaps in the RNA strand. The remaining single-stranded cDNA is then copied into double-stranded cDNA by the enzyme DNA polymerase. The primer for this synthesis reaction is provided by a fragment of the original mRNA, as shown. Because the DNA polymerase used to synthesize the second DNA strand can synthesize through the bound RNA molecules, the RNA fragment that is base-paired to the 3′ end of the first DNA strand usually acts as the primer for the final product of the second strand synthesis. This RNA is eventually degraded during subsequent cloning steps. As a result, the nucleotide sequences at the extreme 5′ ends of the original mRNA molecules are often absent from cDNA libraries.
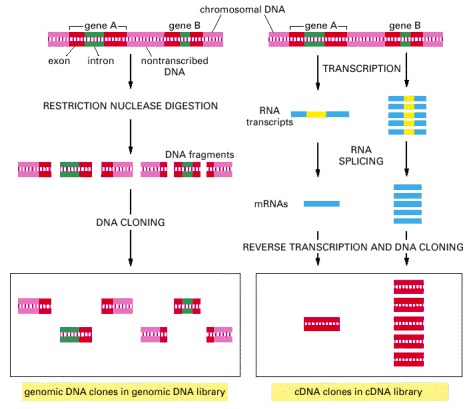
In this example gene A is infrequently transcribed, whereas gene B is frequently transcribed, and both genes contain introns (green). In the genomic DNA library, both the introns and the nontranscribed DNA (pink) are included in the clones, and most clones contain, at most, only part of the coding sequence of a gene (red). In the cDNA clones the intron sequences (yellow) have been removed by RNA splicing during the formation of the mRNA (blue), and a continuous coding sequence is therefore present in each clone. Because gene B is transcribed more abundantly than in gene A in the cells from which the cDNA library was made, it is represented much more frequently than A in the cDNA library. In contrast, A and B are in principle represented equally in the genomic DNA library.
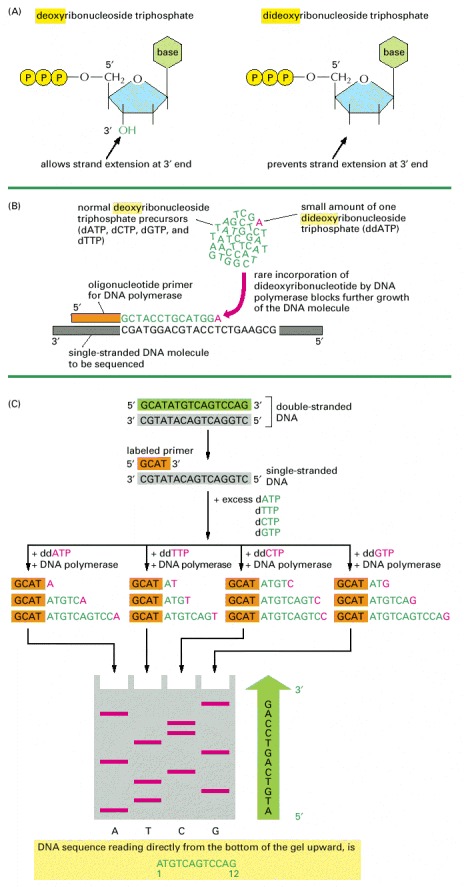
(A) This method relies on the use of dideoxyribonucleoside triphosphates, derivatives of the normal deoxyribonucleoside triphosphates that lack the 3′ hydroxyl group. (B) Purified DNA is synthesized in vitro in a mixture that contains single-stranded molecules of the DNA to be sequenced (gray), the enzyme DNA polymerase, a short primer DNA (orange) to enable the polymerase to start DNA synthesis, and the four deoxyribonucleoside triphosphates (dATP, dCTP, dGTP, dTTP: green A, C, G, and T). If a dideoxyribonucleotide analog (red) of one of these nucleotides is also present in the nucleotide mixture, it can become incorporated into a growing DNA chain. Because this chain now lacks a 3′ OH group, the addition of the next nucleotide is blocked, and the DNA chain terminates at that point. In the example illustrated, a small amount of dideoxyATP (ddATP, symbolized here as a red A) has been included in the nucleotide mixture. It competes with an excess of the normal deoxyATP (dATP, green A), so that ddATP is occasionally incorporated, at random, into a growing DNA strand. This reaction mixture will eventually produce a set of DNAs of different lengths complementary to the template DNA that is being sequenced and terminating at each of the different A's. The exact lengths of the DNA synthesis products can then be used to determine the position of each A in the growing chain. (C) To determine the complete sequence of a DNA fragment, the double-stranded DNA is first separated into its single strands and one of the strands is used as the template for sequencing. Four different chain-terminating dideoxyribonucleoside triphosphates (ddATP, ddCTP, ddGTP, ddTTP, again shown in red) are used in four separate DNA synthesis reactions on copies of the same single-stranded DNA template (gray). Each reaction produces a set of DNA copies that terminate at different points in the sequence. The products of these four reactions are separated by electrophoresis in four parallel lanes of a polyacrylamide gel (labeled here A, T, C, and G). The newly synthesized fragments are detected by a label (either radioactive or fluorescent) that has been incorporated either into the primer or into one of the deoxyribonucleoside triphosphates used to extend the DNA chain. In each lane, the bands represent fragments that have terminated at a given nucleotide (e.g., A in the leftmost lane) but at different positions in the DNA. By reading off the bands in order, starting at the bottom of the gel and working across all lanes, the DNA sequence of the newly synthesized strand can be determined. The sequence is given in the green arrow to the right of the gel. This sequence is identical to that of the 5′ → 3′ strand (green) of the original double-stranded DNA molecule.
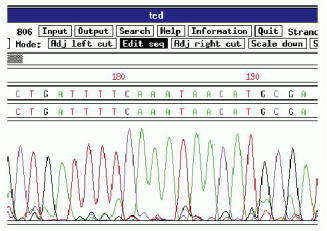
Shown here is a tiny part of the data from an automated DNA-sequencing run as it appears on the computer screen. Each colored peak represents a nucleotide in the DNA sequence—a clear stretch of nucleotide sequence can be read here between positions 173 and 194 from the start of the sequence. This particular example is taken from the international project that determined the complete nucleotide sequence of the genome of the plant Arabidopsis. (Courtesy of George Murphy.)
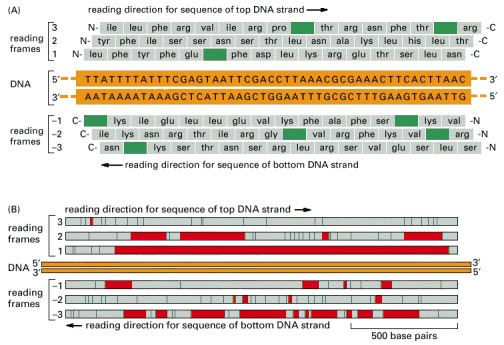
(A) Any region of the DNA sequence can, in principle, code for six different amino acid sequences, because any one of three different reading frames can be used to interpret the nucleotide sequence on each strand. Note that a nucleotide sequence is always read in the 5′-to-3′ chain direction and encodes a polypeptide from the amino (N) to the carboxyl (C) terminus. For a random nucleotide sequence read in a particular frame, a stop signal for protein synthesis is encountered, on average, about once every 21 amino acids (once every 63 nucleotides). In this sample sequence of 48 base pairs, each such signal (stop codon) is colored green, and only reading frame 2 lacks a stop signal. (B) Search of a 1700 base-pair DNA sequence for a possible protein-encoding sequence. The information is displayed as in (A), with each stop signal for protein synthesis denoted by a green line. In addition, all of the regions between possible start and stop signals for protein synthesis (see pp. 348–350) are displayed as red bars. Only reading frame 1 actually encodes a protein, which is 475 amino acid residues long.
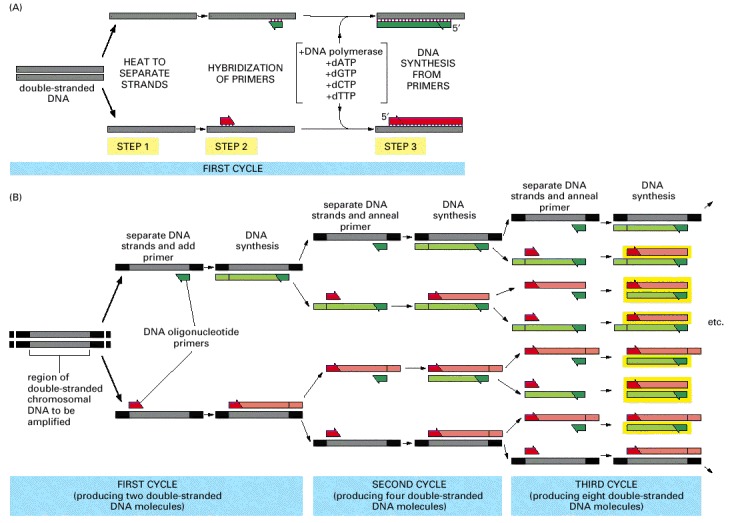
Knowledge of the DNA sequence to be amplified is used to design two synthetic DNA oligonucleotides, each complementary to the sequence on one strand of the DNA double helix at opposite ends of the region to be amplified. These oligonucleotides serve as primers for in vitro DNA synthesis, which is performed by a DNA polymerase, and they determine the segment of the DNA that is amplified. (A) PCR starts with a double-stranded DNA, and each cycle of the reaction begins with a brief heat treatment to separate the two strands (step 1). After strand separation, cooling of the DNA in the presence of a large excess of the two primer DNA oligonucleotides allows these primers to hybridize to complementary sequences in the two DNA strands (step 2). This mixture is then incubated with DNA polymerase and the four deoxyribonucleoside triphosphates so that DNA is synthesized, starting from the two primers (step 3). The entire cycle is then begun again by a heat treatment to separate the newly synthesized DNA strands. (B) As the procedure is performed over and over again, the newly synthesized fragments serve as templates in their turn, and within a few cycles the predominant DNA is identical to the sequence bracketed by and including the two primers in the original template. Of the DNA put into the original reaction, only the sequence bracketed by the two primers is amplified because there are no primers attached anywhere else. In the example illustrated in (B), three cycles of reaction produce 16 DNA chains, 8 of which (boxed in yellow) are the same length as and correspond exactly to one or the other strand of the original bracketed sequence shown at the far left; the other strands contain extra DNA downstream of the original sequence, which is replicated in the first few cycles. After three more cycles, 240 of the 256 DNA chains correspond exactly to the original bracketed sequence, and after several more cycles, essentially all of the DNA strands have this unique length.
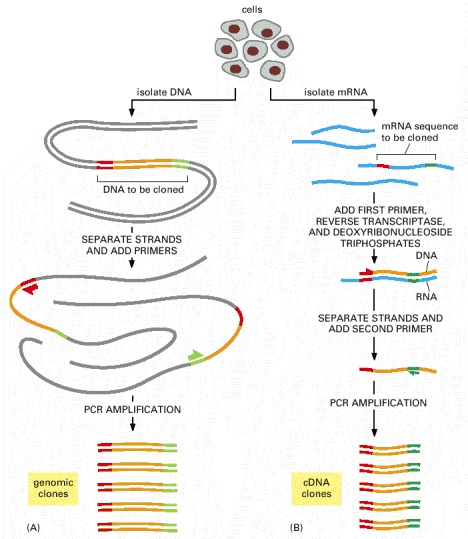
(A) To obtain a genomic clone by using PCR, chromosomal DNA is first purified from cells. PCR primers that flank the stretch of DNA to be cloned are added, and many cycles of the reaction are completed (see Figure 8-39). Since only the DNA between (and including) the primers is amplified, PCR provides a way to obtain a short stretch of chromosomal DNA selectively in a pure form. (B) To use PCR to obtain a cDNA clone of a gene, mRNA is first purified from cells. The first primer is then added to the population of mRNAs, and reverse transcriptase is used to make a complementary DNA strand. The second primer is then added, and the single-stranded DNA molecule is amplified through many cycles of PCR, as shown in Figure 8-39. For both types of cloning, the nucleotide sequence of at least part of the region to be cloned must be known beforehand.
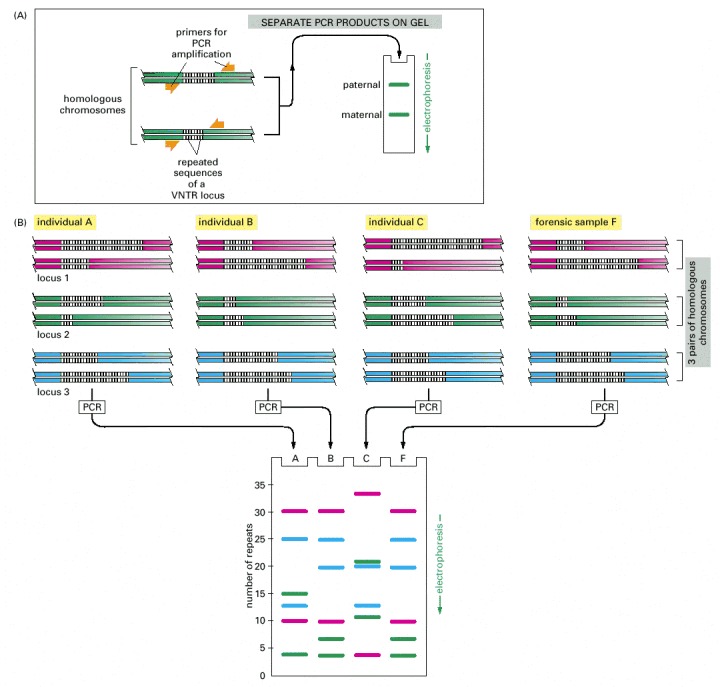
(A) The DNA sequences that create the variability used in this analysis contain runs of short, repeated sequences, such as CACACA . . . , which are found in various positions (loci) in the human genome. The number of repeats in each run can be highly variable in the population, ranging from 4 to 40 in different individuals. A run of repeated nucleotides of this type is commonly referred to as a hypervariable microsatellite sequence—also known as a VNTR (variable number of tandem repeat) sequence. Because of the variability in these sequences at each locus, individuals usually inherit a different variant from their mother and from their father; two unrelated individuals therefore do not usually contain the same pair of sequences. A PCR analysis using primers that bracket the locus produces a pair of bands of amplified DNA from each individual, one band representing the maternal variant and the other representing the paternal variant. The length of the amplified DNA, and thus the position of the band it produces after electrophoresis, depends on the exact number of repeats at the locus. (B) In the schematic example shown here, the same three VNTR loci are analyzed (requiring three different pairs of specially selected oligonucleotide primers) from three suspects (individuals A, B, and C), producing six DNA bands for each person after polyacrylamide gel electrophoresis. Although some individuals have several bands in common, the overall pattern is quite distinctive for each. The band pattern can therefore serve as a “fingerprint” to identify an individual nearly uniquely. The fourth lane (F) contains the products of the same reactions carried out on a forensic sample. The starting material for such a PCR can be a single hair or a tiny sample of blood that was left at the crime scene. When examining the variability at 5 to 10 different VNTR loci, the odds that two random individuals would share the same genetic pattern by chance can be approximately one in 10 billion. In the case shown here, individuals A and C can be eliminated from further enquiries, whereas individual B remains a clear suspect for committing the crime. A similar approach is now routinely used for paternity testing.
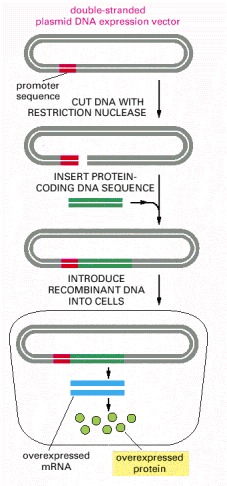
A plasmid vector has been engineered to contain a highly active promoter, which causes unusually large amounts of mRNA to be produced from an adjacent protein-coding gene inserted into the plasmid vector. Depending on the characteristics of the cloning vector, the plasmid is introduced into bacterial, yeast, insect, or mammalian cells, where the inserted gene is efficiently transcribed and translated into protein.
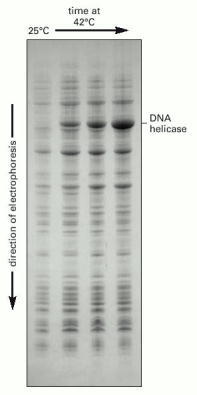
In this example, bacterial cells have been transfected with the coding sequence for an enzyme, DNA helicase; transcription from this coding sequence is under the control of a viral promoter that becomes active only at temperatures of 37°C or higher. The total cell protein has been analyzed by SDS-polyacrylamide gel electrophoresis, either from bacteria grown at 25°C (no helicase protein made), or after a shift of the same bacteria to 42°C for up to 2 hours (helicase protein has become the most abundant protein species in the lysate). (Courtesy of Jack Barry.)
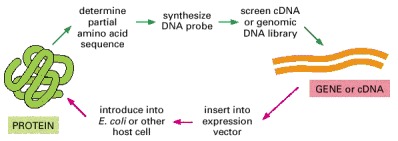
A small quantity of a purified protein is used to obtain a partial amino acid sequence. This provides sequence information that enables the corresponding gene to be cloned from a DNA library. Once the gene has been cloned, its protein-coding sequence can be inserted into an expression vector and used to produce large quantities of the protein from genetically engineered cells.
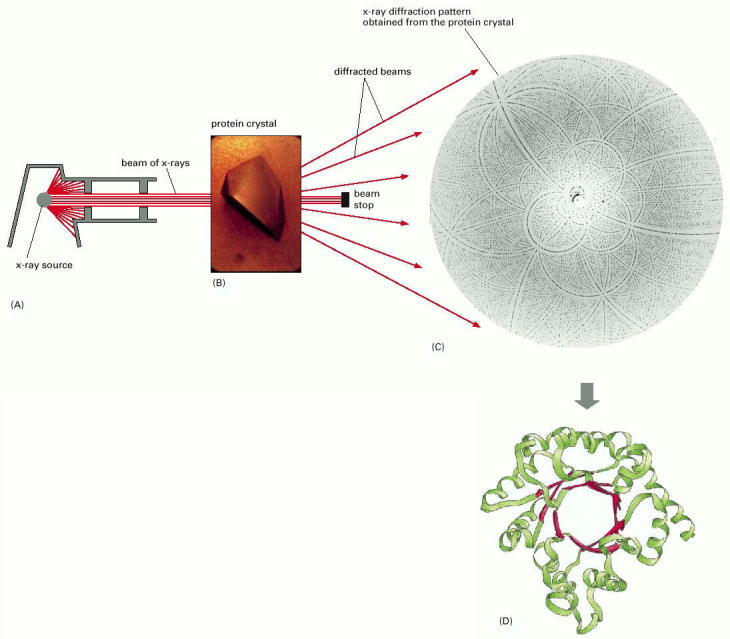
(A) A narrow parallel beam of x-rays is directed at a well-ordered crystal (B). Shown here is a protein crystal of ribulose bisphosphate carboxylase, an enzyme with a central role in CO2 fixation during photosynthesis. Some of the beam is scattered by the atoms in the crystal. The scattered waves reinforce one another at certain points and appear as a pattern of diffraction spots (C). This diffraction pattern, together with the amino acid sequence of the protein, can be used to produce an atomic model (D). The complete atomic model is hard to interpret, but this simplified version, derived from the x-ray diffraction data, shows the protein's structural features clearly (α helices, green; β strands, red). Note that the components pictured in A to D are not shown to scale. (B, courtesy of C. Branden; C, courtesy of J. Hajdu and I. Andersson; D, adapted from original provided by B. Furugren.)
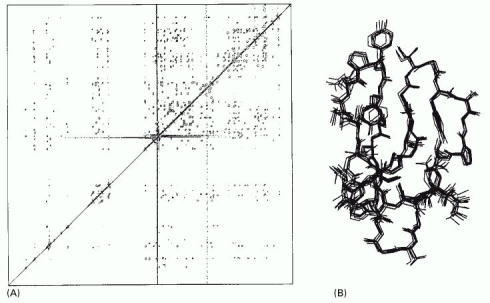
(A) An example of the data from an NMR machine. This two-dimensional NMR spectrum is derived from the C-terminal domain of the enzyme cellulase. The spots represent interactions between hydrogen atoms that are near neighbors in the protein and hence reflects the distance that separates them. Complex computing methods, in conjunction with the known amino acid sequence, enable possible compatible structures to be derived. In (B) 10 structures, which all satisfy the distance constraints equally well, are shown superimposed on one another, giving a good indication of the probable three-dimensional structure. (Courtesy of P. Kraulis.)
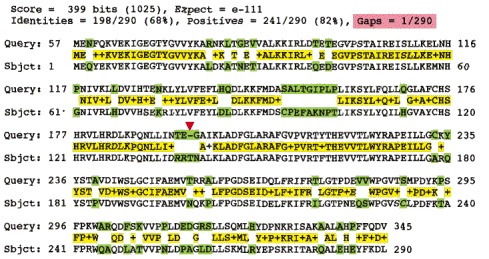
Sequence databases can be searched to find similar amino acid or nucleic acid sequences. Here a search for proteins similar to the human cell-cycle regulatory protein cdc2 (Query) locates maize cdc2 (Subject), which is 68% identical (and 82% similar) to human cdc2 in its amino acid sequence. The alignment begins at residue 57 of the Query protein, suggesting that the human protein has an N-terminal region that is absent from the maize protein. The green blocks indicate differences in sequence, and the yellow bar summarizes the similarities: when the two amino acid sequences are identical, the residue is shown; conservative amino acid substitutions are indicated by a plus sign (+). Only one small gap has been introduced—indicated by the red arrow at position 194 in the Query sequence—to align the two sequences maximally. The alignment score (Score) takes into account penalties for substitution and gaps; the higher the alignment score, the better the match. The significance of the alignment is reflected in the Expectation (E) value, which represents the number of alignments with scores equal to or better than the given score that are expected to occur by chance. The lower the E value, the more significant the match; the extremely low value here indicates certain significance. E values much higher than 0.1 are unlikely to reflect true relatedness.
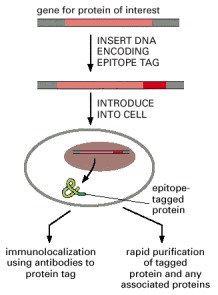
Using standard genetic engineering techniques, a short epitope tag can be added to a protein of interest. The resulting protein contains the protein being analyzed plus a short peptide that can be recognized by commercially available antibodies. The labeled antibody can be used to follow the cellular localization of the protein or to purify it by immunoprecipitation or affinity chromatography.
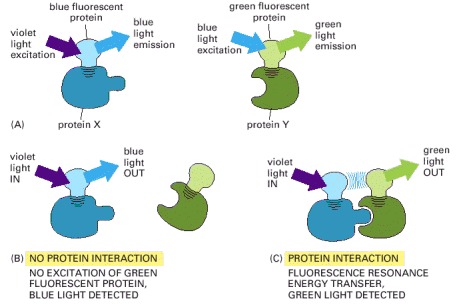
To determine whether (and when) two proteins interact inside the cell, the proteins are first produced as fusion proteins attached to different variants of GFP. (A) In this example, protein X is coupled to a blue fluorescent protein, which is excited by violet light (370–440 nm) and emits blue light (440–480 nm); protein Y is coupled to a green fluorescent protein, which is excited by blue light and emits green light (510 nm). (B) If protein X and Y do not interact, illuminating the sample with violet light yields fluorescence from the blue fluorescent protein only. (C) When protein X and protein Y interact, FRET can now occur. Illuminating the sample with violet light excites the blue fluorescent protein, whose emission in turn excites the green fluorescent protein, resulting in an emission of green light. The fluorochromes must be quite close together—within about 1–10 nm of one another—for FRET to occur. Because not every molecule of protein X and protein Y is bound at all times, some blue light may still be detected. But as the two proteins begin to interact, emission from the donor GFP falls as the emission from the acceptor GFP rises.
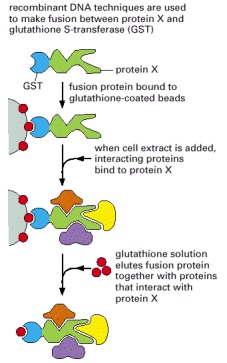
GST fusion proteins, generated by standard recombinant DNA techniques, can be captured on an affinity column containing beads coated with glutathione. To look for proteins that bind to protein X, cell extracts can be passed through this column. The hybrid protein and its binding partners can then be eluted with glutathione. The identities of these interacting proteins can be determined by mass spectrometry (see Figure 8-20). In an alternative approach, a cell extract can be made from a cell producing the GST fusion protein and passed directly through the glutathione affinity column. The GST fusion protein, along with proteins that have associated with it in the cell, are thereby retained. Affinity columns can also be made to contain antibodies against GST or another convenient small protein or epitope tag (see Figure 8-48).
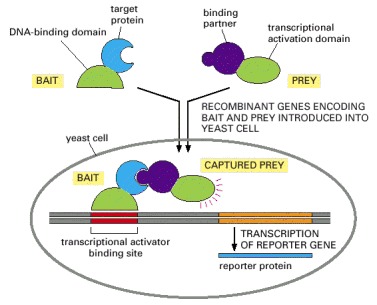
The target protein is fused to a DNA-binding domain that localizes it to the regulatory region of a reporter gene as “bait.” When this target protein binds to another specially designed protein in the cell nucleus (“prey”), their interaction brings together two halves of a transcriptional activator, which then switches on the expression of the reporter gene. The reporter gene is often one that will permit growth on a selective medium. Bait and prey fusion proteins are generated by standard recombinant DNA techniques. In most cases, a single bait protein is used to fish for interacting partners among a large collection of prey proteins produced by ligating DNA encoding the activation domain of a transcriptional activator to a large mixture of DNA fragments from a cDNA library.
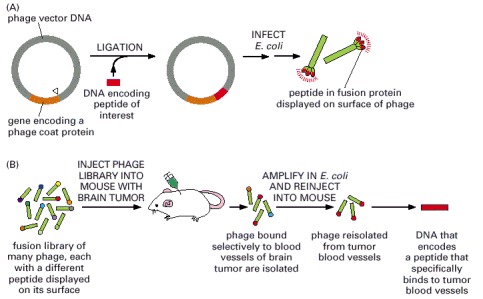
(A) Preparation of the bacteriophage. DNA encoding the desired peptide is ligated into the phage vector, fused with the gene encoding the viral protein coat. The engineered phage are then introduced into E. coli, which produce phage displaying a hybrid coat protein that contains the peptide. (B) Phage libraries containing billions of different peptides can also be generated. In this example, the library is injected into a mouse with a brain tumor and phage that bind selectively to the blood vessels that supply the tumor are isolated and amplified. A peptide that binds specifically to tumor blood vessels can then be isolated from the purified phage. Such a peptide could be used to target drugs or toxins to the tumor.
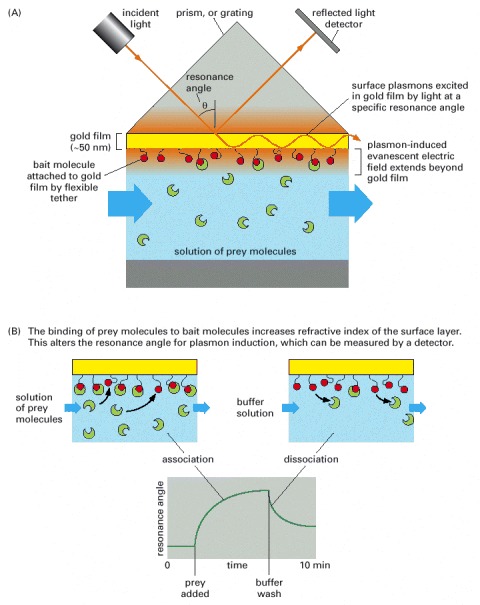
(A) SPR can detect binding interactions by monitoring the reflection of a beam of light off the interface between an aqueous solution of potential binding molecules (green) and a biosensor surface coated with an immobilized bait protein (red). (B) A solution of prey proteins is allowed to flow past the immobilized bait protein. Binding of prey molecules to bait proteins produces a measurable change in the resonance angle. These changes, monitored in real time, reflect the association and dissociation of the molecular complexes.
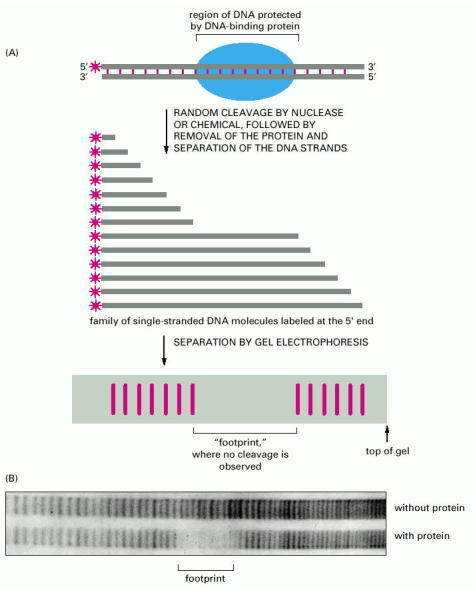
(A) This technique requires a DNA molecule that has been labeled at one end (see Figure 8-24B). The protein shown binds tightly to a specific DNA sequence that is seven nucleotides long, thereby protecting these seven nucleotides from the cleaving agent. If the same reaction were performed without the DNA-binding protein, a complete ladder of bands would be seen on the gel (not shown). (B) An actual footprint used to determine the binding site for a human protein that stimulates the transcription of specific eucaryotic genes. These results locate the binding site about 60 nucleotides upstream from the start site for RNA synthesis. The cleaving agent was a small, iron-containing organic molecule that normally cuts at every phosphodiester bond with nearly equal frequency. (B, courtesy of Michele Sawadogo and Robert Roeder.)
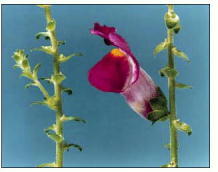
A mutation in a single gene coding for a regulatory protein causes leafy shoots to develop in place of flowers. The mutation allows cells to adopt a character that would be appropriate to a different part of the normal plant. The mutant plant is on the left, the normal plant on the right. (Courtesy of Enrico Coen and Rosemary Carpenter.)
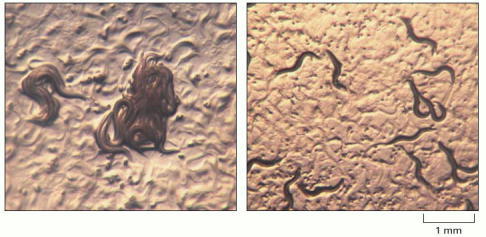
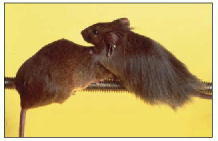
(A) Wild-type C. elegans engage in social feeding. The worms swim around until they encounter their neighbors and commence feeding. (B) Mutant animals feed by themselves. (Courtesy of Cornelia Bargmann, Cell 94:cover, 1998. © Elsevier.)
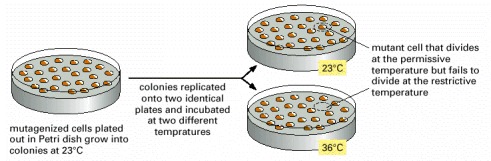
Mutagenized cells are plated out at the permissive temperature. The resulting colonies are transferred to two identical Petri dishes by replica plating; one of these plates is incubated at the permissive temperature, the other at the non-permissive temperature. Cells containing a temperature-sensitive mutation in a gene essential for proliferation can divide at the normal, permissive temperature but fail to divide at the elevated, non-permissive temperature.
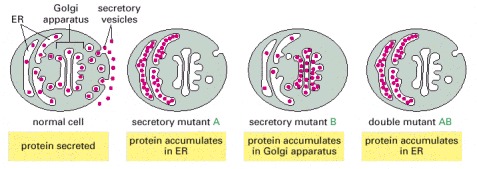
In normal cells, proteins are loaded into vesicles, which fuse with the plasma membrane and secrete their contents into the extracellular medium. In secretory mutant A, proteins accumulate in the ER. In a different secretory mutant B, proteins accumulate in the Golgi. In the double mutant AB, proteins accumulate in the ER; this indicates that the gene defective in mutant A acts before the gene defective in mutant B in the secretory pathway.
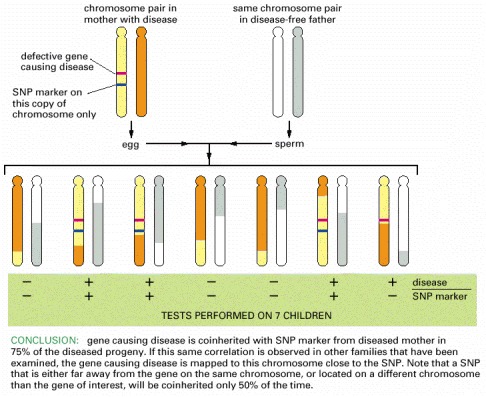
In this example, one studies the coinheritance of a specific human phenotype (here a genetic disease) with a SNP marker. If individuals who inherit the disease nearly always inherit a particular SNP marker, then the gene causing the disease and the SNP are likely to be close together on the chromosome, as shown here. To prove that an observed linkage is statistically significant, hundreds of individuals may need to be examined. Note that the linkage will not be absolute unless the SNP marker is located in the gene itself. Thus, occasionally the SNP will be separated from the disease gene by meiotic crossing-over during the formation of the egg or sperm: this has happened in the case of the chromosome pair on the far right. When working with a sequenced genome, this procedure would be repeated with SNPs located on either side of the initial SNP, until a 100% coinheritance is found.
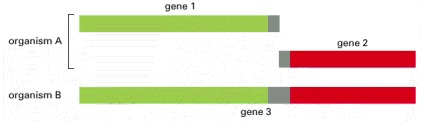
In this example, the functional interaction of genes 1 and 2 in organism A is inferred by the fusion of homologous domains into a single gene (gene 3) in organism B.
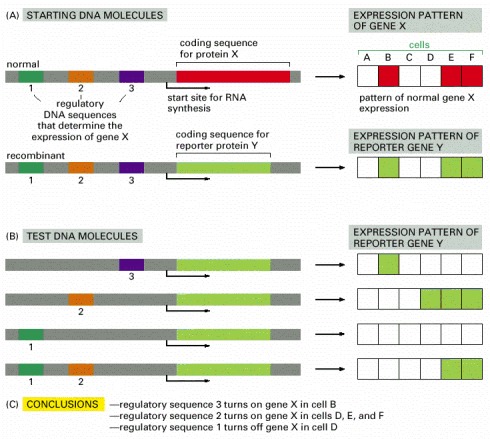
(A) In this example the coding sequence for protein X is replaced by the coding sequence for protein Y. (B) Various fragments of DNA containing candidate regulatory sequences are added in combinations. The recombinant DNA molecules are then tested for expression after their transfection into a variety of different types of mammalian cells, and the results are summarized in (C). For experiments in eucaryotic cells, two commonly used reporter proteins are the enzymes β-galactosidase (β-gal) and green fluorescent protein or GFP (see Figure 9-44). Figure 7-39 shows an example in which the β-gal gene is used to monitor the activity of the eve gene regulatory sequence in a Drosophila embryo.
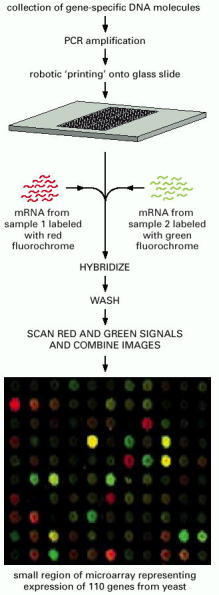
To prepare the microarray, DNA fragments—each corresponding to a gene—are spotted onto a slide by a robot. Prepared arrays are also available commercially. In this example, mRNA is collected from two different cell samples for a direct comparison of their relative levels of gene expression. These samples are converted to cDNA and labeled, one with a red fluorochrome, the other with a green fluorochrome. The labeled samples are mixed and then allowed to hybridize to the microarray. After incubation, the array is washed and the fluorescence scanned. In the portion of a microarray shown, which represents the expression of 110 yeast genes, red spots indicate that the gene in sample 1 is expressed at a higher level than the corresponding gene in sample 2; green spots indicate that expression of the gene is higher in sample 2 than in sample 1. Yellow spots reveal genes that are expressed at equal levels in both cell samples. Dark spots indicate little or no expression in either sample of the gene whose fragment is located at that position in the array. For details see Figure 1-45. (Microarray courtesy of J.L. DeRisi et al., Science 278:680–686, 1997. © AAAS.)
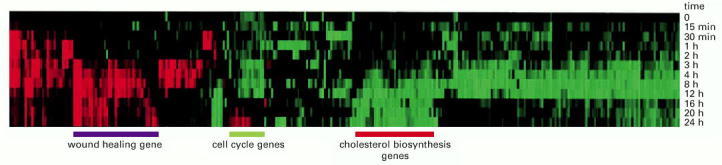
Genes that belong to the same cluster may be involved in common cellular pathways or processes. To perform a cluster analysis, microarray data are obtained from cell samples exposed to a variety of different conditions, and genes that show coordinate changes in their expression pattern are grouped together. In this experiment, human fibroblasts were deprived of serum for 48 hours; serum was then added back to the cultures at time 0 and the cells were harvested for microarray analysis at different time points. Of the 8600 genes analyzed on the DNA microarray, just over 300 showed threefold or greater variation in their expression patterns in response to serum reintroduction. Here, red indicates an increase in expression; green is a decrease in expression. On the basis of the results of many microarray experiments, the 8600 genes have been grouped in clusters based on similar patterns of expression. The results of this analysis show that genes involved in wound healing are turned on in response to serum, while genes involved in regulating cell cycle progression and cholesterol biosynthesis are shut down. (From M.B. Eisen et al., Proc. Natl. Acad. Sci. USA 95:14863–14868, 1998. © National Academy of Sciences.)
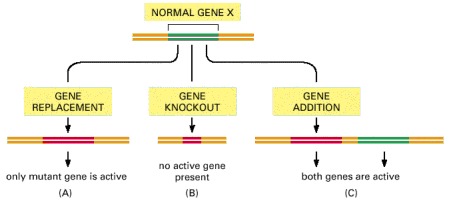
A normal gene can be altered in several ways in a genetically engineered organism. (A) The normal gene (green) can be completely replaced by a mutant copy of the gene (red), a process called gene replacement. This provides information on the activity of the mutant gene without interference from the normal gene, and thus the effects of small and subtle mutations can be determined. (B) The normal gene can be inactivated completely, for example, by making a large deletion in it; the gene is said to have suffered a knockout. (C) A mutant gene can simply be added to the genome. In some organisms this is the easiest type of genetic engineering to perform. This approach can provide useful information when the introduced mutant gene overrides the function of the normal gene.
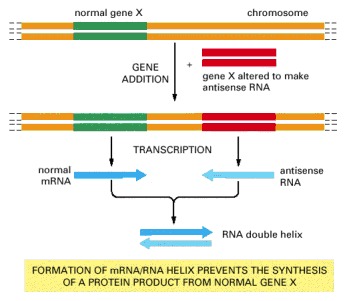
Mutant genes that have been engineered to produce antisense RNA, which is complementary in sequence to the RNA made by the normal gene X, can cause double-stranded RNA to form inside cells. If a large excess of the antisense RNA is produced, it can hybridize with—and thereby inactivate—most of the normal RNA produced by gene X. Although in the future it may become possible to inactivate any gene in this way, at present the technique seems to work for some genes but not others.
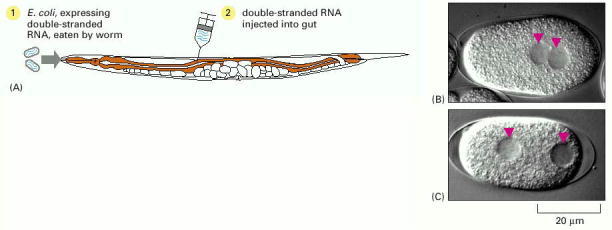
(A) Double-stranded RNA (dsRNA) can be introduced into C. elegans (1) by feeding the worms with E. coli expressing the dsRNA or (2) by injecting dsRNA directly into the gut. (B) Wild-type worm embryo. (C) Worm embryo in which a gene involved in cell division has been inactivated by RNAi. The embryo shows abnormal migration of the two unfused nuclei of the egg and sperm. (B, C, from P. Gönczy et al., Nature 408:331–336, 2000. © Macmillan Magazines Ltd.)
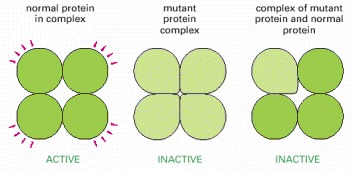
Here a gene is engineered to produce a mutant protein that prevents the normal copies of the same protein from performing their function. In this simple example, the normal protein must form a multisubunit complex to be active, and the mutant protein blocks function by forming a mixed complex that is inactive. In this way a single copy of a mutant gene located anywhere in the genome can inactivate the normal products produced by other gene copies.
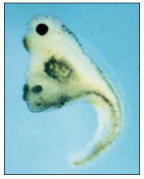
In this experiment, mRNA coding for Wnt was injected into the ventral vegetal blastomere, inducing a second body axis (discussed in Chapter 21). (From S. Sokol et al., Cell 67:741–752, 1992. © Elsevier.)
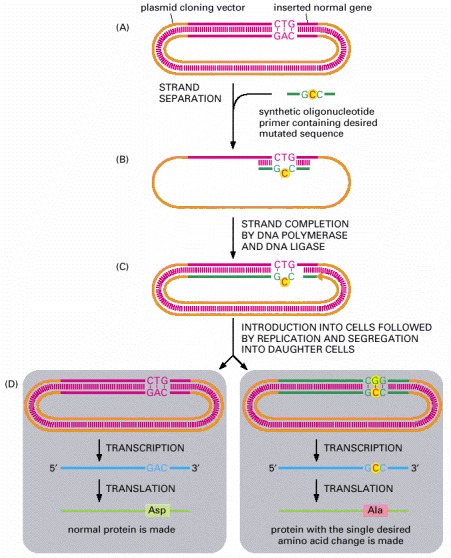
(A) A recombinant plasmid containing a gene insert is separated into its two DNA strands. A synthetic oligonucleotide primer corresponding to part of the gene sequence but containing a single altered nucleotide at a predetermined point is added to the single-stranded DNA under conditions that permit less than perfect DNA hybridization. (B) The primer hybridizes to the DNA, forming a single mismatched nucleotide pair. (C) The recombinant plasmid is made double-stranded by in vitro DNA synthesis starting from the primer and sealed by DNA ligase. (D) The double-stranded DNA is introduced into a cell, where it is replicated. Replication using one strand of the template produces a normal DNA molecule, but replication using the other (the strand that contains the primer) produces a DNA molecule carrying the desired mutation. Only half of the progeny cells will end up with a plasmid that contains the desired mutant gene. However, a progeny cell that contains the mutated gene can be identified, separated from other cells, and cultured to produce a pure population of cells, all of which carry the mutated gene. Only one of the many changes that can be engineered in this way is shown here. With an oligonucleotide of the appropriate sequence, more than one amino acid substitution can be made at a time, or one or more amino acids can be inserted or deleted. Although not shown in this figure, it is also possible to create a site-directed mutation by using the appropriate oligonucleotides and PCR (instead of plasmid replication) to amplify the mutated gene.
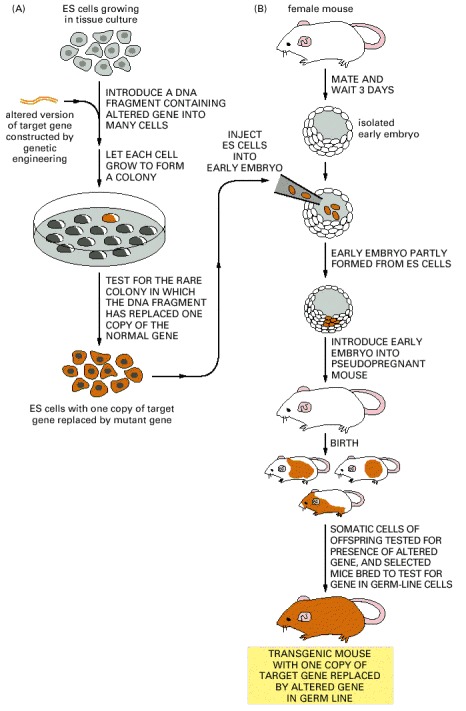
In the first step (A), an altered version of the gene is introduced into cultured ES (embryonic stem) cells. Only a few rare ES cells will have their corresponding normal genes replaced by the altered gene through a homologous recombination event. Although the procedure is often laborious, these rare cells can be identified and cultured to produce many descendants, each of which carries an altered gene in place of one of its two normal corresponding genes. In the next step of the procedure (B), these altered ES cells are injected into a very early mouse embryo; the cells are incorporated into the growing embryo, and a mouse produced by such an embryo will contain some somatic cells (indicated by orange) that carry the altered gene. Some of these mice will also contain germ-line cells that contain the altered gene. When bred with a normal mouse, some of the progeny of these mice will contain the altered gene in all of their cells. If two such mice are in turn bred (not shown), some of the progeny will contain two altered genes (one on each chromosome) in all of their cells.
If the original gene alteration completely inactivates the function of the gene, these mice are known as knockout mice. When such mice are missing genes that function during development, they often die with specific defects long before they reach adulthood. These defects are carefully analyzed to help decipher the normal function of the missing gene.
FGF5 is a negative regulator of hair formation. In a mouse lacking FGF5 (right), the hair is long compared with its heterozygous littermate (left). Transgenic mice with phenotypes that mimic aspects of a variety of human disorders, including Alzheimer's disease, atherosclerosis, diabetes, cystic fibrosis, and some type of cancers, have been generated. Their study may lead to the development of more effective treatments. (Courtesy of Gail Martin, from J.M. Hebert et al., Cell 78:1017–1025, 1994. © Elsevier.)
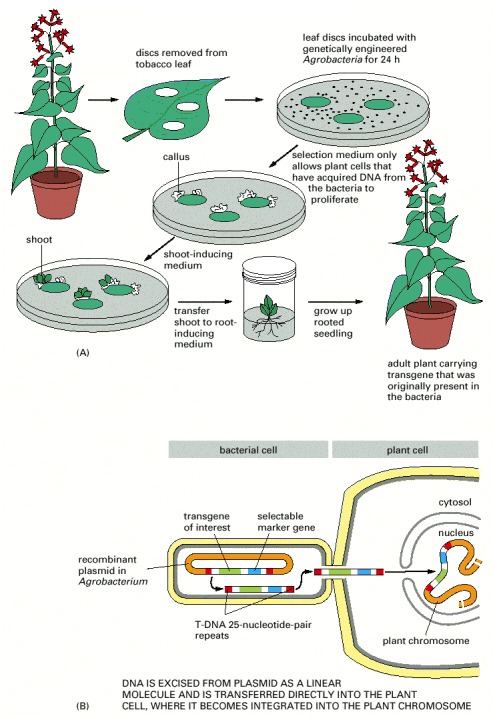
(A) Outline of the process. A disc is cut out of a leaf and incubated in culture with Agrobacteria that carry a recombinant plasmid with both a selectable marker and a desired transgene. The wounded cells at the edge of the disc release substances that attract the Agrobacteria and cause them to inject DNA into these cells. Only those plant cells that take up the appropriate DNA and express the selectable marker gene survive to proliferate and form a callus. The manipulation of growth factors supplied to the callus induces it to form shoots that subsequently root and grow into adult plants carrying the transgene. (B) The preparation of the recombinant plasmid and its transfer to plant cells. An Agrobacterium plasmid that normally carries the T-DNA sequence is modified by substituting a selectable marker (such as the kanamycin-resistance gene) and a desired transgene between the 25-nucleotide-pair T-DNA repeats. When the Agrobacterium recognizes a plant cell, it efficiently passes a DNA strand that carries these sequences into the plant cell, using the special machinery that normally transfers the plasmid's T-DNA sequence.
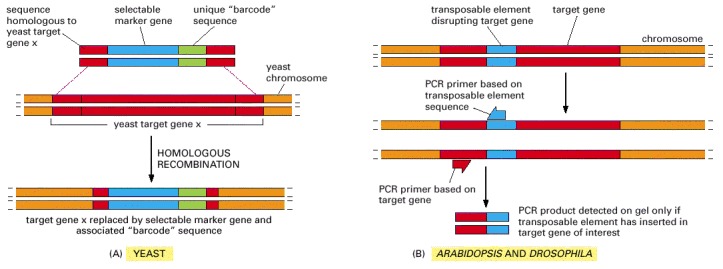
(A) A deletion cassette for use in yeast contains sequences homologous to each end of a target gene x (red), a selectable marker (blue), and a unique “barcode” sequence, approximately 20 nucleotide pairs in length (green). This DNA is introduced into yeast, where it readily replaces the target gene by homologous recombination. (B) A similar approach can be taken to prepare tagged knockout mutants in Arabidopsis and Drosophila. In this case, mutants are generated by the accidental insertion of a transposable element into a target gene. The total DNA from the resulting organism can be collected and quickly screened for disruption of a gene of interest by using PCR primers that bind to the transposable element and to the target gene. A PCR product is detected on the gel only if the transposable element has inserted into the target gene.