Chapter 4 - Figures
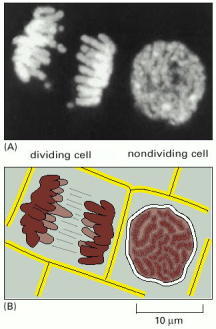
(A) Two adjacent plant cells photographed through a light microscope. The DNA has been stained with a fluorescent dye (DAPI) that binds to it. The DNA is present in chromosomes, which become visible as distinct structures in the light microscope only when they become compact structures in preparation for cell division, as shown on the left. The cell on the right, which is not dividing, contains identical chromosomes, but they cannot be clearly distinguished in the light microscope at this phase in the cell's life cycle, because they are in a more extended conformation. (B) Schematic diagram of the outlines of the two cells along with their chromosomes. (A, courtesy of Peter Shaw.)
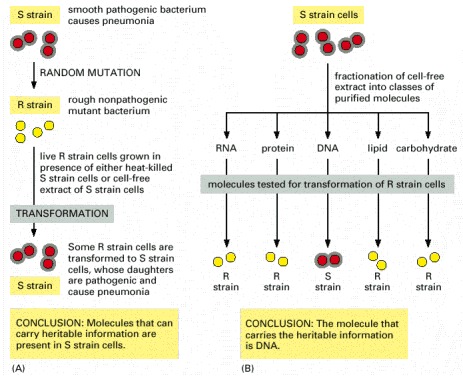
These experiments, carried out in the 1940s, showed that adding purified DNA to a bacterium changed its properties and that this change was faithfully passed on to subsequent generations. Two closely related strains of the bacterium Streptococcus pneumoniae differ from each other in both their appearance under the microscope and their pathogenicity. One strain appears smooth (S) and causes death when injected into mice, and the other appears rough (R) and is nonlethal. (A) This experiment shows that a substance present in the S strain can change (or transform) the R strain into the S strain and that this change is inherited by subsequent generations of bacteria. (B) This experiment, in which the R strain has been incubated with various classes of biological molecules obtained from the S strain, identifies the substance as DNA.
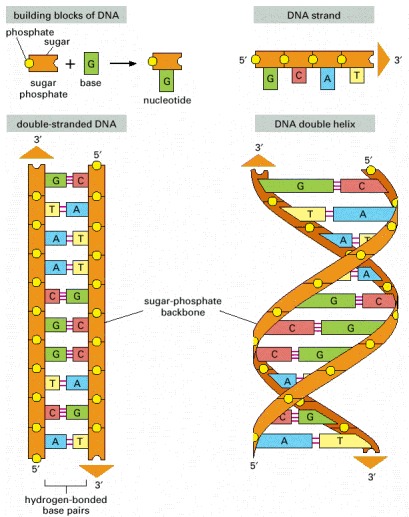
DNA is made of four types of nucleotides, which are linked covalently into a polynucleotide chain (a DNA strand) with a sugar-phosphate backbone from which the bases (A, C, G, and T) extend. A DNA molecule is composed of two DNA strands held together by hydrogen bonds between the paired bases. The arrowheads at the ends of the DNA strands indicate the polarities of the two strands, which run antiparallel to each other in the DNA molecule. In the diagram at the bottom left of the figure, the DNA molecule is shown straightened out; in reality, it is twisted into a double helix, as shown on the right. For details, see Figure 4-5.
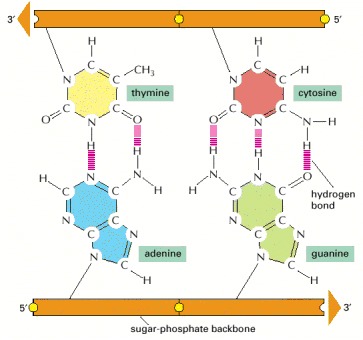
The shapes and chemical structure of the bases allow hydrogen bonds to form efficiently only between A and T and between G and C, where atoms that are able to form hydrogen bonds (see Panel 2-3, pp. 114–115) can be brought close together without distorting the double helix. As indicated, two hydrogen bonds form between A and T, while three form between G and C. The bases can pair in this way only if the two polynucleotide chains that contain them are antiparallel to each other.
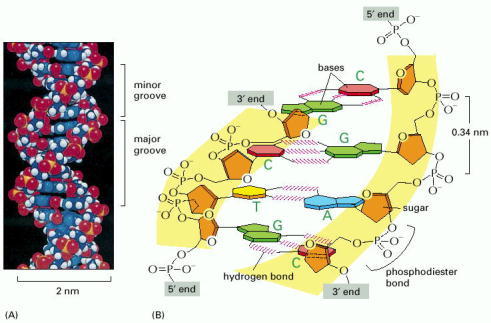
(A) A space-filling model of 1.5 turns of the DNA double helix. Each turn of DNA is made up of 10.4 nucleotide pairs and the center-to-center distance between adjacent nucleotide pairs is 3.4 nm. The coiling of the two strands around each other creates two grooves in the double helix. As indicated in the figure, the wider groove is called the major groove, and the smaller the minor groove. (B) A short section of the double helix viewed from its side, showing four base pairs. The nucleotides are linked together covalently by phosphodiester bonds through the 3′-hydroxyl (-OH) group of one sugar and the 5′-phosphate (P) of the next. Thus, each polynucleotide strand has a chemical polarity; that is, its two ends are chemically different. The 3′ end carries an unlinked -OH group attached to the 3′ position on the sugar ring; the 5′ end carries a free phosphate group attached to the 5′ position on the sugar ring.
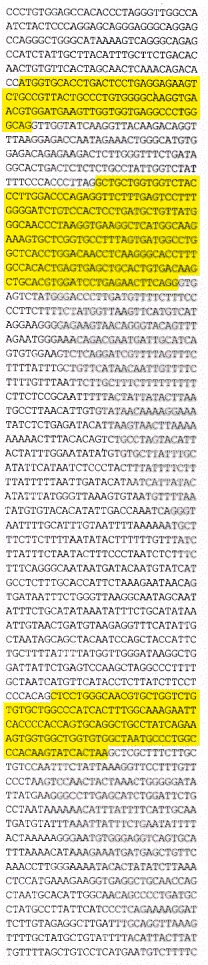
This gene carries the information for the amino acid sequence of one of the two types of subunits of the hemoglobin molecule, which carries oxygen in the blood. A different gene, the α-globin gene, carries the information for the other type of hemoglobin subunit (a hemoglobin molecule has four subunits, two of each type). Only one of the two strands of the DNA double helix containing the β-globin gene is shown; the other strand has the exact complementary sequence. By convention, a nucleotide sequence is written from its 5′ end to its 3′ end, and it should be read from left to right in successive lines down the page as though it were normal English text. The DNA sequences highlighted in yellow show the three regions of the gene that specify the amino sequence for the β-globin protein. We see in Chapter 6 how the cell connects these three sequences together to synthesize a full-length β-globin protein.
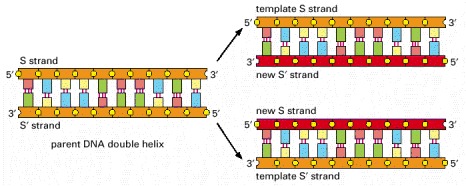
As the nucleotide A successfully pairs only with T, and G with C, each strand of DNA can specify the sequence of nucleotides in its complementary strand. In this way, double-helical DNA can be copied precisely.
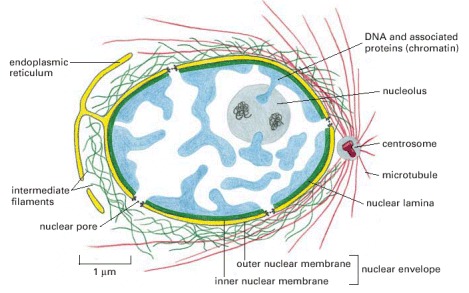
The nuclear envelope consists of two membranes, the outer one being continuous with the endoplasmic reticulum membrane (see also Figure 12-9). The space inside the endoplasmic reticulum (the ER lumen) is colored yellow; it is continuous with the space between the two nuclear membranes. The lipid bilayers of the inner and outer nuclear membranes are connected at each nuclear pore. Two networks of intermediate filaments (green) provide mechanical support for the nuclear envelope; the intermediate filaments inside the nucleus form a special supporting structure called the nuclear lamina.
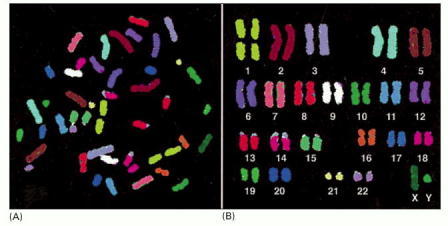
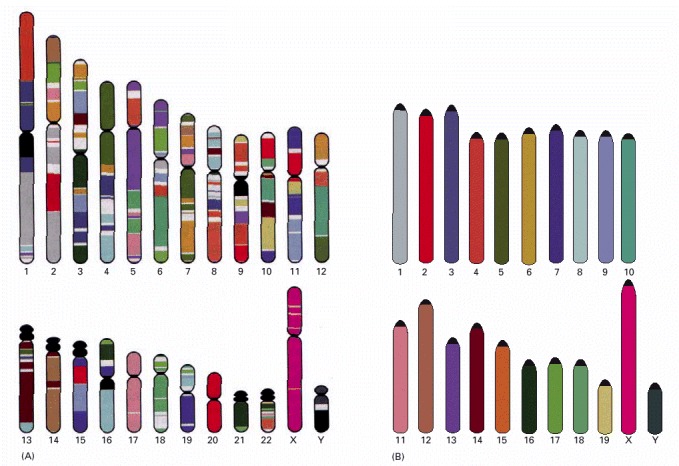
These chromosomes, from a male, were isolated from a cell undergoing nuclear division (mitosis) and are therefore highly compacted. Each chromosome has been “painted” a different color to permit its unambiguous identification under the light microscope. Chromosome painting is performed by exposing the chromosomes to a collection of human DNA molecules that have been coupled to a combination of fluorescent dyes. For example, DNA molecules derived from chromosome 1 are labeled with one specific dye combination, those from chromosome 2 with another, and so on. Because the labeled DNA can form base pairs, or hybridize, only to the chromosome from which it was derived (discussed in Chapter 8), each chromosome is differently labeled. For such experiments, the chromosomes are subjected to treatments that separate the double-helical DNA into individual strands, designed to permit base-pairing with the single-stranded labeled DNA while keeping the chromosome structure relatively intact. (A) The chromosomes visualized as they originally spilled from the lysed cell. (B) The same chromosomes artificially lined up in their numerical order. This arrangement of the full chromosome set is called a karyotype. (From E. Schröck et al., Science 273:494–497, 1996. © AAAS.)
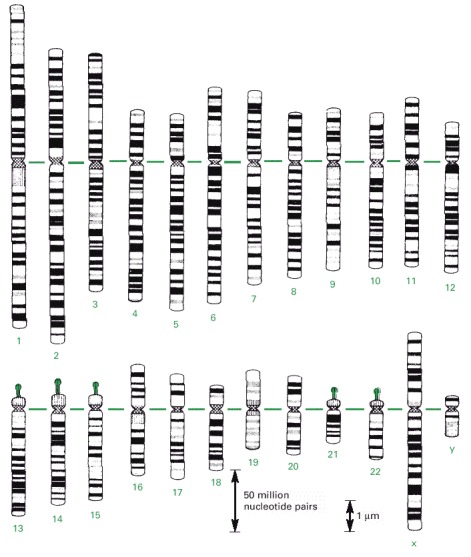
Chromosomes 1–22 are numbered in approximate order of size. A typical human somatic (non-germ line) cell contains two of each of these chromosomes, plus two sex chromosomes—two X chromosomes in a female, one X and one Y chromosome in a male. The chromosomes used to make these maps were stained at an early stage in mitosis, when the chromosomes are incompletely compacted. The horizontal green line represents the position of the centromere (see Figure 4-22), which appears as a constriction on mitotic chromosomes; the knobs on chromosomes 13, 14, 15, 21, and 22 indicate the positions of genes that code for the large ribosomal RNAs (discussed in Chapter 6). These patterns are obtained by staining chromosomes with Giemsa stain, and they can be observed under the light microscope. (Adapted from U. Franke, Cytogenet. Cell Genet. 31:24–32, 1981.)
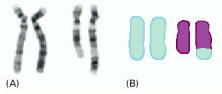
(A) Two pairs of chromosomes, stained with Giemsa (see Figure 4-11), from a patient with ataxia, a disease characterized by progressive deterioration of motor skills. The patient has a normal pair of chromosome 4s (left-hand pair), but one normal chromosome 12 and one aberrant chromosome 12, as seen by its greater length (right-hand pair). The additional material contained on the aberrant chromosome 12 was deduced, from its pattern of bands, as a piece of chromosome 4 that had become attached to chromosome 12 through an abnormal recombination event, called a chromosomal translocation. (B) The same two chromosome pairs, “painted” blue for chromosome 4 DNA and purple for chromosome 12 DNA. The two techniques give rise to the same conclusion regarding the nature of the aberrant chromosome 12, but chromosome painting provides better resolution, and the clear identification of even short pieces of chromosomes that have become translocated. However, Giemsa staining is easier to perform. (From E. Schröck et al., Science 273:494–497, 1996. © AAAS.)
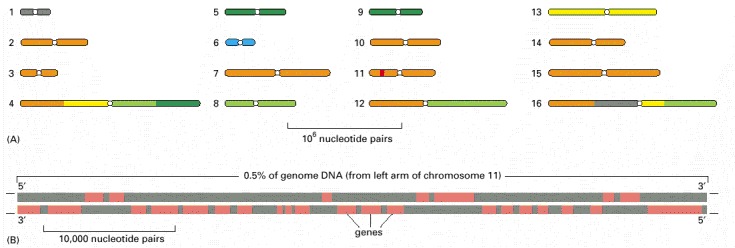
(A) The genome is distributed over 16 chromosomes, and its complete nucleotide sequence was determined by a cooperative effort involving scientists working in many different locations, as indicated (gray, Canada; orange, European Union; yellow, United Kingdom; blue, Japan; light green, St Louis, Missouri; dark green, Stanford, California). The constriction present on each chromosome represents the position of its centromere (see Figure 4-22). (B) A small region of chromosome 11, highlighted in red in part A, is magnified to show the high density of genes characteristic of this species. As indicated by orange, some genes are transcribed from the lower strand (see Figure 1-5), while others are transcribed from the upper strand. There are about 6000 genes in the complete genome, which is 12,147,813 nucleotide pairs long.
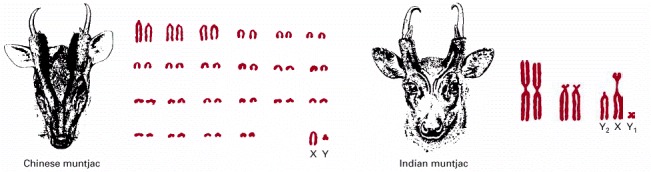
In the evolution of the Indian muntjac, initially separate chromosomes fused, without having a major effect on the animal. These two species have roughly the same number of genes. (Adapted from M.W. Strickberger, Evolution, 3rd edition, 2000, Sudbury, MA: Jones & Bartlett Publishers.)
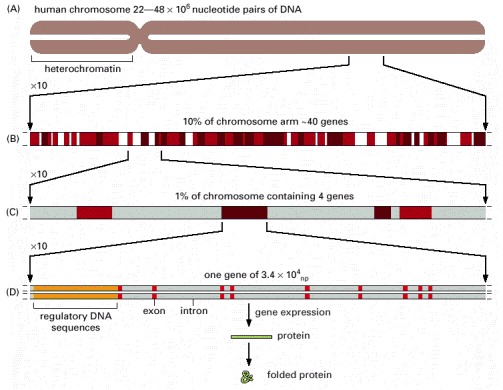
(A) Chromosome 22, one of the smallest human chromosomes, contains 48 × 106 nucleotide pairs and makes up approximately 1.5% of the entire human genome. Most of the left arm of chromosome 22 consists of short repeated sequences of DNA that are packaged in a particularly compact form of chromatin (heterochromatin), which is discussed later in this chapter. (B) A tenfold expansion of a portion of chromosome 22, with about 40 genes indicated. Those in dark brown are known genes and those in light brown are predicted genes. (C) An expanded portion of (B) shows the entire length of several genes. (D) The intron-exon arrangement of a typical gene is shown after a further tenfold expansion. Each exon (red) codes for a portion of the protein, while the DNA sequence of the introns (gray) is relatively unimportant. The entire human genome (3.2 × 10⁹ nucleotide pairs) is distributed over 22 autosomes and 2 sex chromosomes (see Figures 4-10 and 4-11). The term human genome sequence refers to the complete nucleotide sequence of DNA in these 24 chromosomes. Being diploid, a human somatic cell therefore contains roughly twice this amount of DNA. Humans differ from one another by an average of one nucleotide in every thousand, and a wide variety of humans contributed DNA for the genome sequencing project. The published human genome sequence is therefore a composite of many individual sequences. (Adapted from International Human Genome Sequencing Consortium, Nature 409:860–921, 2001.)
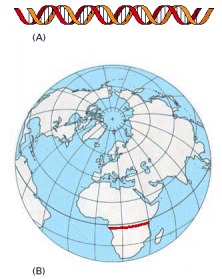
If each nucleotide pair is drawn as 1 mm as in (A), then the human genome would extend 3200 km (approximately 2000 miles), far enough to stretch across the center of Africa, the site of our human origins (red line in B). At this scale, there would be, on average, a protein-coding gene every 300 m. An average gene would extend for 30 m, but the coding sequences in this gene would add up to only just over a meter.
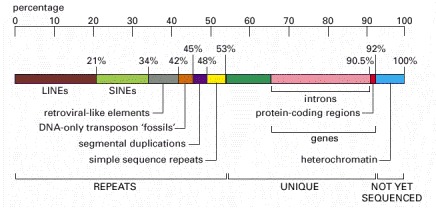
LINES, SINES, retroviral-like elements, and DNA-only transposons are all mobile genetic elements that have multiplied in our genome by replicating themselves and inserting the new copies in different positions. Mobile genetic elements are discussed in Chapter 5. Simple sequence repeats are short nucleotide sequences (less than 14 nucleotide pairs) that are repeated again and again for long stretches. Segmental duplications are large blocks of the genome (1000–200,000 nucleotide pairs) that are present at two or more locations in the genome. Over half of the unique sequence consists of genes and the remainder is probably regulatory DNA. Most of the DNA present in heterochromatin, a specialized type of chromatin (discussed later in this chapter) that contains relatively few genes, has not yet been sequenced. (Adapted from Unveiling the Human Genome, Supplement to the Wellcome Trust Newsletter. London: Wellcome Trust, February 2001.)
Regions from different mouse chromosomes (indicated by the colors of each mouse in B) show conserved synteny (gene order) with the indicated regions of the human genome (A). For example the genes present in the upper portion of human chromosome 1 (orange) are present in the same order in a portion of mouse chromosome 4. Regions of human chromosomes that are composed primarily of short, repeated sequences are shown in black. Mouse centromeres (indicated in black in B) are located at the ends of chromosomes; no known genes lie beyond the centromere on any mouse chromosome. For the most part, human centromeres, indicated by constrictions, occupy more internal positions on chromosomes (see Figure 4-11). (Adapted from International Human Genome Sequencing Consortium, Nature 409:860–921, 2001.)
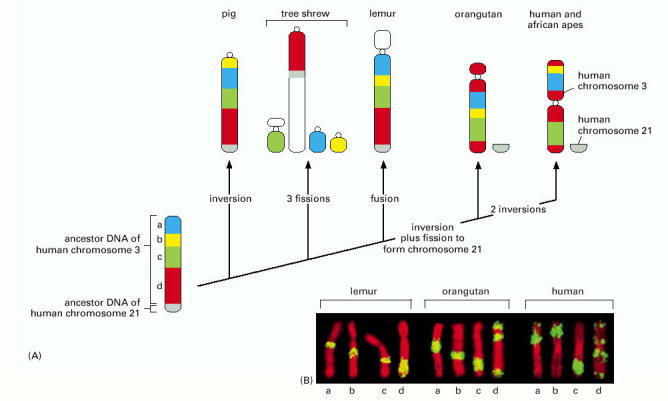
(A) At the lower left is the order of chromosome 3 segments hypothesized to be present on a chromosome of a mammalian ancestor. Along the top are the patterns of chromosome sequences found in the chromosomes of modern mammals. The minimum changes necessary to account for the appearance of the modern chromosomes from the hypothetical ancestor are marked along each branch. In mammals, these types of changes in chromosome organization are thought to occur once every 5–10 × 106 years. The small circles depicted in the modern chromosomes represent the positions of centromeres. (B) Some of the chromosome painting experiments that led to the diagram in (A). Each image shows the chromosome most closely related to human chromosome 3, painted green by hybridization with different segments of DNA, lettered a, b, c, and d along the bottom of the figure. These letters correspond to the colored segments of the diagram in (A). (From S. Müller et al., Proc. Natl. Acad. Sci. USA 97:206–211, 2000. © National Academy of Sciences.)
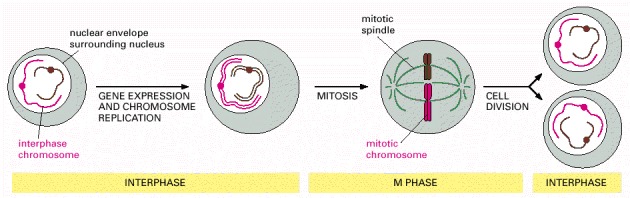
During interphase, the cell is actively expressing its genes and is therefore synthesizing proteins. Also, during interphase and before cell division, the DNA is replicated and the chromosomes are duplicated. Once DNA replication is complete, the cell can enter M phase, when mitosis occurs and the nucleus is divided into two daughter nuclei. During this stage, the chromosomes condense, the nuclear envelope breaks down, and the mitotic spindle forms from microtubules and other proteins. The condensed mitotic chromosomes are captured by the mitotic spindle, and one complete set of chromosomes is then pulled to each end of the cell. A nuclear envelope re-forms around each chromosome set, and in the final step of M phase, the cell divides to produce two daughter cells. Most of the time in the cell cycle is spent in interphase; M phase is brief in comparison, occupying only about an hour in many mammalian cells.
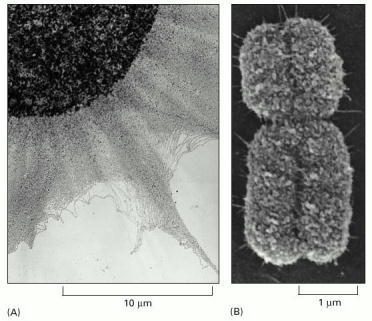
(A) An electron micrograph showing an enormous tangle of chromatin spilling out of a lysed interphase nucleus. (B) A scanning electron micrograph of a mitotic chromosome: a condensed duplicated chromosome in which the two new chromosomes are still linked together (see Figure 4-22). The constricted region indicates the position of the centromere. Note the difference in scales. (A, courtesy of Victoria Foe; B, courtesy of Terry D. Allen.)
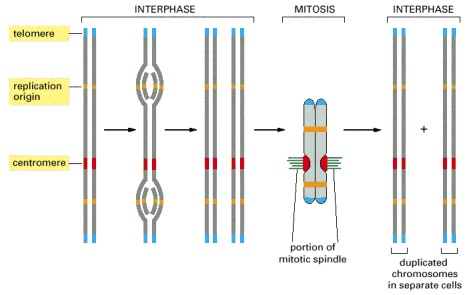
Each chromosome has multiple origins of replication, one centromere, and two telomeres. Shown here is the sequence of events a typical chromosome follows during the cell cycle. The DNA replicates in interphase beginning at the origins of replication and proceeding bidirectionally from the origins across the chromosome. In M phase, the centromere attaches the duplicated chromosomes to the mitotic spindle so that one copy is distributed to each daughter cell during mitosis. The centromere also helps to hold the duplicated chromosomes together until they are ready to be moved apart. The telomeres form special caps at each chromosome end.
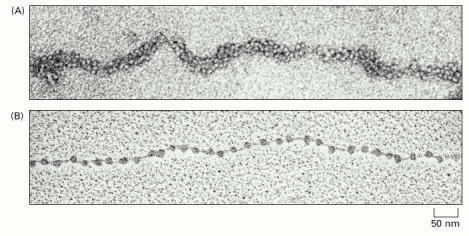
(A) Chromatin isolated directly from an interphase nucleus appears in the electron microscope as a thread 30 nm thick. (B) This electron micrograph shows a length of chromatin that has been experimentally unpacked, or decondensed, after isolation to show the nucleosomes. (A, courtesy of Barbara Hamkalo; B, courtesy of Victoria Foe.)
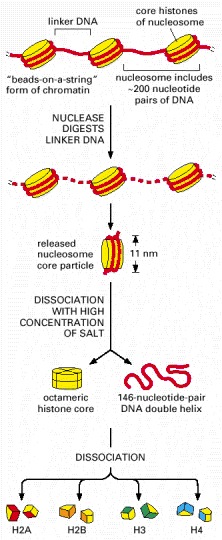
A nucleosome contains a protein core made of eight histone molecules. As indicated, the nucleosome core particle is released from chromatin by digestion of the linker DNA with a nuclease, an enzyme that breaks down DNA. (The nuclease can degrade the exposed linker DNA but cannot attack the DNA wound tightly around the nucleosome core.) After dissociation of the isolated nucleosome into its protein core and DNA, the length of the DNA that was wound around the core can be determined. This length of 146 nucleotide pairs is sufficient to wrap 1.65 times around the histone core.
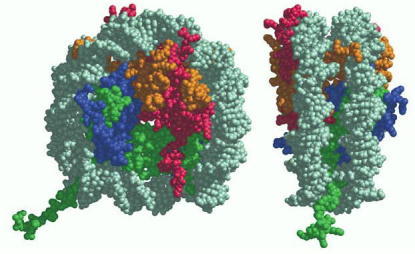
Each histone is colored according to the scheme of Figure 4-24, with the DNA double helix in light gray. (Reprinted by permission from K. Luger et al., Nature 389:251–260, 1997. © Macmillan Magazines Ltd.)
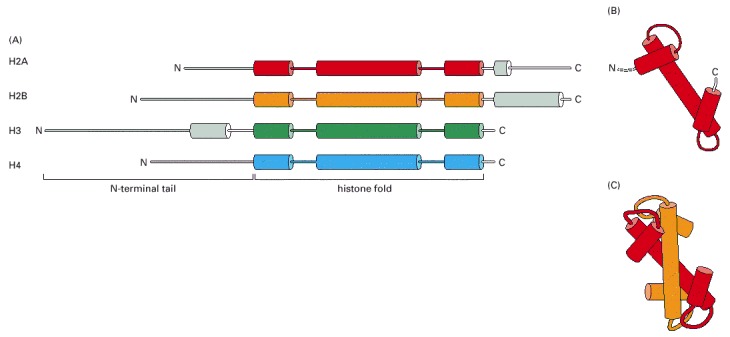
(A) Each of the core histones contains an N-terminal tail, which is subject to several forms of covalent modification, and a histone fold region, as indicated. (B) The structure of the histone fold, which is formed by all four of the core histones. (C) Histones 2A and 2B form a dimer through an interaction known as the “handshake.” Histones H3 and H4 form a dimer through the same type of interaction, as illustrated in Figure 4-27.
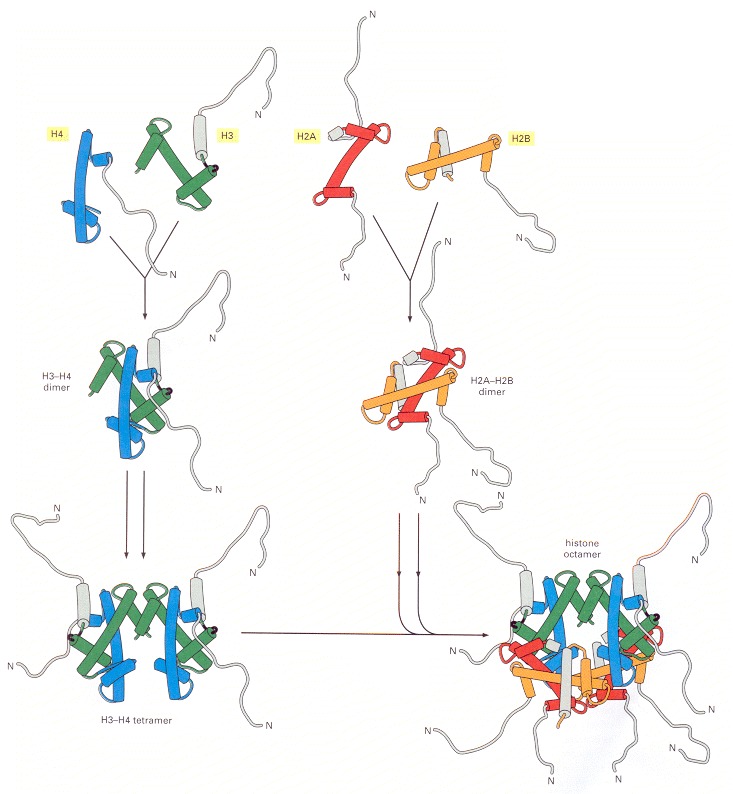
The histone H3–H4 dimer and the H2A-H2B dimer are formed from the handshake interaction. An H3-H4 tetramer forms the scaffold of the octamer onto which two H2A-H2B dimers are added, to complete the assembly. The histones are colored as in Figure 4-26. Note that all eight N-terminal tails of the histones protrude from the disc-shaped core structure. In the x-ray crystal (Figure 4-25), most of the histone tails were unstructured (and therefore not visible in the structure), suggesting that their conformations are highly flexible. (Adapted from figures by J. Waterborg.)
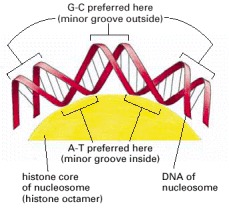
The DNA helix makes 1.65 tight turns around the histone octamer. This diagram is drawn approximately to scale, illustrating how the minor groove is compressed on the inside of the turn. Owing to certain structural features of the DNA molecule, A-T base pairs are preferentially accommodated in such a narrow minor groove.
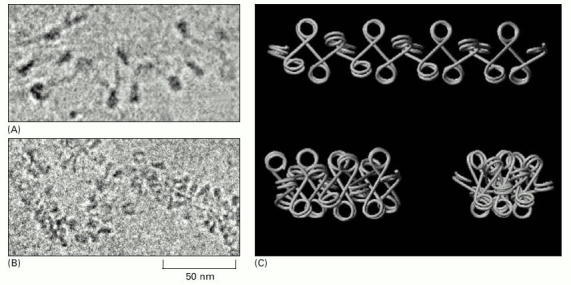
(A and B) Electron microscopic evidence for the top and bottom-left model structures depicted in (C). (C) Zigzag variations. An interconversion between these three variations is proposed to occur by an accordion-like expansion and contraction of the fiber length. Differences in the length of the linker between adjacent nucleosome beads can be accommodated by snaking or coiling of the linker DNA, or by small local changes in the width of the fiber. Formation of the 30-nm fiber requires both histone H1 and the core histone tails; for simplicity, neither is shown here, but see Figures 4-30 and 4-32. (From J. Bednar et al., Proc. Natl. Acad. Sci. USA 95:14173–14178, 1998. © National Academy of Sciences.)
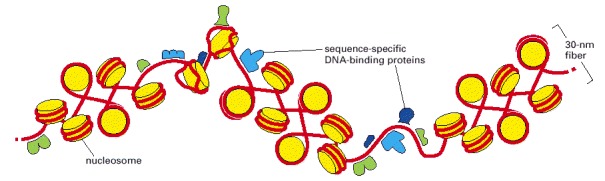
This schematic view of the 30-nm fiber illustrates its interruption by sequence-specific DNA-binding proteins. How these proteins bind tightly to DNA is explained in Chapter 7. The interruptions in the 30-nm fiber may be due to regions of DNA that lack nucleosomes altogether or, more probably, to regions that contain altered or remodeled nucleosomes. Regions of chromatin that are nucleosome free or contain remodeled nucleosome can often be detected experimentally by the unusually high susceptibility of their DNA to digestion by nucleases—as compared with the DNA in nucleosomes.
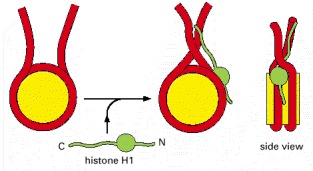
Histone H1 (green) consists of a globular core and two extended tails. Part of the effect of H1 on the compaction of nucleosome organization may result from charge neutralization: like the core histones, H1 is positively charged (especially its C-terminal tail), and this helps to compact the negatively charged DNA. Unlike the core histones, H1 does not seem to be essential for cell viability; in one ciliated protozoan the nucleus expands nearly twofold in the absence of H1, but the cells otherwise appear normal.
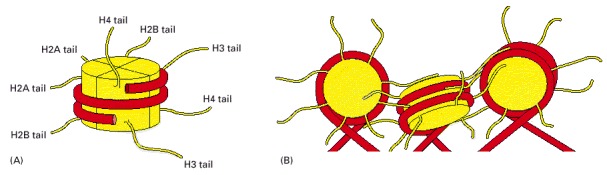
(A) The approximate exit points of the eight histone tails, four from each histone subunit, that extend from each nucleosome. In the high-resolution structure of the nucleosome (see Figure 4-25), the tails are largely unstructured, suggesting that they are highly flexible. (B) A speculative model showing how the histone tails may help to pack nucleosomes together into the 30-nm fiber. This model is based on (1) experimental evidence that histone tails aid in the formation of the 30-nm fiber, (2) the x-ray crystal structure of the nucleosome, which showed that the tails of one nucleosome contact the histone core of an adjacent nucleosome in the crystal lattice, and (3) evidence that the histone tails interact with DNA.
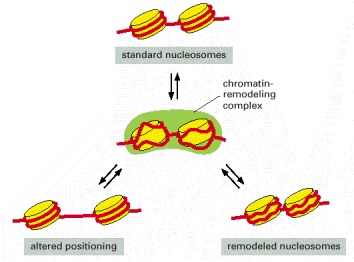
In the absence of remodeling complexes, the interconversion between the three nucleosomal states shown is very slow because of a high activation energy barrier. Using ATP hydrolysis, chromatin-remodeling complexes (green) create an activated intermediate (shown in the center of the figure) in which the histone-DNA contacts have been partly disrupted. This activated state can then decay to any one of the three nucleosomal configurations shown. In this way, the remodeling complexes greatly increase the rate of interconversion between different nucleosomal states. The remodeled state, in which the histone-DNA contacts have been loosened, has a higher free energy level than that of standard nucleosomes and will slowly revert to the standard nucleosome conformation, even in the absence of a remodeling complex. Cells have many different chromatin remodeling complexes, and they differ in their detailed biochemical properties; for example, not all can change the position of a nucleosome, but all use the energy of ATP hydrolysis to alter nucleosome structure. (Adapted from R.E. Kingston and G.J. Narlikar, Genes Dev. 13:2339–2352, 1999.)
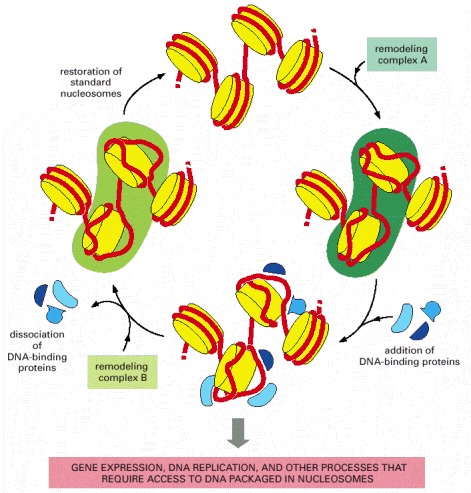
According to this model, different chromatin remodeling complexes disrupt and re-form nucleosomes, although, in principle, the same complex might catalyze both reactions. The DNA-binding proteins could function in gene expression, DNA replication, or DNA repair, and in some cases their binding could lead to the dissociation of the histone core to form nucleosome-free regions of DNA like those illustrated in Figure 4-30. (Adapted from A. Travers, Cell 96:311–314, 1999.)
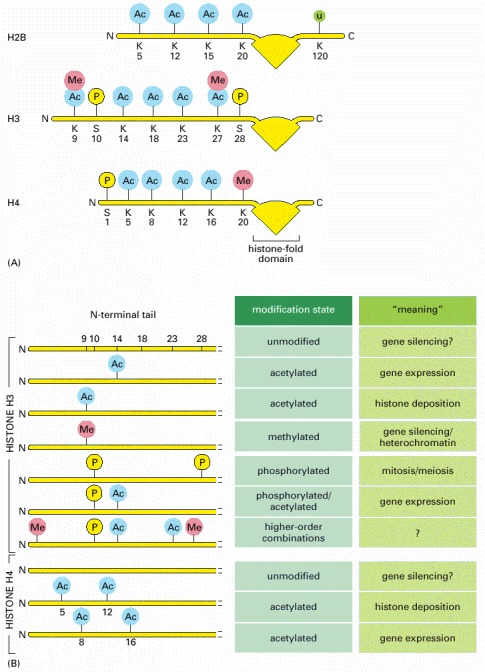
(A) Known modifications of the four histone core proteins are indicated: Me = methyl group, Ac = acetyl group, P = phosphate, u = ubiquitin. Note that some positions (e.g., lysine 9 of H3) can be modified in more than one way. Most of these modifications add a relatively small molecule onto the histone tails; the exception is ubiquitin, a 76 amino acid protein also used in other cellular processes (see Figure 6-87). The function of ubiquitin in chromatin is not well understood: histone H2B can be modified by a single ubiquitin molecule; H2A can be modified by the addition of several ubiquitins. (B) A histone code hypothesis. Histone tails can be marked by different combinations of modifications. According to this hypothesis, each marking conveys a specific meaning to the stretch of chromatin on which it occurs. Only a few of the meanings of the modifications are known. In Chapter 7, we discuss the way a doubly-acetylated H4 tail is “read” by a protein required for gene expression. In another well-studied case, an H3 tail methylated at lysine 9 is recognized by a set of proteins that create an especially compact form of chromatin, which silences gene expression.
The acetylation of lysine 14 of histone H3 and lysines 8 and 16 of histone H4—usually associated with gene expression—is performed by the type A histone acetylases (HATs) in the nucleus. In contrast, the acetylation of lysines 5 and 12 of histone H4 and a lysine of histone H3 takes place in the cytosol, after the histones have been synthesized but before they have been incorporated into nucleosomes; these modifications are catalyzed by type B HATs. These modified histones are deposited onto DNA after DNA replication (see Figure 5-41), and their acetyl groups are taken off shortly afterwards by histone deacetylases (HDACs). Thus, the acetylation at these positions signals newly replicated chromatin.
Modification of a particular position in a histone tail can take on different meanings depending on other features of the local chromatin structure. For example, the phosphorylation of position 10 of histone H3 is associated not only with the condensation of chromosomes that takes place in mitosis and meiosis but also with the expression of certain genes. Some histone tail modifications are interdependent. For example methylation of H3 position 9 blocks the phosphorylation of H3 position 10, and vice versa.
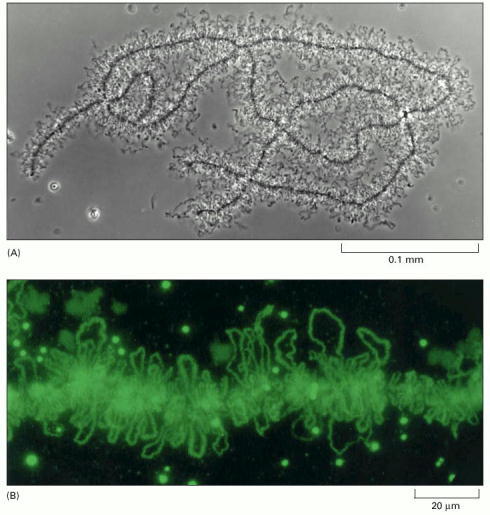
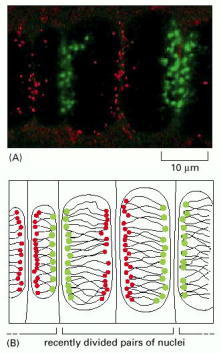
(A) A light micrograph of lampbrush chromosomes in an amphibian oocyte. Early in oocyte differentiation, each chromosome replicates to begin meiosis, and the homologous replicated chromosomes pair to form this highly extended structure containing a total of four replicated DNA molecules, or chromatids. The lampbrush chromosome stage persists for months or years, while the oocyte builds up a supply of materials required for its ultimate development into a new individual. (B) Fluorescence light micrograph showing a portion of an amphibian lampbrush chromosome. The regions of the chromosome that are being actively expressed are stained green by using antibodies against proteins that process RNA during one of the steps of gene expression (discussed in Chapter 6). The round granules are thought to correspond to large complexes of the RNA-splicing machinery that will also be discussed in Chapter 6. (A, courtesy of Joseph G. Gall; B, courtesy of Joseph G. Gall and Christine Murphy.)
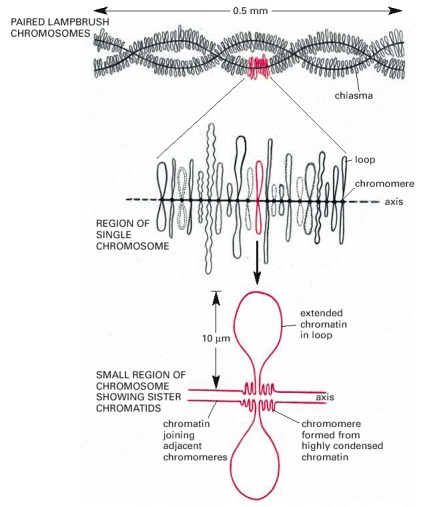
The set of lampbrush chromosomes in many amphibians contains a total of about 10,000 chromatin loops, although most of the DNA in each chromosome remains highly condensed in the chromomeres. Each loop corresponds to a particular DNA sequence. Four copies of each loop are present in each cell, since each of the two chromosomes shown at the top consists of two closely apposed, newly replicated chromosomes. This four-stranded structure is characteristic of this stage of development of the oocyte, the diplotene stage of meiosis; see Figure 20-12.
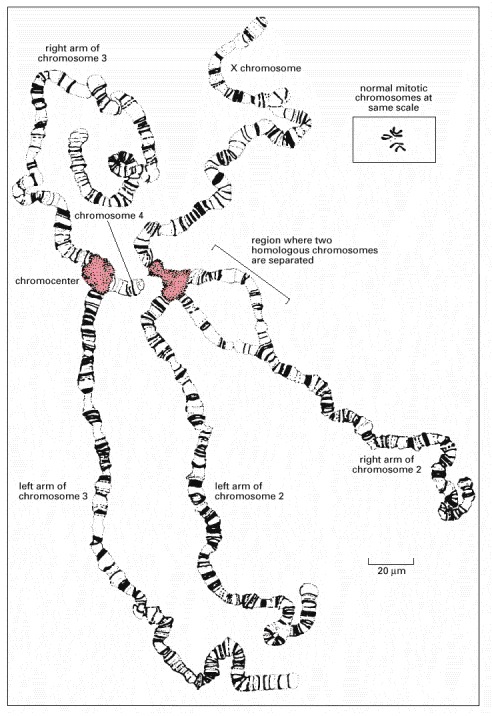
These chromosomes have been spread out for viewing by squashing them against a microscope slide. Drosophila has four chromosomes, and there are four different chromosome pairs present. But each chromosome is tightly paired with its homolog (so that each pair appears as a single structure), which is not true in most nuclei (except in meiosis). The four polytene chromosomes are normally linked together by regions near their centromeres that aggregate to create a single large chromocenter (pink region). In this preparation, however, the chromocenter has been split into two halves by the squashing procedure used. (Modified from T.S. Painter, J. Hered. 25:465–476, 1934.)
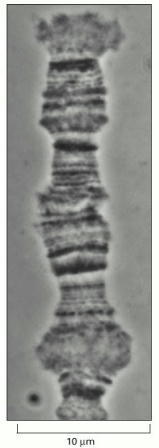
The distinct pattern produced by bands and interbands is readily seen. The bands are regions of increased chromatin concentration that occur in interphase chromosomes. Although they are detectable only in polytene chromosomes, it is thought that they reflect a structure common to the chromosomes of most eucaryotes. (Courtesy of Joseph G. Gall.)
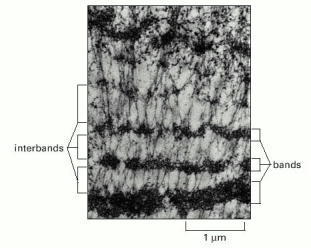
Bands of very different thickness can be readily distinguished, separated by interbands, which contain less condensed chromatin. (Courtesy of Veikko Sorsa.)
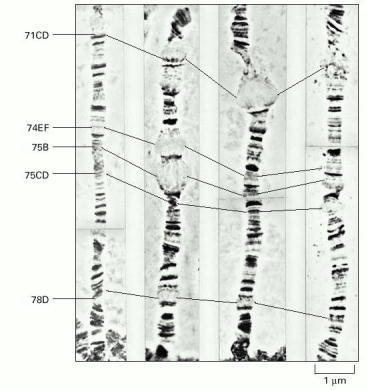
This series of time-lapse photographs shows how puffs arise and recede in the polytene chromosomes of Drosophila during larval development. A region of the left arm of chromosome 3 is shown. It exhibits five very large puffs in salivary gland cells, each active for only a short developmental period. The series of changes shown occur over a period of 22 hours, appearing in a reproducible pattern as the organism develops. The designations of the indicated bands are given at the left of the photographs. (Courtesy of Michael Ashburner.)
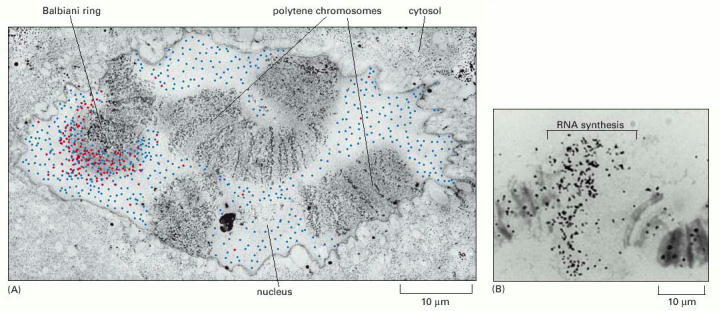
(A) Polytene chromosomes from the salivary glands of the insect C. tentans. As outlined in Chapter 1 and described in detail in Chapter 6, the first step in gene expression is the synthesis of an RNA molecule using the DNA as a template. In this electron micrograph, newly synthesized RNA from a Balbiani ring gene is indicated in red. Cells were exposed to a brief pulse of BrUTP (an analog of UTP), which was incorporated into RNA. Cells were then fixed and the newly synthesized RNAs were identified by using antibodies against BrU. Balbiani ring RNAs could be distinguished from other RNAs by their characteristic shape (see Figure 4-43). The blue dots in the figure represent positions of Balbiani ring RNAs that were synthesized before the addition of BrUTP. The experiment shows that Balbiani ring RNAs are synthesized in puffs and then diffuse through the nucleoplasm. (B) An autoradiogram of a single puff in a polytene chromosome. The portion of the chromosome indicated is undergoing RNA synthesis and has therefore become labeled with 3H-uridine. (A, courtesy of B. Daneholt, from O.P Singh et al., Exp. Cell Res. 251:135–146, 1999. © Academic Press; B, courtesy of José Bonner.)
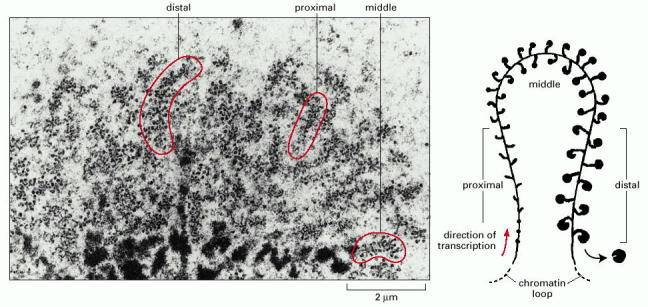
The electron micrograph shows a thin section of the chromatin in a Balbiani ring, a chromosome puff very active in gene expression. The Balbiani ring gene codes for secretory proteins the larvae uses to spin a protective tube. The chromatin is arranged in loops, but because the sample has been sectioned, only portions of the loops are visible. As they are synthesized on the chromatin, the RNA molecules are bound up by protein molecules, making them visible as knobs on stalks in the electron microscope. From the size of the RNA-protein complex, the extent of RNA synthesis (transcription) can be inferred; a whole chromatin loop (shown on the right) can then be reconstructed from a set of electron micrograph sections such as that shown here. (Courtesy of B. Daneholt, from U. Skoglund et al., Cell 34:847–855, 1983. © Elsevier.)
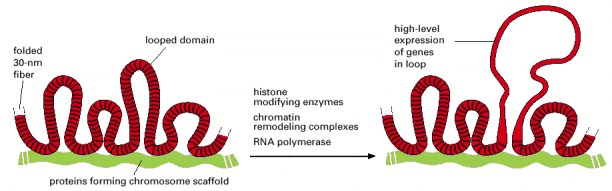
A section of an interphase chromosome is shown folded into a series of looped domains, each containing 20,000–100,000 nucleotide pairs of double-helical DNA condensed into a 30-nm fiber. Individual loops can decondense, perhaps in part through an accordionlike expansion of the 30-nm fiber (see Figure 4-29), when the cell requires direct access to the DNA packaged in these loops. This decondensation is brought about by enzymes that directly modify chromatin structure—as well as by proteins, such as RNA polymerase (discussed in Chapter 6), that act directly on the underlying DNA. It is not understood how the folded 30-nm fiber is anchored to the chromosome axis, but evidence suggests that the base of chromosomal loops is rich in DNA topoisomerases, which are enzymes that allow DNA to swivel when anchored (see pp. 251–253).
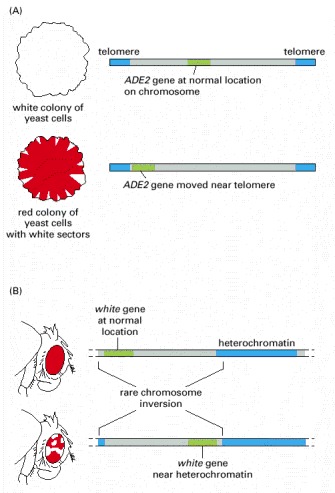
(A) The yeast ADE2 gene at its normal chromosomal location is expressed in all cells. When moved near the end of a yeast chromosome, which is inferred to be folded into a form of heterochromatin, the gene is no longer expressed in most cells of the population. The ADE2 gene codes for one of the enzymes of adenine biosynthesis, and the absence of the ADE2 gene product leads to the accumulation of a red pigment. Therefore, a colony of cells that expresses ADE2 is white, and one composed of cells where the ADE2 gene is not expressed is red. The white sectors that fan out from the middle of the red colony grown on an agar surface represent the descendants of cells in which the ADE2 gene has spontaneously become active. These white sectors are thought to result from a heritable change to a less tightly packed state of chromatin near the ADE2 gene in these cells. Although yeast chromosomes are too small to be seen under the light microscope, the chromatin structure at the ends of yeast chromosomes is thought to have many of the same structural features as the heterochromatin in the chromosomes of larger organisms.
(B) Position effects can also be observed for the white gene in the fruit fly Drosophila. The white gene controls eye pigment production and is named after the mutation that first identified it. Wild-type flies with a normal white gene (white – ) have normal pigment production, which gives them red eyes, but if the white gene is mutated and inactivated, the mutant flies (white – ) make no pigment and have white eyes. In flies in which a normal white + gene has been moved near a region of heterochromatin, the eyes are mottled, with both red and white patches. The white patches represent cells in which the white + gene has been silenced by the effects of the heterochromatin. In contrast, the red patches represent cells that express the white + gene because the heterochromatin did not spread across this gene at the time, early in development, when the heterochromatin first formed. As in the yeast, the presence of large patches of red and white cells indicates that the state of transcriptional activity of the gene is inherited, once determined by its chromatin packaging in the early embryo.
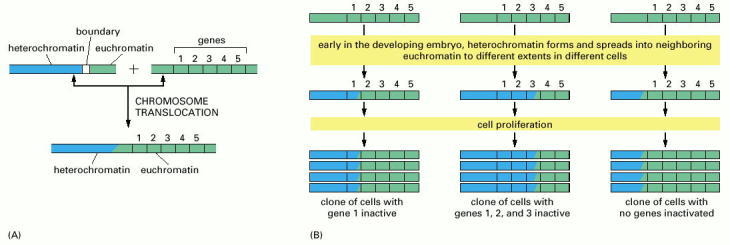
(A) Heterochromatin (blue) is normally prevented from spreading into adjacent regions of euchromatin (green) by special boundary DNA sequences, which we discuss in Chapter 7. In flies that inherit certain chromosomal rearrangements, however, this barrier is no longer present. (B) During the early development of such flies, heterochromatin can spread into neighboring chromosomal DNA, proceeding for different distances in different cells. This spreading soon stops, but the established pattern of heterochromatin is inherited, so that large clones of progeny cells are produced that have the same neighboring genes condensed into heterochromatin and thereby inactivated (hence the “variegated” appearance of some of these flies; see Figure 4-45B). Although “spreading” is used to describe the formation of new heterochromatin near previously existing heterochromatin, the term may not be wholly accurate. There is evidence that during expansion, heterochromatin can “skip over” some regions of chromatin, sparing the genes that lie within them from repressive effects. One possibility is that heterochromatin can expand across the base of some DNA loops, thus bypassing the chromatin contained in the loop.
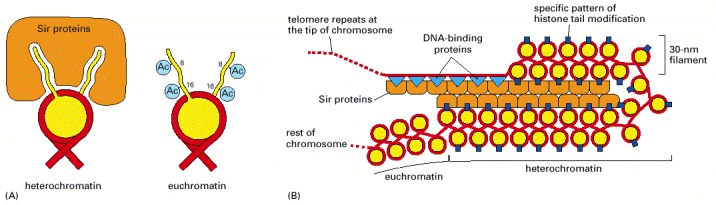
(A) Heterochromatin is generally underacetylated, and underacetylated tails of histone H4 are proposed to interact with a complex of Sir proteins, thus stabilizing the association of these proteins with nucleosomes. Although shown as fully unacetylated, the exact pattern of histone H4 tail modification required to bind to the Sir complex is not known with certainty. In some organisms, the methylation of lysine 9 of histone H3 is also a critical signal for heterochromatin formation. In euchromatin, histone tails are typically highly acetylated. Those of H4 are shown as partially acetylated but, in reality, the acetylation state varies across euchromatin. (B) Specialized DNA-binding proteins (blue triangles) recognize DNA sequences near the ends of chromosomes and attract the Sir proteins, one of which (Sir2) is an NAD+-dependent histone deacetylase. This then leads to the cooperative spreading of the Sir protein complex down the chromosome. As this complex spreads, the deacetylation catalyzed by Sir2 helps create new binding sites on nucleosomes for more Sir protein complexes. A “fold back” structure of the type shown may also form.
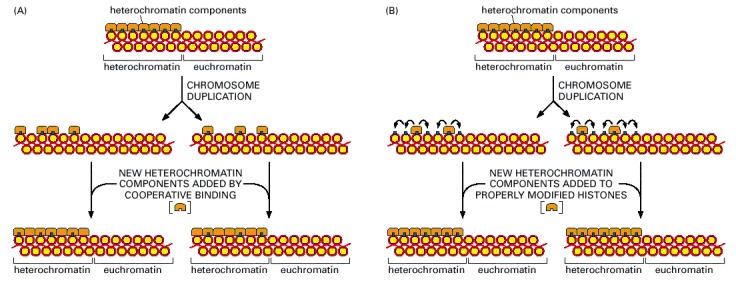
In both cases, half of the specialized heterochromatin components have been distributed to each daughter chromosome after DNA duplication. (A) In this model, new heterochromatin components bind cooperatively to the inherited components, thereby beginning the process of new heterochromatin formation. The process is completed with the assembly of additional proteins and the eventual covalent modification of the histones (not shown). (B) In this model, the inherited heterochromatin components change the pattern of histone modification on the newly formed daughter nucleosomes nearby, creating new binding sites for free heterochromatin components, which assemble and complete the structure. Both models can account for the spreading effects of heterochromatin, and indeed, both processes may occur simultaneously in cells.
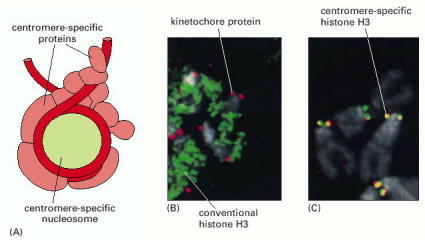
(A) A model for the proteins that assemble on a yeast centromere. The specialized nucleosome contains an H3 variant (called CENP-A in most organisms), along with core histones H2A, H2B, and H4. The folding of DNA into this nucleosome facilitates the assembly of the other centromere-binding proteins, which form the kinetochore that attaches the centromere to the mitotic spindle (B) The localization of conventional histone H3 on Drosophila mitotic chromosomes. The conventional H3 has been fused to a fluorescent protein and appears green. A component of the kinetochore has been stained red with antibodies against a specific kinetochore protein. (C) The same experiment, but with the centromere-specific histone H3 (instead of the conventional H3) labeled green. When the red and green stains are coincident, the staining appears yellow. (A, adapted from P.B. Meluh et al., Cell 94:607–613, 1998; B and C, from S. Henikoff et al., Proc. Natl. Acad. Sci. USA 97:716–721, 2000. © National Academy of Sciences.)
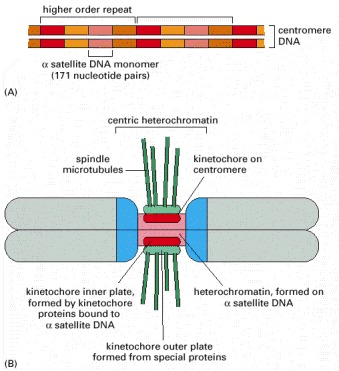
(A) The organization of the alpha satellite DNA sequences, which are repeated many thousands of times at a centromere. (B) An entire chromosome. The alpha satellite DNA sequences (red) are AT-rich and consist of a large number of repeats that vary slightly from one another in their DNA sequence. Blue represents the position of flanking centric heterochromatin, which contains DNA sequences composed of different types of repeats. As indicated, the kinetochore consists of an inner and an outer plate, formed by a set of kinetochore proteins. The spindle microtubules attach to the kinetochore in M phase of the cell cycle (see Figure 4-22). (B, adapted from T.D. Murphy and G.H. Karpen, Cell 93:317–320, 1998.)
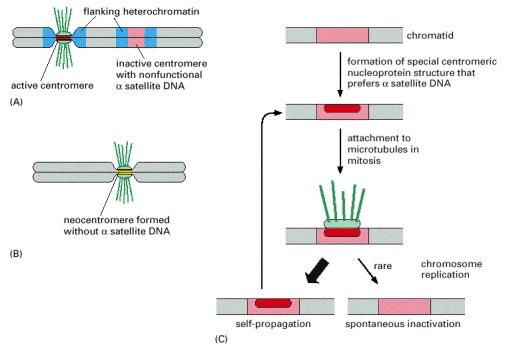
(A) Owing to an ancient chromosome breakage and rejoining event, some human chromosomes contain two blocks of alpha satellite DNA (red), each of which presumably functioned as a centromere in its original chromosome. Usually, these dicentric chromosomes are not stably propagated because they are attached improperly to the spindle and are broken apart during mitosis. In those chromosomes that survive, one of the centromeres has spontaneously inactivated, even though it contains all the necessary DNA sequences. This allows the chromosome to be stably propagated. (B) In a small fraction (1/2000) of human births, extra chromosomes are observed in cells of the offspring. Some of these extra chromosomes, which have formed from a breakage event, lack alpha satellite DNA altogether, yet new centromeres have arisen from what was originally euchromatic DNA. (C) A model to explain the plasticity and inheritance of centromeres.
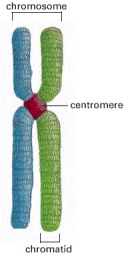
Each sister chromatid contains one of two identical daughter DNA molecules generated earlier in the cell cycle by DNA replication.
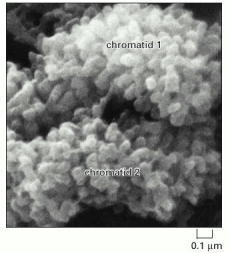
Each knoblike projection is believed to represent the tip of a separate looped domain. Note that the two identical paired chromatids drawn in Figure 4-52 can be clearly distinguished. (From M.P. Marsden and U.K. Laemmli, Cell 17:849–858, 1979. © Elsevier.)
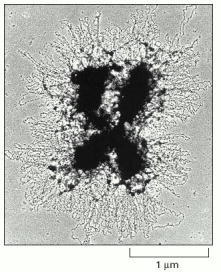
This chromosome (from an insect) was treated to reveal loops of chromatin fibers that emanate from a central scaffold of the chromatid. Such micrographs support the idea that the chromatin in all chromosomes is folded into a series of looped domains (see Figure 4-55). (Courtesy of Uli Laemmli.)
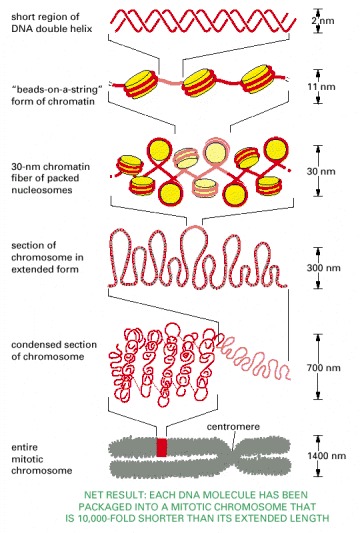
This model shows some of the many levels of chromatin packing postulated to give rise to the highly condensed mitotic chromosome.
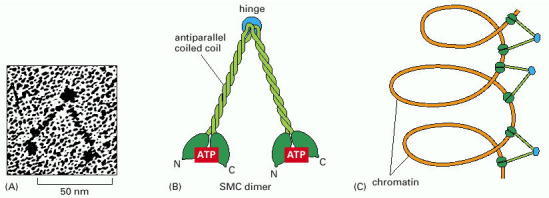
(A) Electron micrographs of a purified SMC dimer. (B) The structure of an SMC dimer. The long central region of this protein is an antiparallel coiled coil (see Figure 3-11) with a flexible hinge in its middle, as demonstrated by the electron micrograph in (A). (C) A model for the way in which the SMC proteins in condensins might compact chromatin. In reality, SMC proteins are components of a much larger condensin complex. It has been proposed that, in the cell, condensins coil long strings of looped chromatin domains (see Figure 4-55). In this way the condensins would form a structural framework that maintains the DNA in a highly organized state during M phase of the cell cycle. (A, courtesy of H.P. Erickson; B and C, adapted from T. Hirano, Genes Dev. 13:11–19, 1999.)
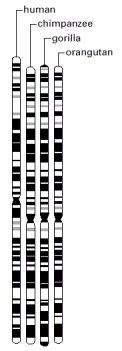
Comparisons among the staining patterns of all the chromosomes indicate that human chromosomes are more closely related to those of chimpanzee than to those of gorilla and that they are more distantly related to those of orangutan. (Adapted from M.W. Strickberger, Evolution, 3rd edn. Sudbury, MA: Jones & Bartlett Publishers, 2000.)
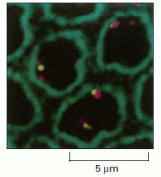
(A) Fluorescent light micrograph of interphase nuclei from the rapidly growing root tip of a plant. Centromeres are stained green and teleomeres red by in situ hybridization of centromere- and telomere-specific DNA sequences coupled to the different fluorescent dyes. (B) Interpretation of (A) showing chromosomes in the Rab1 orientation with all the centromeres facing one side of a nucleus and all the telomeres pointing toward the opposite side. (A, from R. Abranches et al., J. Cell Biol. 143:5–12, 1998. © The Rockefeller University Press.)
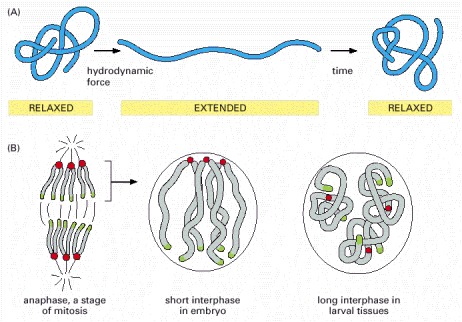
(A) The behavior of a polymer in solution. Entropy drives a long polymer into a compact conformation in the absence of an externally applied force. If the polymer is subjected to shear or hydrodynamic force, it becomes extended. But once the force is removed, the polymer chain returns to a more favorable, compact conformation. (B) The behavior of interphase chromosomes may reflect the same simple principles. In Drosophila embryos, for example, mitotic divisions occur at intervals of about 10 minutes; during the short intervening interphases, the chromosomes have little time to relax from the Rabl orientation induced by their movement during mitosis. However, in later stages of development, when interphase is much longer, the chromosomes have time to fold up. This folding may be strongly affected by specific associations between different regions of the same chromosome. (Adapted from A.F. Dernburg et al., Cell 85:745–759, 1996.)
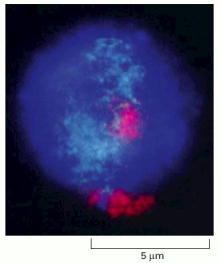
The fluorescent light micrograph shows that the two copies of human chromosome 18 (red) and chromosome 19 (turquoise) occupy discrete territories of the nucleus. (From J.A. Croft et al., J. Cell Biol. 145:1119–1131, 1999. © The Rockefeller University Press.)
This high-resolution microscopic view of nuclei from a Drosophila embryo shows the localization of two different regions of chromosome 2 (yellow and magenta) close to the nuclear envelope (stained green with antilamina antibodies). Other regions of the same chromosome are more distant from the envelope. (From W.F. Marshall et al., Mol. Biol. Cell 7:825–842, 1996.)