Chapter 23.1 - Figures
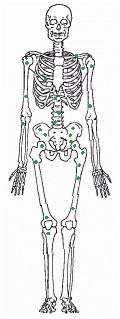
Malignant tumors typically give rise to metastases, making the cancer hard to eradicate. The drawing shows common sites in the bone marrow for metastases from carcinoma of the prostate gland. (From Union Internationale Contre le Cancer, TNM Atlas: Illustrated Guide to the Classification of Malignant Tumors, 2nd edn., Berlin: Springer-Verlag, 1986.)
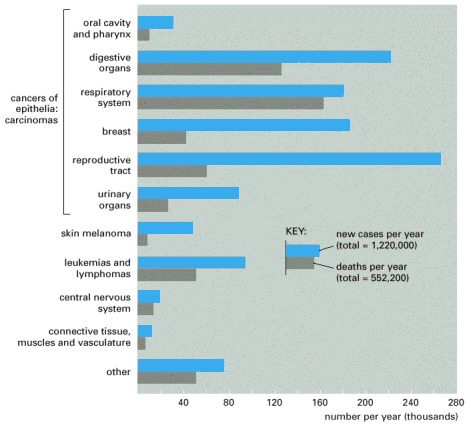
These figures are for the year 2000. Total new cases diagnosed in that year in the United States were 1,220,000, and total cancer deaths were 552,200. Note that only about half the number of people who develop cancer die of it.
In the world as a whole, the five most common cancers are those of the lung, stomach, breast, colon/rectum, and uterine cervix, and the total number of new cancer cases recorded per year is just over 6 million.
Skin cancers other than melanomas are not included in figures, since almost all are cured easily and many go unrecorded. (Data from American Cancer Society, Cancer Facts and Figures, 2000.)
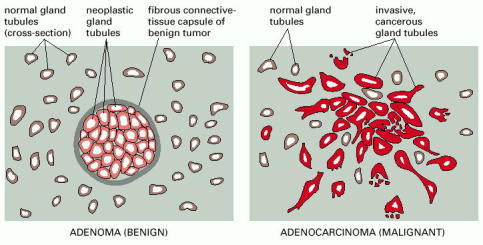
A benign glandular tumor (an adenoma) and a malignant glandular tumor (an adenocarcinoma) appear structurally distinct. There are many forms that such tumors may take; the diagram illustrates types that might be found in the breast.
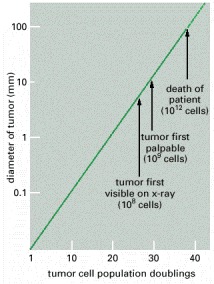
The diameter of the tumor is plotted on a logarithmic scale. Years may elapse before the tumor becomes noticeable. The doubling time of a typical breast tumor, for example, is about 100 days.
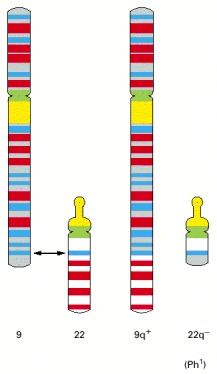
The smaller of the two resulting abnormal chromosomes is called the Philadelphia chromosome, after the city where the abnormality was first recorded.
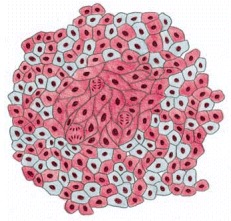
As a result of a random process that occurs in the early embryo, practically every normal tissue in a woman's body is a mixture of cells with different X chromosomes heritably inactivated (indicated here by the mixture of red cells and gray cells in the normal tissue). When the cells of a cancer are tested for their expression of an X-linked marker gene, however, they are usually all found to have the same X chromosome inactivated. This implies that they are all derived from a single cancerous founder cell.
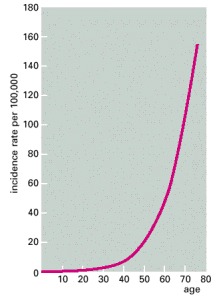
The number of newly diagnosed cases of colon cancer in women in England and Wales in one year is plotted as a function of age at diagnosis and expressed relative to the total number of individuals in each age group. The incidence of cancer rises steeply as a function of age. If only a single mutation were required to trigger the cancer and this mutation had an equal chance of occurring at any time, the incidence would be independent of age. (Data from C. Muir et al., Cancer Incidence in Five Continents, Vol. V. Lyon: International Agency for Research on Cancer, 1987.)
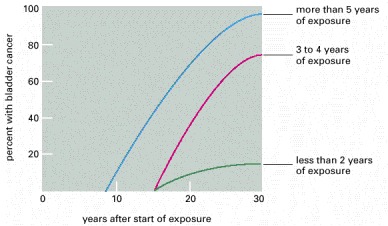
The graph shows the length of the delay before onset of bladder cancer in a set of 78 workers in the chemical industry who had been exposed to the carcinogen 2-naphthylamine, grouped according to the duration of their exposure. (Modified from J. Cairns, Cancer: Science and Society. San Francisco: W.H. Freeman, 1978. After M.H.C. Williams, in Cancer, Vol. III [R.W. Raven, ed.]. London: Butterworth Heinemann, 1958.)
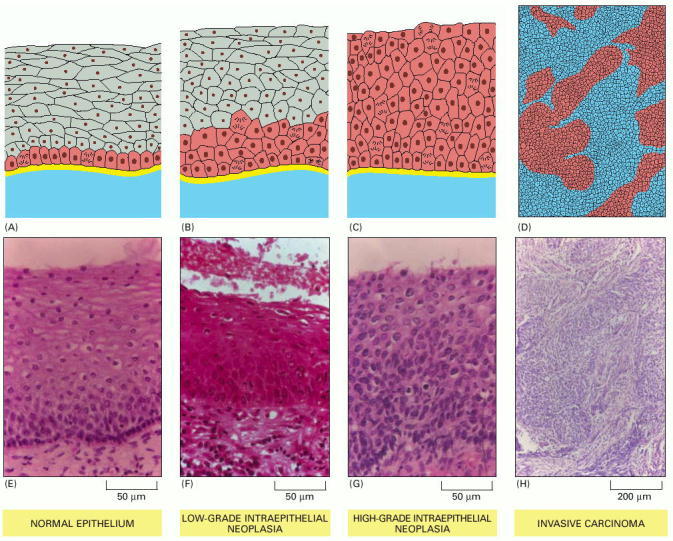
Pathologists use standardized terminology to classify the types of disorder they see, so as to guide the choice of treatment. Schematic diagrams are shown in A-D; sections of cervical epithelium corresponding to these changes are shown in E-H. (A, E) In the normal stratified squamous epithelium, dividing cells are confined to the basal layer. (B, F) In low-grade intraepithelial neoplasia, dividing cells can be found throughout the lower third of the epithelium; the superficial cells are still flattened and show signs of differentiation, but this is incomplete. (C, G) In high-grade intraepithelial neoplasia, cells in all the epithelial layers are proliferating and show no sign of differentiation. (D, H) True malignancy begins when the cells move through or destroy the basal lamina and invade the underlying connective tissue. (Photographs courtesy of Margaret Stanley.)
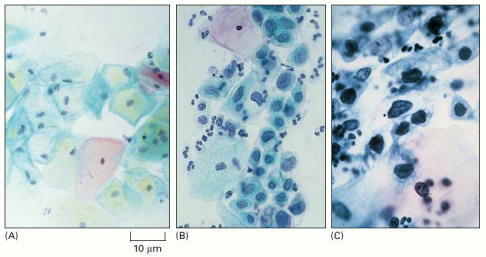
(A) Normal: the cells are large and well differentiated, with highly condensed nuclei. (B) Precancerous lesion: differentiation and proliferation are abnormal but the lesion is not yet invasive; the cells are in various stages of differentiation, some quite immature. (C) Invasive carcinoma: the cells all appear undifferentiated, with scanty cytoplasm and a relatively large nucleus. Debris in the background includes some white blood cells. (Courtesy of Winifred Gray.)
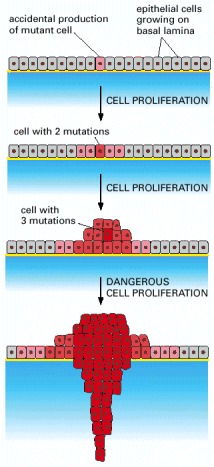
A tumor develops through repeated rounds of mutation and proliferation, giving rise eventually to a clone of fully malignant cancer cells. At each step, a single cell undergoes a mutation that enhances cell proliferation, so that its progeny become the dominant clone in the tumor. Proliferation of this clone then hastens occurrence of the next step of tumor progression by increasing the size of the cell population at risk of undergoing an additional mutation.
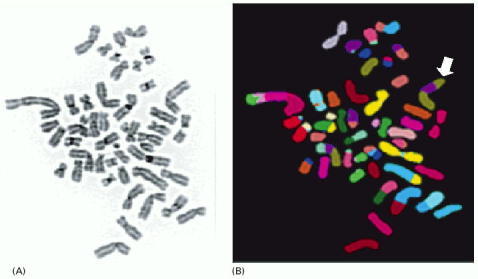
Chromosomes were prepared from a breast tumor cell in metaphase, spread on a glass slide, and stained with (A) a general DNA stain or (B) a combination of fluorescent stains that give a different color for each normal human chromosome. The staining (displayed in false color) shows multiple translocations, including a doubly translocated chromosome (white arrow) made up of two pieces of chromosome 8 (green) and a piece of chromosome 17 (purple). The karyotype also contains 48 chromosomes, instead of the normal 46. (Courtesy of Joanne Davidson and Paul Edwards.)
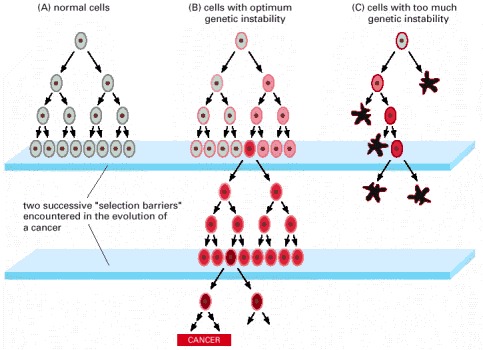
Cells that maintain an optimum level of genetic instability may be the most successful in the race to form a tumor. (A) In normal cells, the intrinsic amount of genetic instability is low. Thus when normal cells hit a selection barrier—low levels of oxygen or a scarcity of proliferation signals, for example—they are very unlikely to be mutable enough to produce a cell that continues proliferating. (B) In tumor cell precursors, an increased level of genetic instability makes it likely that at least one cell will contain the requisite genetic alteration to pass the selection barrier and continue the process of tumor progression. This genetic instability is retained in the lineage, and it can be measured in the resulting tumor. (C) If the level of genetic instability is too high, many of the cells suffer deleterious mutations and either proliferate much more slowly than their neighbors or are eliminated by cell death. This excessive mutability can lead to extinction of the cell lineage. (Adapted from D.P. Cahill et al., Trends Cell Biol. 9:M57–M60, 1999.)
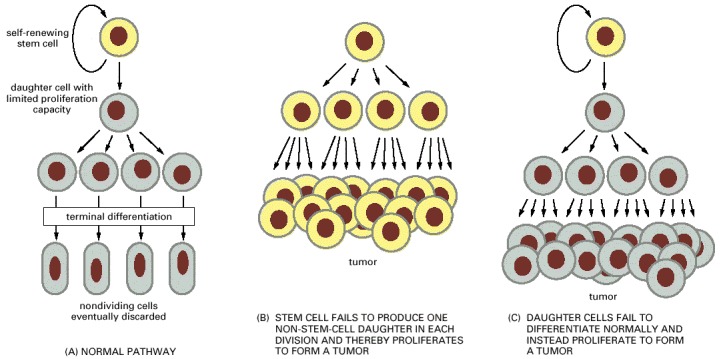
(A) The normal strategy for producing new differentiated cells. (B and C) Two types of derangement that can give rise to the unbridled proliferation characteristic of cancer. Note that an excessive cell-division rate for the stem cells in (A) will not by itself have this effect, as long as each cell division produces only one daughter that is a stem cell.
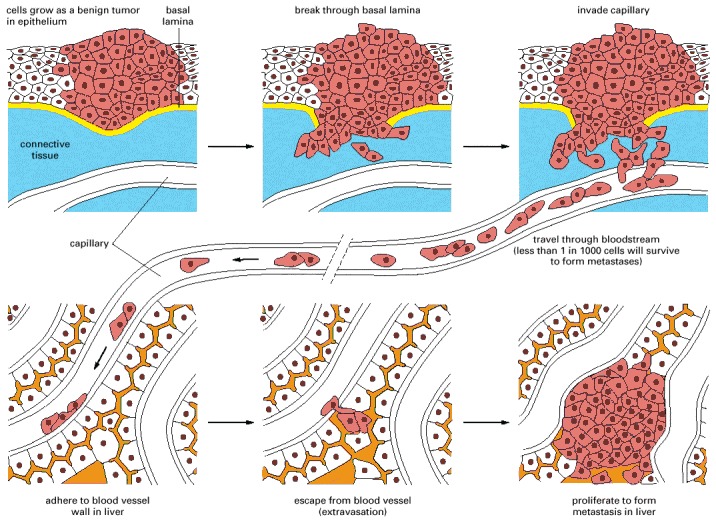
This example illustrates the spread of a tumor from an organ such as the lung or bladder to the liver. Tumor cells may enter the bloodstream directly by crossing the wall of a blood vessel, as diagrammed here, or, more commonly perhaps, by crossing the wall of a lymphatic vessel that ultimately discharges its contents (lymph) into the bloodstream. Tumor cells that have entered a lymphatic vessel often become trapped in lymph nodes along the way, giving rise to lymph-node metastases. Studies in animals show that typically far less than one in every thousand malignant tumor cells that enter the bloodstream will survive to produce a tumor at a new site.
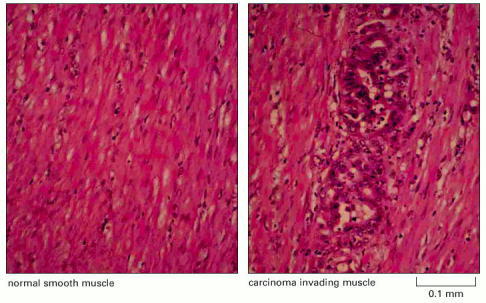
In this tissue slice, colorectal cancer cells can be seen growing between the muscle fibers (pink). Some stages in the development of this type of cancer are shown in Figure 23-38. (Courtesy of Paul Edwards and the Department of Pathology, University of Cambridge.)
Chapter 23.2 - Figures
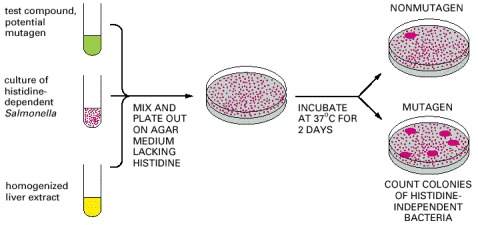
The test uses a strain of Salmonella bacteria that require histidine in the medium because of a defect in a gene necessary for histidine synthesis. Mutagens can cause a further change in this gene that reverses the defect, creating revertant bacteria that do not require histidine. To increase the sensitivity of the test, the bacteria also have a defect in their DNA repair machinery that makes them especially susceptible to agents that damage DNA. A majority of compounds that are mutagenic in tests such as this are also carcinogenic and vice versa.
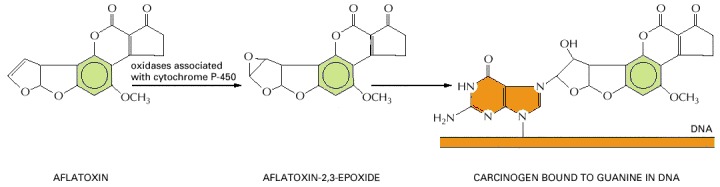
Many chemical carcinogens have to be activated by a metabolic transformation before they will cause mutations by reacting with DNA. The compound illustrated here is aflatoxin B1, a toxin from a mold (Aspergillus flavus oryzae) that grows on grain and peanuts when they are stored under humid tropical conditions. It is thought to be a contributory cause of liver cancer in the tropics and is associated with characteristic mutations of the p53 gene (discussed later in this chapter).
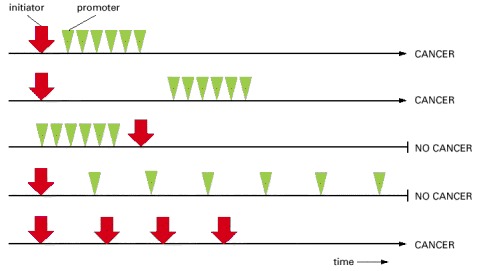
Cancer ensues only if the exposure to the promoter follows exposure to the initiator and only if the intensity of exposure to the promoter exceeds a certain threshold. Cancer can also occur as a result of repeated exposure to the initiator alone.
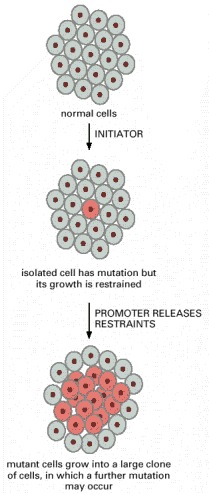
The tumor promoter expands the population of mutant cells, thereby increasing the probability of tumor progression by further genetic change.
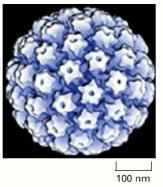
(Courtesy of Norman Olson.)
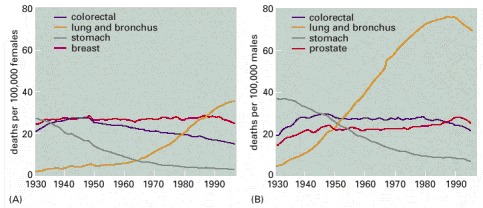
Selected death rates adjusted to the age distribution of the US population in 1970, are plotted for (A) females and (B) males. Note the dramatic rise in lung cancer for both sexes, following the pattern of tobacco smoking, and the fall in deaths from stomach cancer, possibly related to changes in diet or in patterns of infection with Helicobacter. Recent reductions in other cancer death rates may correspond to improvements in detection and treatment. (Adapted from Cancer Facts and Figures 2000. © American Cancer Society, 2000.)
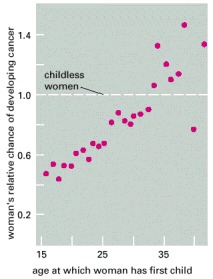
The relative probability of breast cancer developing at some time in a woman's life is plotted as a function of the age at which she gives birth to her first child. The graph shows the value of the probability relative to that for a childless woman. The longer the period of exposure to reproductive hormones up to birth of the first child, the greater the risk. It is thought that the first full-term pregnancy may result in a permanent change in the state of differentiation of the cells of the breast, altering their subsequent responses to hormones. Several other lines of epidemiological evidence also support the view that exposure to certain combinations of reproductive hormones, especially estrogen, can promote development of breast cancer. (From J. Cairns, Cancer: Science and Society. San Francisco: W.H. Freeman, 1978. After B. MacMahon, P. Cole, and J. Brown, J. Natl. Cancer Inst. 50:21–42, 1973.)
Chapter 23.3 - Figures
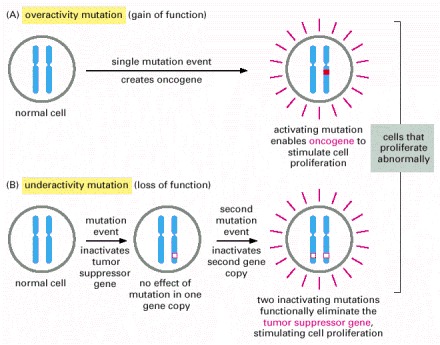
Oncogenes act in a dominant manner: a gain-of-function mutation in a single copy of the cancer-critical gene can drive a cell toward cancer. Tumor suppressor genes, on the other hand, generally act in a recessive manner: the function of both alleles of the cancer-critical gene must be lost to drive a cell toward cancer. In this diagram, activating mutations are represented by solid red boxes, inactivating mutations by hollow red boxes.
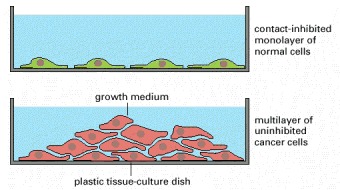
Most normal cells stop proliferating once they have carpeted the dish with a single layer of cells: proliferation seems to depend on contact with the dish, and to be inhibited by contacts with other cells. Cancer cells, in contrast, usually disregard these restraints and continue to grow, so that they pile up on top of one another.
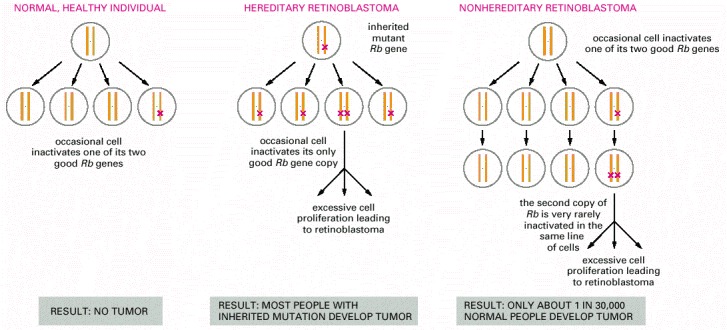
In the hereditary form, all cells in the body lack one of the normal two functional copies of the Rb tumor suppressor gene, and tumors occur where the remaining copy is lost or inactivated by a somatic mutation. In the nonhereditary form, all cells initially contain two functional copies of the gene, and the tumor arises because both copies are lost or inactivated through the coincidence of two somatic mutations in one line of cells.
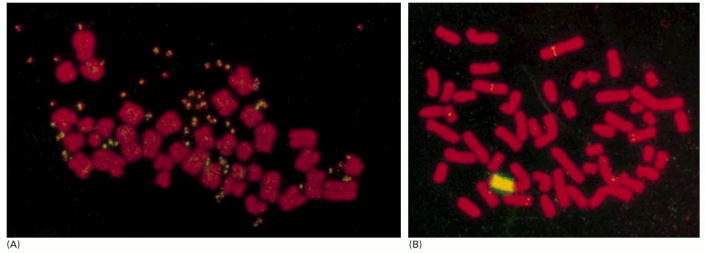
In these examples, the numbers of copies of a myc proto-oncogene have been amplified. Amplification of oncogenes is common in carcinomas and is often visible as a curious change in the karyotype: the cell is seen to contain additional pairs of miniature chromosomes—so-called double minute chromosomes—or to have a homogeneously staining region interpolated in the normal banding pattern of one of its regular chromosomes. Both these aberrations consist of massively amplified numbers of copies of a small segment of the genome. The chromosomes are stained with a red fluorescent dye, while the multiple copies of the Myc gene are detected by in situ hybridization with a yellow fluorescent probe. (A) Karyotype of a cell in which the Myc gene copies are present as double minute chromosomes (paired yellow specks). (B) Karyotype of a cell in which the multiple Myc gene copies appear as a homogeneously staining region (yellow) interpolated in one of the regular chromosomes. (Ordinary single-copy myc genes can be detected as tiny yellow dots elsewhere in the genome.) (Courtesy of Denise Sheer.)
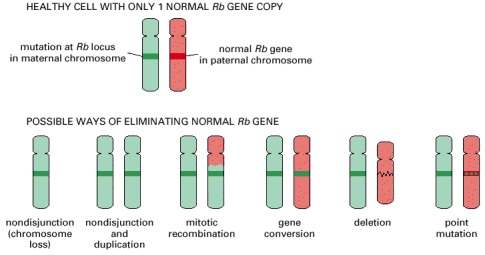
A cell that is defective in only one of its two copies of a tumor suppressor gene—for example, the Rb gene—usually behaves as a normal, healthy cell; the diagrams show how it may come to lose the function of the other gene copy as well and thereby progress toward cancer. Cloned DNA probes can be used in conjunction with tests for polymorphisms (see Chapter 8) to analyze the tumor DNA and discover which type of event has occurred in a given patient. A seventh possibility, encountered with some tumor suppressors, is that the gene may be silenced by an epigenetic change, without alteration of the DNA sequence. (After W.K. Cavenee et al., Nature 305:779–784, 1983. © Macmillan Magazines Ltd.)
Chapter 23.4 - Figures
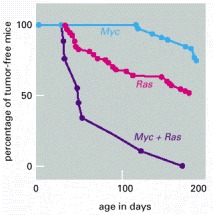
The graphs show the incidence of tumors in three types of transgenic mice, one carrying a Myc oncogene, one carrying a Ras oncogene, and one carrying both oncogenes. For these experiments two lines of transgenic mice were first constructed. One carries an inserted copy of an oncogene created by fusing the proto-oncogene Myc with the mouse mammary tumor virus regulatory DNA (which then drives Myc overexpression in specific tissues such as the mammary gland). The other line carries an inserted copy of the Ras oncogene under control of the same regulatory element. Both strains of mice develop tumors much more frequently than normal, most often in the mammary or salivary glands. Mice that carry both oncogenes together are obtained by crossing the two strains. These hybrids develop tumors at a far higher rate still, much greater than the sum of the rates for the two oncogenes separately. Nevertheless, the tumors arise only after a delay and only from a small proportion of the cells in the tissues where the two genes are expressed. Some further accidental change, in addition to the two oncogenes, is apparently required for the development of cancer. (After E. Sinn et al., Cell 49:465–475, 1987. © Elsevier.)
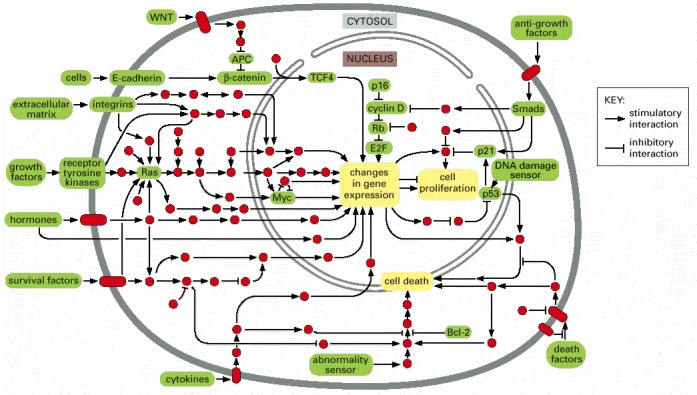
Products of both oncogenes and tumor suppressor genes often occur within the same pathways. Individual signaling proteins are indicated by red circles, with the cancer-critical components and control mechanisms discussed in this chapter in green. Stimulatory and inhibitory interactions between proteins are designated as shown in the key. (Adapted from D. Hanahan and R.A. Weinberg, Cell 100:57–70, 2000.)
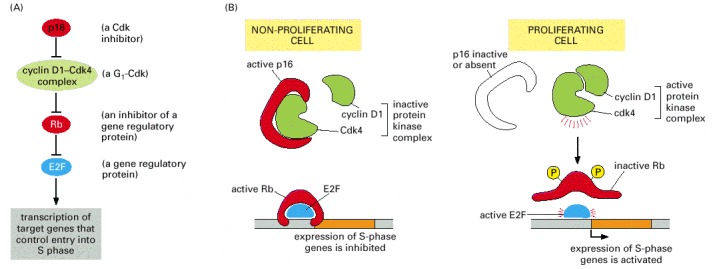
All the components of this pathway have been found to be altered by mutation in human cancers (products of proto-oncogenes, green; products of tumor suppressor genes, red; E2F shown in blue because it has both inhibitory and stimulatory actions, depending on the other proteins that are bound to it). In most cases, only one of the components is altered in any individual tumor. (A) A simplified view of the dependency relationships in this pathway; see Figure 17-30 for further details. (B) The Rb protein inhibits entry into the cell-division cycle when it is unphosphorylated.The complex of Cdk4 and cyclin D1 phosphorylates Rb, thereby encouraging cell proliferation. When a cell is stressed, p16 inhibits the formation of an active Cdk4/cyclin D1 complex, preventing proliferation. Inactivation of Rb or p16 by mutation encourages cell division (thus each can be regarded as a tumor suppressor) while overactivity of Cdk4 or cyclin D1 encourages cell division (thus each can be regarded as a proto-oncogene).
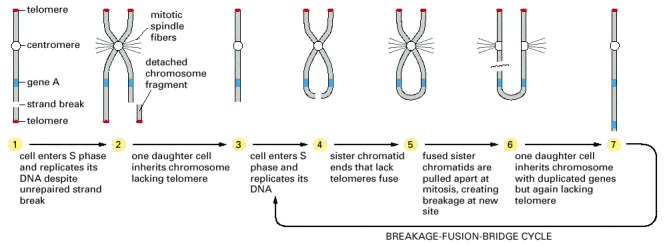
The diagram shows one of several possible mechanisms. The process begins with accidental DNA damage in a cell that lacks functional p53 protein. Instead of halting at the p53-dependent checkpoint in the division cycle, where a normal cell with damaged DNA would pause until the damage was repaired, the p53-defective cell enters S phase, with the consequences shown. Once a chromosome carrying a duplication and lacking a telomere has been generated, repeated rounds of replication, chromatid fusion, and unequal breakage (the so-called breakage-fusion-bridge cycle) can increase the number of copies of the duplicated region still further.
Selection in favor of cells with increased numbers of copies of a gene in the affected chromosomal region will thus lead to mutants in which the gene is amplified to a high copy number. The multiple copies may eventually become visible as a homogeneously staining region in the chromosome, or they may—either through a recombination event or through unrepaired DNA strand breakage—become excised from their original locus and so appear as independent double minute chromosomes (see Figure 23-28). The chromosomal disorder can also lead to loss of genes, with selection in favor of cells that have lost tumor suppressors.
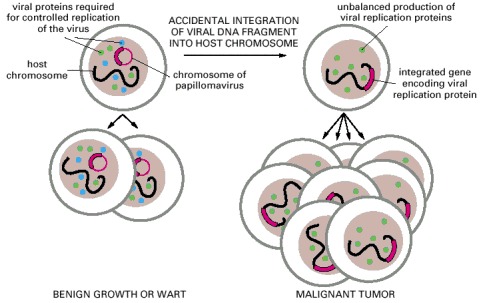
Papillomaviruses have double-stranded circular DNA chromosomes of about 8000 nucleotide pairs. In a wart or other benign infection these chromosomes are stably maintained in the basal cells of the epithelium as plasmids whose replication is regulated so as to keep step with the chromosomes of the host (left). Rare accidents can cause the integration of a fragment of such a plasmid into a chromosome of the host, altering the environment of the viral genes. This (or possibly some other cause) disrupts the control of viral gene expression. The unregulated production of viral replication proteins interferes with the control of cell division, thereby helping to generate a cancer (right).
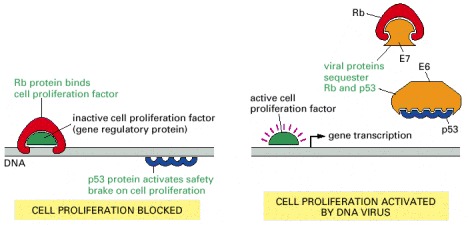
Papillomavirus uses two viral proteins, E6 and E7, to sequester the host cell's p53 and Rb respectively. The SV40 virus (a related virus that infects monkeys) uses a single dual-purpose protein called large T antigen, for the same purpose. The E6 protein binding leads to ubiquitylation of its p53 partner, inducing p53 proteolysis (not shown).
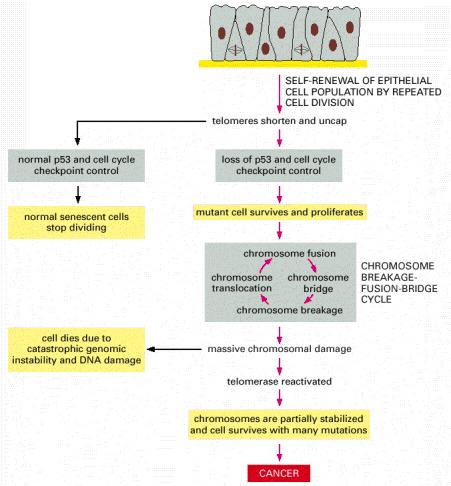
Most human cells lack telomerase. As such cells divide, the telomeres that cap the ends of their chromosomes shrink. After many divisions, the telomeres become so short that they cease to function correctly, and the inadequately capped chromosome ends produce an intracellular signal similar to that produced by double-strand breaks. In the normal cells that still produce functional p53 and have their cell-cycle checkpoints intact, this triggers an arrest of cell division (replicative senescence). But a rare cell within the cell population that has acquired a mutation in its p53 gene or in its cell-cycle checkpoints may ignore this signal and continue to divide, entering a breakage-fusion-bridge cycle that causes massive chromosomal damage (see Figure 23-33). Some cells may survive this period of genetic disruption by reactivating telomerase, which halts the catastrophic cycle and restores enough chromosomal stability for cell survival. These damaged cells can then go on to accumulate the additional mutations needed to produce a cancer.
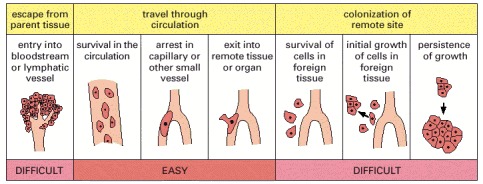
Studies of labeled tumor cells leaving a tumor site, entering the circulation, and establishing metastases show which steps in the metastatic process, outlined in Figure 23-15, are difficult or ‘inefficient,’ in the sense that they are steps in which large numbers of cells fail and are lost. It is in these difficult steps that highly metastatic cells are abserved to have much greater success than nonmetastatic cells. It seems that the ability to escape from the parent tissue, and an ability to survive and grow in the foreign tissue, are key properties that cells must acquire to become metastatic. (Adapted from A.F. Chambers et al., Breast Cancer Res. 2:400–407, 2000.)
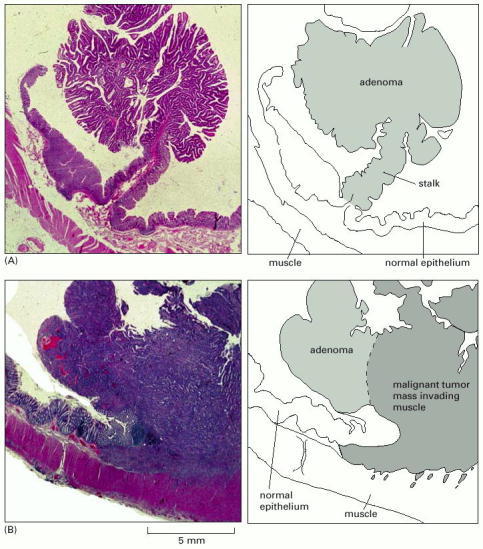
(A) An adenomatous polyp from the colon. The polyp protrudes into the lumen—the space inside the colon. The rest of the wall of the colon is covered with normal colonic epithelium; the epithelium on the polyp appears mildly abnormal. (B) A carcinoma that is beginning to invade the underlying muscle layer. A high magnification view of this region showing the tumor cells growing between muscle cells is shown in Figure 23-16. (Courtesy of Paul Edwards.)
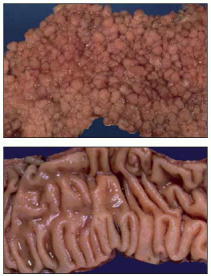
(A) The polyposis colon is completely covered by hundreds of projecting polyps (shown in section in Figure 23-38A), each resembling a tiny cauliflower when viewed with the naked eye. (B) The normal colon wall is a gently undulating but smooth surface. (Courtesy of Andrew Wyllie and Mark Arends.)
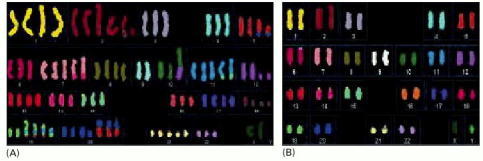
(A) The karyotype of a typical cancer shows many gross abnormalities in chromosome number and structure. Considerable variation can also exist from cell to cell. (B) The karyotype of a tumor that has a stable chromosome complement with few chromosomal anomalies. Its defects are mostly invisible, having been created by defects in DNA mismatch repair. All of the chromosomes in this figure were stained as in Figure 23-12, the DNA of each normal chromosome being stained with a different combination of fluorescent dyes. (Courtesy Wael Abdel-Rahman and Paul Edwards.)
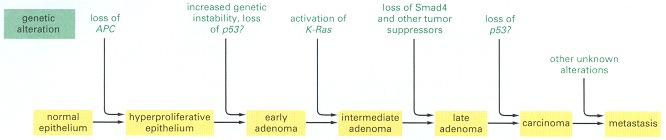
This over-simplified diagram provides a general idea of the way mutation and tumor development can fit together. But there are certainly other mutant genes of which we are not yet aware, and different colon cancers can progress through different sequences of mutations. There is still debate about the timing of p53 mutations and of the onset of genetic instability in relation to other mutations.
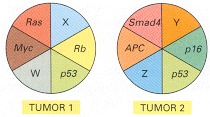
In this schematic diagram, W, X, Y, and Z denote alterations in as yet undiscovered tumor suppressor genes or oncogenes. Tumors that arise from different tissues are generally more different in their genetic abnormalities than tumors of similar origin.
Chapter 23.5 - Figures
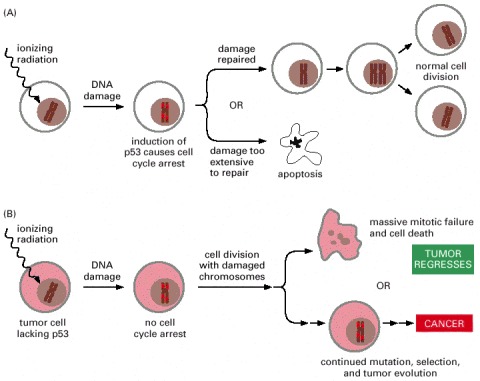
Cancer cells tend to be more susceptible than normal cells to the damaging effects of ionizing radiation because they lack an ability to arrest the cell cycle and make the necessary repairs. Unfortunately, the same genetic defects may render some cancer cells resistant to radiation treatment, as they may also be less adept at activating apoptosis in the face of DNA damage.
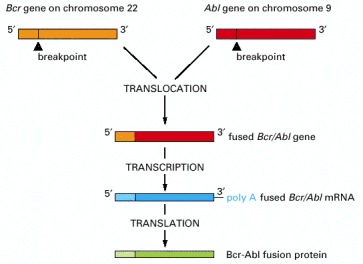
The chromosome translocation responsible joins the Bcr gene on chromosome 22 to the Abl gene from chromosome 9, thereby generating a Philadelphia chromosome (see Figure 23-5). The resulting fusion protein has the N-terminus of the Bcr protein joined to the C-terminus of the Abl tyrosine protein kinase; in consequence, the Abl kinase domain becomes inappropriately active, driving excessive proliferation of a clone of hemopoietic cells in the bone marrow.
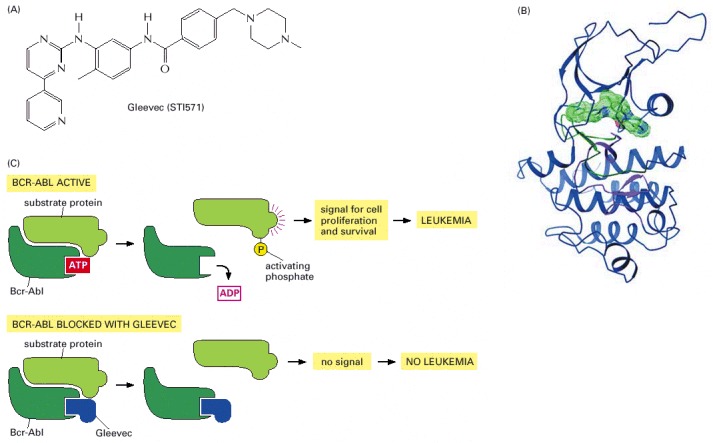
(A) The chemical structure of Gleevec. The drug can be given by mouth; it has side effects but they are usually quite tolerable. (B) The structure of the complex of Gleevec (solid green object) with the tyrosine kinase domain of the Abl protein (ribbon diagram), as determined by X-ray crystallography. (C) Gleevec sits in the ATP-binding pocket of the tyrosine kinase domain of Bcr-Abl and thereby prevents Bcr-Abl from transferring a phosphate group from ATP onto a tyrosine residue in a substrate protein. This blocks onward transmission of a signal for cell proliferation and survival. (B, from T. Schindler et al., Science 289:1938–1942, 2000. © AAAS.)