Chapter 2 - Figures
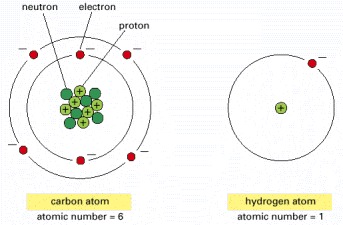
Although the electrons are shown here as individual particles, in reality their behavior is governed by the laws of quantum mechanics, and there is no way of predicting exactly where an electron is at any given instant of time. The nucleus of every atom except hydrogen consists of both positively charged protons and electrically neutral neutrons. The number of electrons in an atom is equal to its number of protons (the atomic number), so that the atom has no net charge. The neutrons, protons, and electrons are in reality minute in relation to the atom as a whole; their size is greatly exaggerated here. In addition, the diameter of the nucleus is only about 10-4 that of the electron cloud.
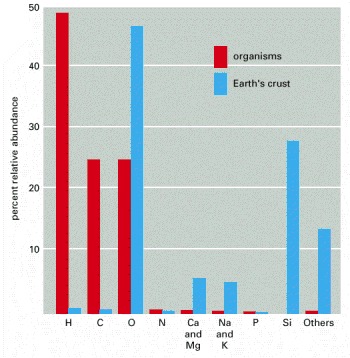
The abundance of each element is expressed as a percentage of the total number of atoms present in the sample. Thus, for example, nearly 50% of the atoms in a living organism are hydrogen atoms. The survey here excludes mineralized tissues such as bone and teeth, as they contain large amounts of inorganic salts of calcium and phosphorus. The relative abundance of elements is similar in all living organisms.
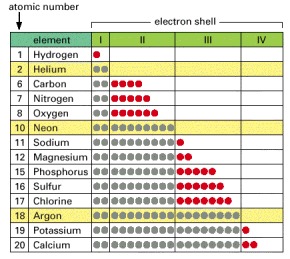
All the elements commonly found in living organisms have unfilled outermost shells (red) and can thus participate in chemical reactions with other atoms. For comparison, some elements that have only filled shells (yellow) are shown; these are chemically unreactive.
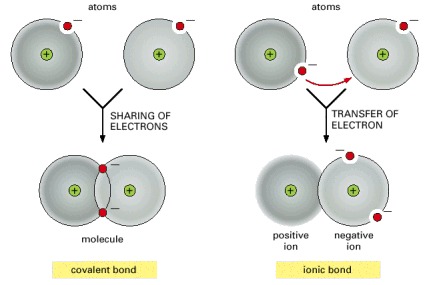
Atoms can attain a more stable arrangement of electrons in their outermost shell by interacting with one another. An ionic bond is formed when electrons are transferred from one atom to the other. A covalent bond is formed when electrons are shared between atoms. The two cases shown represent extremes; often, covalent bonds form with a partial transfer (unequal sharing of electrons), resulting in a polar covalent bond (see Figure 2-43).
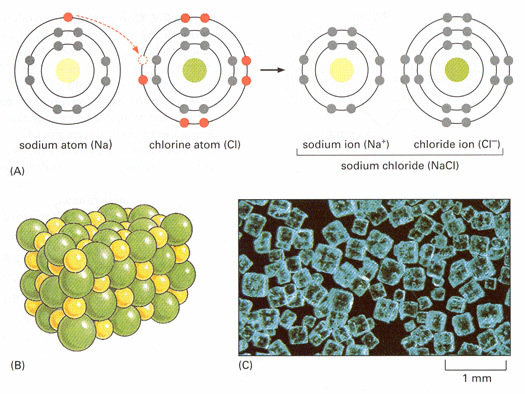
(A) An atom of sodium (Na) reacts with an atom of chlorine (Cl). Electrons of each atom are shown schematically in their different energy levels; electrons in the chemically reactive (incompletely filled) shells are red. The reaction takes place with transfer of a single electron from sodium to chlorine, forming two electrically charged atoms, or ions, each with complete sets of electrons in their outermost levels. The two ions with opposite charge are held together by electrostatic attraction. (B) The product of the reaction between sodium and chlorine, crystalline sodium chloride, consists of sodium and chloride ions packed closely together in a regular array in which the charges are exactly balanced. (C) Color photograph of crystals of sodium chloride.
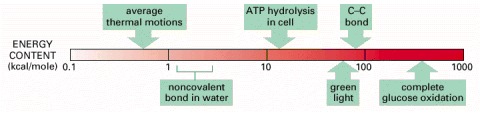
Note that these energies are compared on a logarithmic scale.
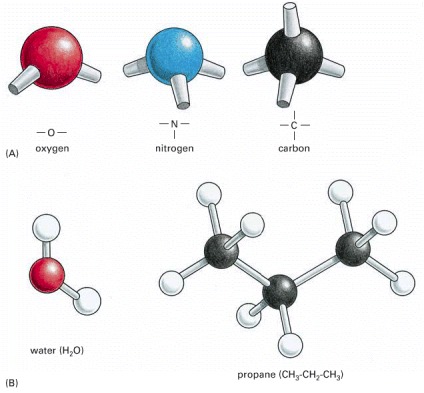
(A) The spatial arrangement of the covalent bonds that can be formed by oxygen, nitrogen, and carbon. (B) Molecules formed from these atoms have a precise three-dimensional structure, as shown here by ball and stick models for water and propane. A structure can be specified by the bond angles and bond lengths for each covalent linkage.
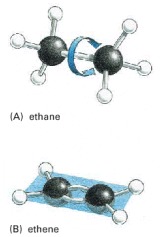
(A) The ethane molecule, with a single covalent bond between the two carbon atoms, illustrates the tetrahedral arrangement of single covalent bonds formed by carbon. One of the CH3 groups joined by the covalent bond can rotate relative to the other around the bond axis. (B) The double bond between the two carbon atoms in a molecule of ethene (ethylene) alters the bond geometry of the carbon atoms and brings all the atoms into the same plane (blue); the double bond prevents the rotation of one CH2 group relative to the other.
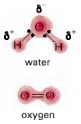
The electron distributions in the polar water molecule (H2O) and the nonpolar oxygen molecule (O2) are compared (δ+, partial positive charge; δ-, partial negative charge).
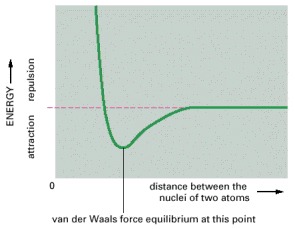
As the nuclei of two atoms approach each other, they initially show a weak bonding interaction due to their fluctuating electric charges. However, the same atoms will strongly repel each other if they are brought too close together. The balance of these van der Waals attractive and repulsive forces occurs at the indicated energy minimum.
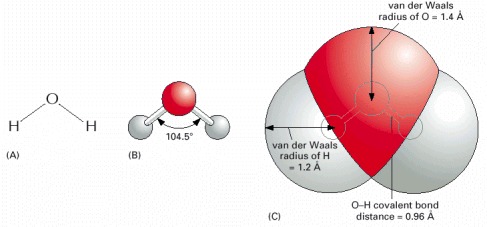
(A) The usual line drawing of the structural formula, in which each atom is indicated by its standard symbol, and each line represents a covalent bond joining two atoms. (B) A ball and stick model, in which atoms are represented by spheres of arbitrary diameter, connected by sticks representing covalent bonds. Unlike (A), bond angles are accurately represented in this type of model (see also Figure 2-8). (C) A space-filling model, in which both bond geometry and van der Waals radii are accurately represented.
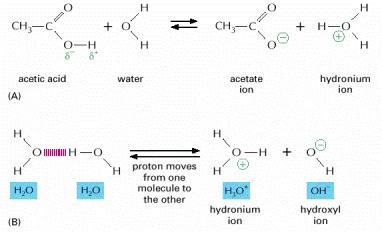
(A) The reaction that takes place when a molecule of acetic acid dissolves in water. (B) Water molecules are continuously exchanging protons with each other to form hydronium and hydroxyl ions. These ions in turn rapidly recombine to form water molecules.
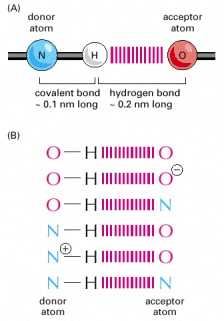
(A) Ball- and-stick model of a typical hydrogen bond. The distance between the hydrogen and the oxygen atom here is less than the sum of their van der Waals radii, indicating a partial sharing of electrons. (B) The most common hydrogen bonds in cells.
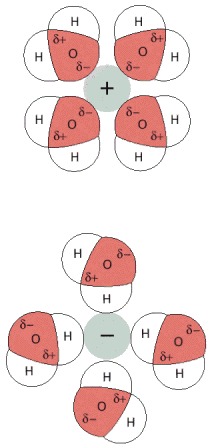
In this schematic illustration, plus and minus are used to mark chemical groups that can form attractive interactions when paired.
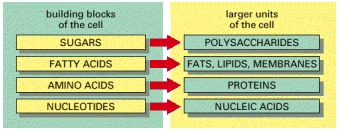
These small molecules form the monomeric building blocks, or subunits, for most of the macromolecules and other assemblies of the cell. Some, like the sugars and the fatty acids, are also energy sources.
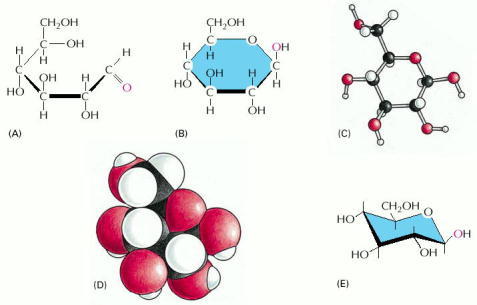
As illustrated previously for water (see Figure 2-12), any molecule can be represented in several ways. In the structural formulas shown in (A), (B) and (E), the atoms are shown as chemical symbols linked together by lines representing the covalent bonds. The thickened lines here are used to indicate the plane of the sugar ring, in an attempt to emphasize that the -H and -OH groups are not in the same plane as the ring. (A) The open-chain form of this sugar, which is in equilibrium with the more stable cyclic or ring form in (B). (C) A ball-and-stick model in which the three-dimensional arrangement of the atoms in space is shown. (D) A space-filling model, which, as well as depicting the three-dimensional arrangement of the atoms, also uses the van der Waals radii to represent the surface contours of the molecule. (E) The chair form is an alternative way to draw the cyclic molecule that reflects the geometry more accurately than the structural formula in (B). The atoms in (C) and (D) are drawn according to the conventional color coding for atoms. For example, these colors are H, white; C, black; O, red; N, blue (see also Figure 2-8).
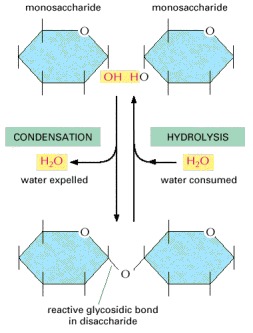
This reaction belongs to a general category of reactions termed condensation reactions, in which two molecules join together as a result of the loss of a water molecule. The reverse reaction (in which water is added) is termed hydrolysis. Note that one of the two partners (the one on the left here) is the carbon joined to two oxygens through which the sugar ring forms (see Figure 2-18). As indicated, this common type of covalent bond between two sugar molecules is known as a glycosidic bond (see also Figure 2-20).
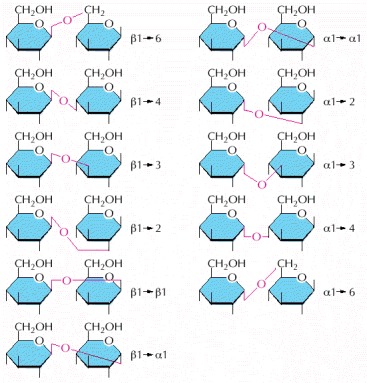
Although these differ only in the type of linkage between the two glucose units, they are chemically distinct. Since the oligosaccharides associated with proteins and lipids may have six or more different kinds of sugar joined in both linear and branched arrangements through glycosidic bonds such as those illustrated here, the number of distinct types of oligosaccharides that can be used in cells is extremely large. For an explanation of α and β linkages, see Panel 2-4 (pp. 116–117).
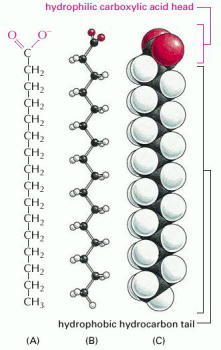
A fatty acid is composed of a hydrophobic hydrocarbon chain to which is attached a hydrophilic carboxylic acid group. Palmitic acid is shown here. Different fatty acids have different hydrocarbon tails. (A) Structural formula. The carboxylic acid group is shown in its ionized form. (B) Ball-and-stick model. (C) Space-filling model.
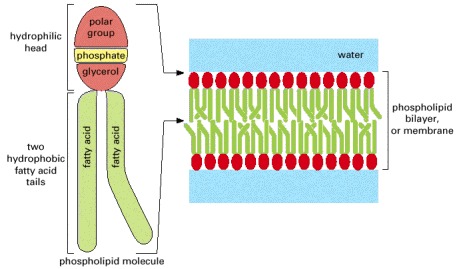
In an aqueous environment, the hydrophobic tails of phospholipids pack together to exclude water. Here they have formed a bilayer with the hydrophilic head of each phospholipid facing the water. Lipid bilayers are the basis for cell membranes, as discussed in detail in Chapter 10.
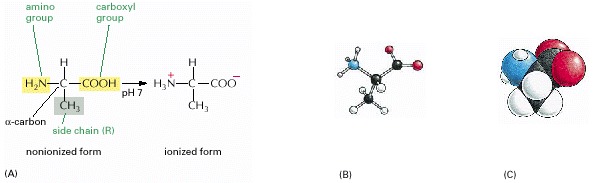
(A) In the cell, where the pH is close to 7, the free amino acid exists in its ionized form; but when it is incorporated into a polypeptide chain, the charges on the amino and carboxyl groups disappear. (B) A ball-and-stick model and (C) a space-filling model of alanine (H, white; C, black; O, red; N, blue).
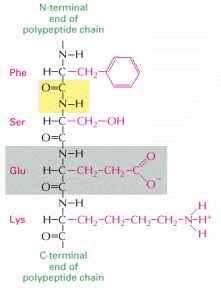
The four amino acids shown are linked together by three peptide bonds, one of which is highlighted in yellow. One of the amino acids is shaded in gray. The amino acid side chains are shown in red. The two ends of a polypeptide chain are chemically distinct. One end, the N-terminus, terminates in an amino group, and the other, the C-terminus, in a carboxyl group. The sequence is always read from the N-terminal end; hence this sequence is Phe-Ser-Glu-Lys.
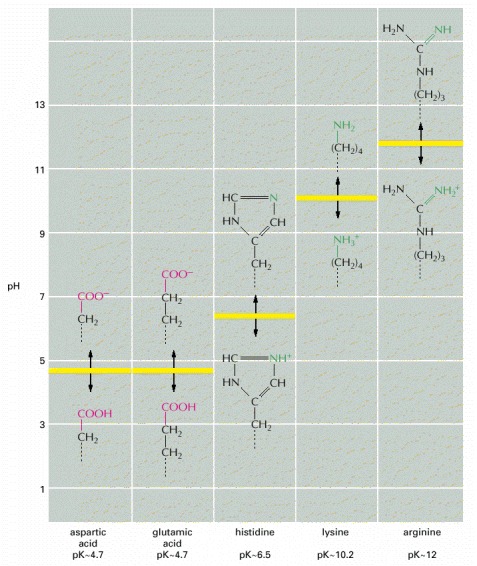
The five different side chains that can carry a charge are shown. Carboxylic acids can readily lose H+ in aqueous solution to form a negatively charged ion, which is denoted by the suffix “-ate,” as in aspartate or glutamate. A comparable situation exists for amines, which in aqueous solution can take up H+ to form a positively charged ion (which does not have a special name). These reactions are rapidly reversible, and the amounts of the two forms, charged and uncharged, depend on the pH of the solution. At a high pH, carboxylic acids tend to be charged and amines uncharged. At a low pH, the opposite is true—the carboxylic acids are uncharged and amines are charged. The pH at which exactly half of the carboxylic acid or amine residues are charged is known as the pK of that amino acid side chain.
In the cell the pH is close to 7, and almost all carboxylic acids and amines are in their fully charged form.
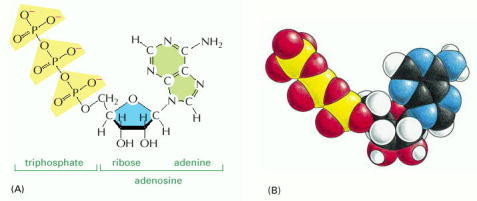
(A) Structural formula. (B) Space-filling model. In (B) the colors of the atoms are C, black; N, blue; H, white; O, red; and P, yellow.
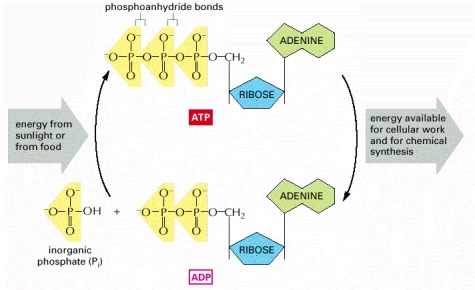
The energy-requiring formation of ATP from ADP and inorganic phosphate is coupled to the energy-yielding oxidation of foodstuffs (in animal cells, fungi, and some bacteria) or to the capture of light energy (in plant cells and some bacteria). The hydrolysis of this ATP back to ADP and inorganic phosphate in turn provides the energy to drive many cellular reactions.
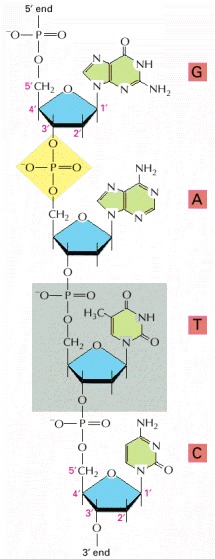
Four nucleotides are shown. One of the phosphodiester bonds that links adjacent nucleotide residues is highlighted in yellow, and one of the nucleotides is shaded in gray. Nucleotides are linked together by a phosphodiester linkage between specific carbon atoms of the ribose, known as the 5′ and 3′ atoms. For this reason, one end of a polynucleotide chain, the 5′ end, will have a free phosphate group and the other, the 3′ end, a free hydroxyl group. The linear sequence of nucleotides in a polynucleotide chain is commonly abbreviated by a one-letter code, and the sequence is always read from the 5′ end. In the example illustrated the sequence is G-A-T-C.
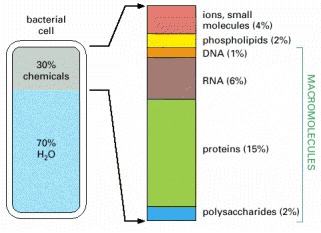
The approximate composition of a bacterial cell is shown by weight. The composition of an animal cell is similar (see Table 2-4).
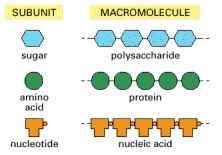
Each is a polymer formed from small molecules (called monomers, or subunits) linked together by covalent bonds.
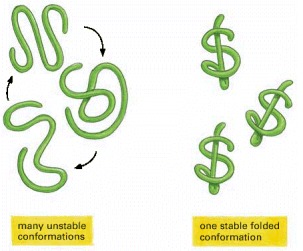
If the noncovalent bonds maintaining this stable conformation are disrupted, the molecule becomes a flexible chain that usually has no biological value.
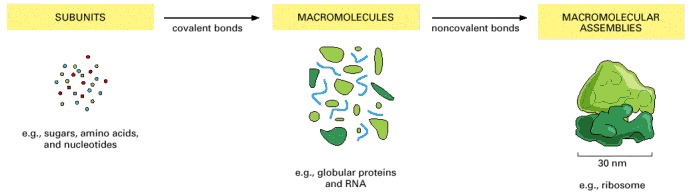
Ribosomes are a central part of the machinery that the cell uses to make proteins: each ribosome is formed as a complex of about 90 macromolecules (protein and RNA molecules).
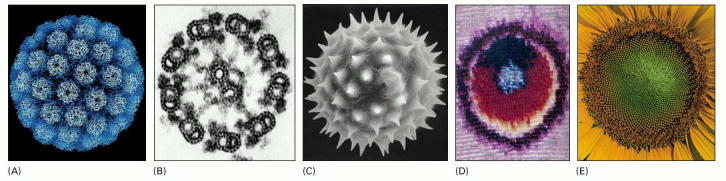
Well-defined, ornate, and beautiful spatial patterns can be found at every level of organization in living organisms. In order of increasing size: (A) protein molecules in the coat of a virus; (B) the regular array of microtubules seen in a cross section of a sperm tail; (C) surface contours of a pollen grain (a single cell); (D) close-up of the wing of a butterfly showing the pattern created by scales, each scale being the product of a single cell; (E) spiral array of seeds, made of millions of cells, in the head of a sunflower. (A, courtesy of R.A. Grant and J.M. Hogle; B, courtesy of Lewis Tilney; C, courtesy of Colin MacFarlane and Chris Jeffree; D and E, courtesy of Kjell B. Sandved.)

Each enzyme catalyzes a particular chemical reaction, leaving the enzyme unchanged. In this example, a set of enzymes acting in series converts molecule A to molecule F, forming a metabolic pathway.
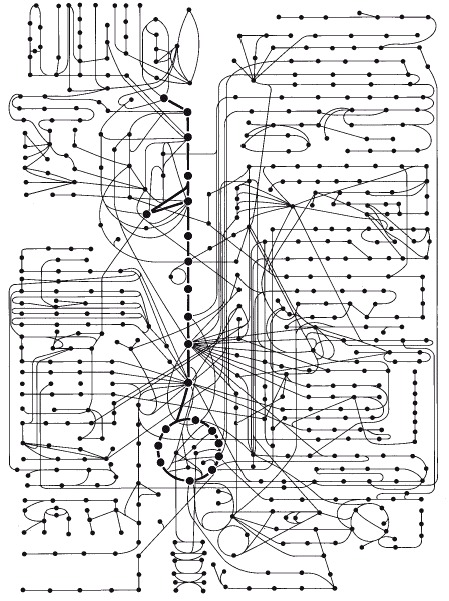
About 500 common metabolic reactions are shown diagrammatically, with each molecule in a metabolic pathway represented by a filled circle, as in the yellow box in Figure 2-34.
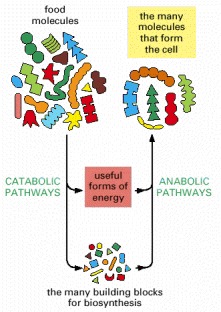
As suggested here, since a major portion of the energy stored in the chemical bonds of food molecules is dissipated as heat, the mass of food required by any organism that derives all of its energy from catabolism is much greater than the mass of the molecules that can be produced by anabolism.
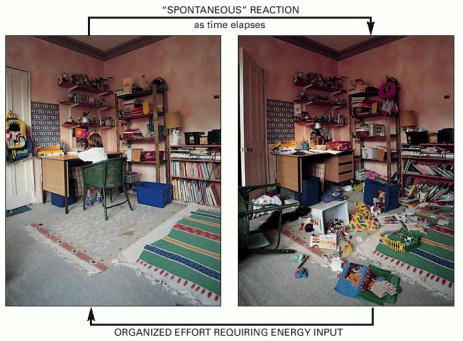
Reversing this tendency toward disorder requires an intentional effort and an input of energy: it is not spontaneous. In fact, from the second law of thermodynamics, we can be certain that the human intervention required will release enough heat to the environment to more than compensate for the reordering of the items in this room.
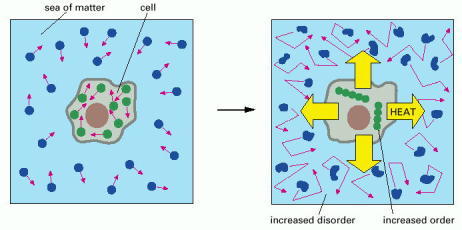
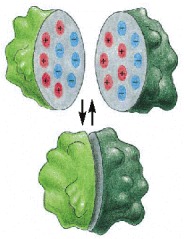
In the diagram on the left the molecules of both the cell and the rest of the universe (the sea of matter) are depicted in a relatively disordered state. In the diagram on the right the cell has taken in energy from food molecules and released heat by a reaction that orders the molecules the cell contains. Because the heat increases the disorder in the environment around the cell (depicted by the jagged arrows and distorted molecules, indicating the increased molecular motions caused by heat), the second law of thermodynamics—which states that the amount of disorder in the universe must always increase—is satisfied as the cell grows and divides. For a detailed discussion, see Panel 2-7 (pp. 122–123).
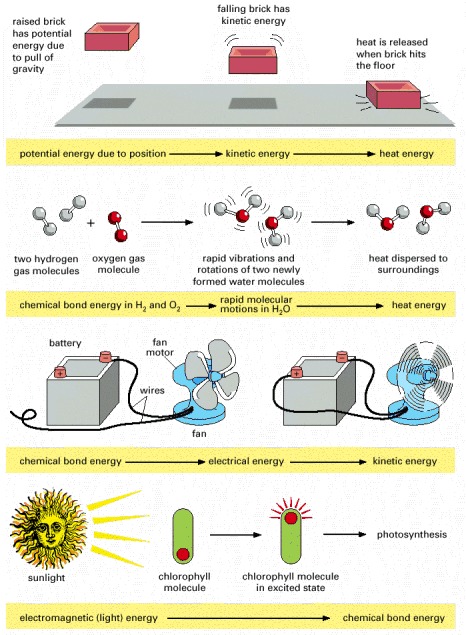
All energy forms are, in principle, interconvertible. In all these processes the total amount of energy is conserved; thus, for example, from the height and weight of the brick in the first example, we can predict exactly how much heat will be released when it hits the floor. In the second example, note that the large amount of chemical bond energy released when water is formed is initially converted to very rapid thermal motions in the two new water molecules; but collisions with other molecules almost instantaneously spread this kinetic energy evenly throughout the surroundings (heat transfer), making the new molecules indistinguishable from all the rest.
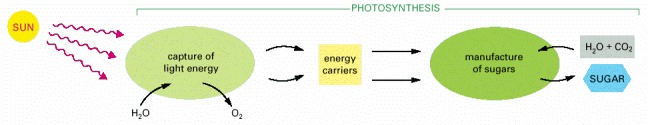
The two stages of photosynthesis. The energy carriers created in the first stage are two molecules that we discuss shortly—ATP and NADPH.
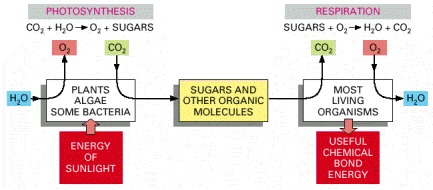
Photosynthesis uses the energy of sunlight to produce sugars and other organic molecules. These molecules in turn serve as food for other organisms. Many of these organisms carry out respiration, a process that uses O2 to form CO2 from the same carbon atoms that had been taken up as CO2 and converted into sugars by photosynthesis. In the process, the organisms that respire obtain the chemical bond energy that they need to survive. The first cells on the Earth are thought to have been capable of neither photosynthesis nor respiration (discussed in Chapter 14). However, photosynthesis must have preceded respiration on the Earth, since there is strong evidence that billions of years of photosynthesis were required before O2 had been released in sufficient quantity to create an atmosphere rich in this gas. (The Earth's atmosphere presently contains 20% O2.)
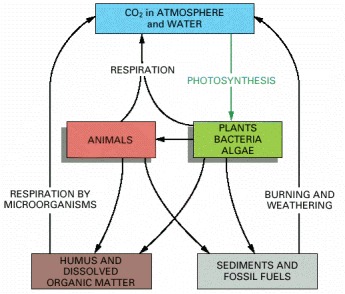
Individual carbon atoms are incorporated into organic molecules of the living world by the photosynthetic activity of plants, bacteria, and marine algae. They pass to animals, microorganisms, and organic material in soil and oceans in cyclic paths. CO2 is restored to the atmosphere when organic molecules are oxidized by cells or burned by humans as fossil fuels.
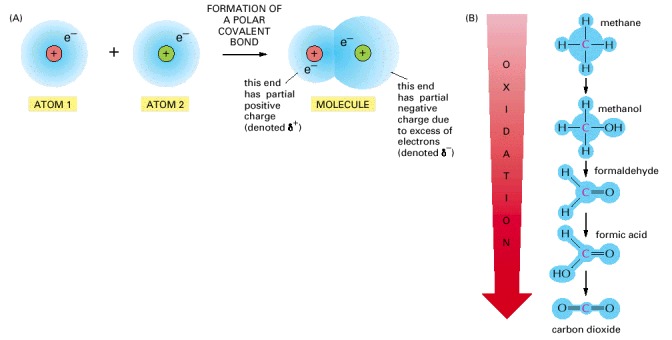
(A) When two atoms form a polar covalent bond (see p. 54), the atom ending up with a greater share of electrons is said to be reduced, while the other atom acquires a lesser share of electrons and is said to be oxidized. The reduced atom has acquired a partial negative charge (δ-) as the positive charge on the atomic nucleus is now more than equaled by the total charge of the electrons surrounding it, and conversely, the oxidized atom has acquired a partial positive charge (δ+). (B) The single carbon atom of methane can be converted to that of carbon dioxide by the successive replacement of its covalently bonded hydrogen atoms with oxygen atoms. With each step, electrons are shifted away from the carbon (as indicated by the blue shading), and the carbon atom becomes progressively more oxidized. Each of these steps is energetically favorable under the conditions present inside a cell.
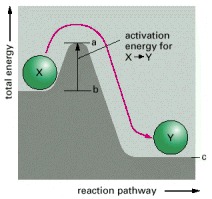
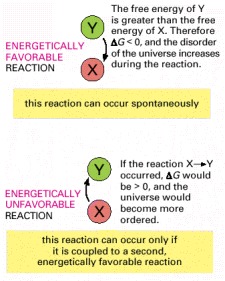
Compound X is in a stable state, and energy is required to convert it to compound Y, even though Y is at a lower overall energy level than X. This conversion will not take place, therefore, unless compound X can acquire enough activation energy (energy a minus energy b) from its surroundings to undergo the reaction that converts it into compound Y. This energy may be provided by means of an unusually energetic collision with other molecules. For the reverse reaction, Y → X, the activation energy will be much larger (energy a minus energy c); this reaction will therefore occur much more rarely. Activation energies are always positive; note, however, that the total energy change for the energetically favorable reaction X → Y is energy c minus energy b, a negative number.
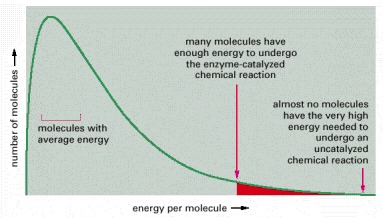
A population of identical substrate molecules will have a range of energies that is distributed as shown on the graph at any one instant. The varying energies come from collisions with surrounding molecules, which make the substrate molecules jiggle, vibrate, and spin. For a molecule to undergo a chemical reaction, the energy of the molecule must exceed the activation energy for that reaction; for most biological reactions, this almost never happens without enzyme catalysis. Even with enzyme catalysis, the substrate molecules must experience a particularly energetic collision to react, as indicated here.
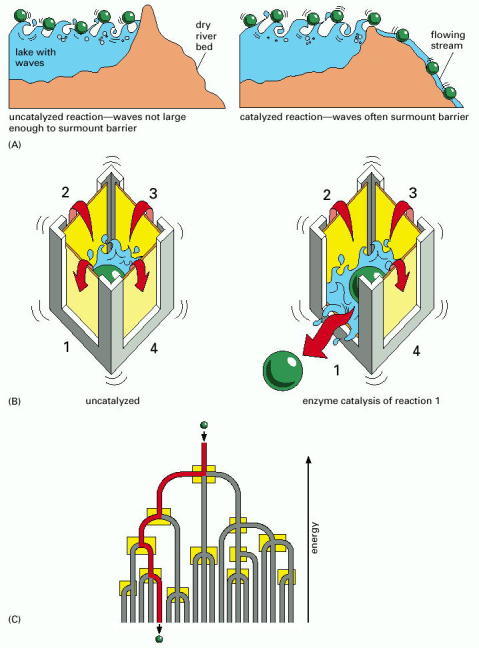
(A) A barrier dam is lowered to represent enzyme catalysis. The green ball represents a potential enzyme substrate (compound X) that is bouncing up and down in energy level due to constant encounters with waves (an analogy for the thermal bombardment of the substrate with the surrounding water molecules). When the barrier (activation energy) is lowered significantly, it allows the energetically favorable movement of the ball (the substrate) downhill. (B) The four walls of the box represent the activation energy barriers for four different chemical reactions that are all energetically favorable, in the sense that the products are at lower energy levels than the substrates. In the left-hand box, none of these reactions occurs because even the largest waves are not large enough to surmount any of the energy barriers. In the right-hand box, enzyme catalysis lowers the activation energy for reaction number 1 only; now the jostling of the waves allows passage of the molecule over this energy barrier only, inducing reaction 1. (C) A branching river with a set of barrier dams (yellow boxes) serves to illustrate how a series of enzyme-catalyzed reactions determines the exact reaction pathway followed by each molecule inside the cell.
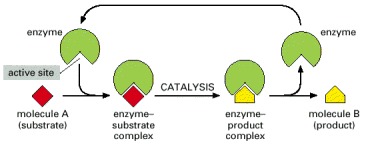
Each enzyme has an active site to which one or two substrate molecules bind, forming an enzyme-substrate complex. A reaction occurs at the active site, producing an enzyme-product complex. The product is then released, allowing the enzyme to bind additional substrate molecules.
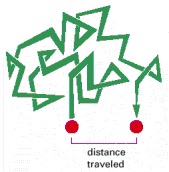
Molecules in solution move in a random fashion due to the continual buffeting they receive in collisions with other molecules. This movement allows small molecules to diffuse rapidly from one part of the cell to another, as described in the text.
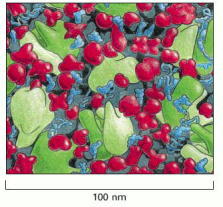
The drawing is approximately to scale and emphasizes the crowding in the cytoplasm. Only the macromolecules are shown: RNAs are shown in blue, ribosomes in green, and proteins in red. Enzymes and other macromolecules diffuse relatively slowly in the cytoplasm, in part because they interact with many other macromolecules; small molecules, by contrast, diffuse nearly as rapidly as they do in water. (Adapted from D.S. Goodsell, Trends Biochem. Sci. 16:203–206, 1991.)
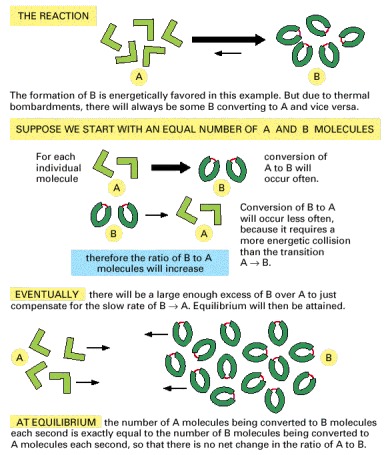
When a reaction reaches equilibrium, the forward and backward flux of reacting molecules are equal and opposite.
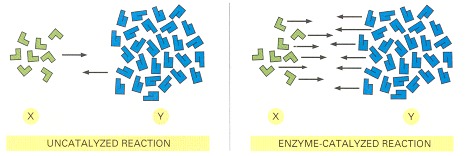
Enzymes, like all catalysts, speed up the forward and backward rates of a reaction by the same factor. Therefore, for both the catalyzed and the uncatalyzed reactions shown here, the number of molecules undergoing the transition X → Y is equal to the number of molecules undergoing the transition Y → X when the ratio of Y molecules to X molecules is 3.5 to 1. In other words, the two reactions reach equilibrium at exactly the same point.
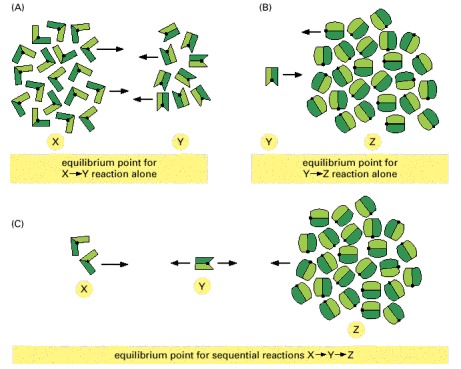
(A) At equilibrium, there are twice as many X molecules as Y molecules, because X is of lower energy than Y. (B) At equilibrium, there are 25 times more Z molecules than Y molecules, because Z is of much lower energy than Y. (C) If the reactions in (A) and (B) are coupled, nearly all of the X molecules will be converted to Z molecules, as shown.
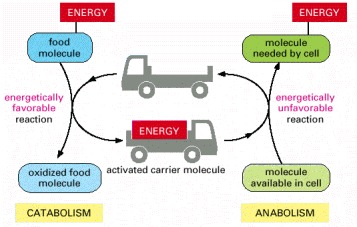
By serving as energy shuttles, activated carrier molecules perform their function as go-betweens that link the breakdown of food molecules and the release of energy (catabolism) to the energy-requiring biosynthesis of small and large organic molecules (anabolism).
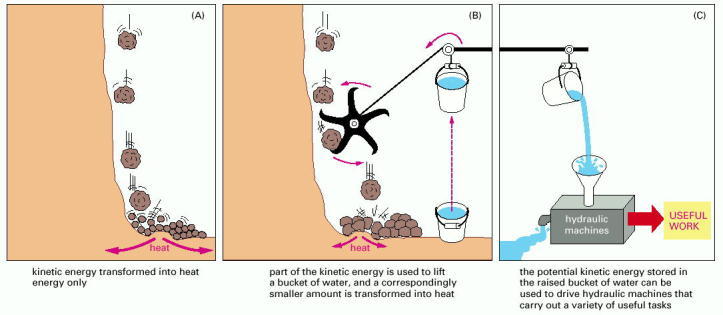
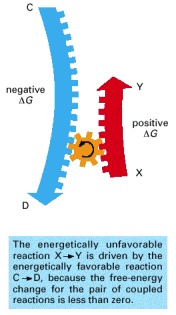
The spontaneous reaction shown in (A) could serve as an analogy for the direct oxidation of glucose to CO2 and H2O, which produces heat only. In (B) the same reaction is coupled to a second reaction; this second reaction could serve as an analogy for the synthesis of activated carrier molecules. The energy produced in (B) is in a more useful form than in (A) and can be used to drive a variety of otherwise energetically unfavorable reactions (C).
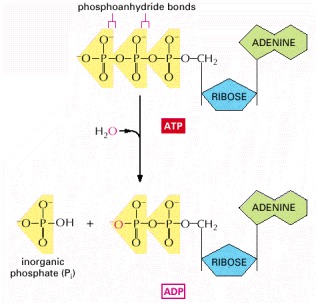
The two outermost phosphates in ATP are held to the rest of the molecule by high-energy phosphoanhydride bonds and are readily transferred. As indicated, water can be added to ATP to form ADP and inorganic phosphate (Pi). This hydrolysis of the terminal phosphate of ATP yields between 11 and 13 kcal/mole of usable energy, depending on the intracellular conditions. The large negative ΔG of this reaction arises from a number of factors. Release of the terminal phosphate group removes an unfavorable repulsion between adjacent negative charges; in addition, the inorganic phosphate ion (Pi) released is stabilized by resonance and by favorable hydrogen-bond formation with water.
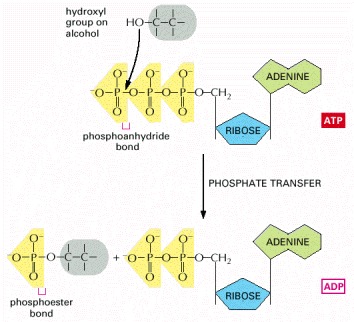
Because an energy-rich phosphoanhydride bond in ATP is converted to a phosphoester bond, this reaction is energetically favorable, having a large negative ΔG. Reactions of this type are involved in the synthesis of phospholipids and in the initial steps of reactions that catabolize sugars.
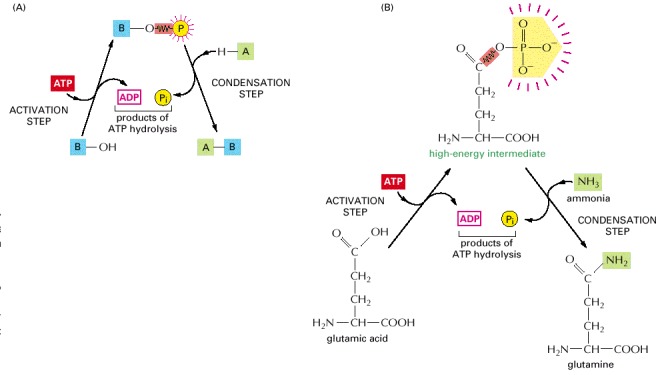
(A) Schematic illustration of the formation of A-B in the condensation reaction described in the text. (B) The biosynthesis of the common amino acid glutamine. Glutamic acid is first converted to a high-energy phosphorylated intermediate (corresponding to the compound B-O-PO3 described in the text), which then reacts with ammonia (corresponding to A-H) to form glutamine. In this example both steps occur on the surface of the same enzyme, glutamine synthase. Note that, for clarity, the amino acids are shown in their uncharged form.
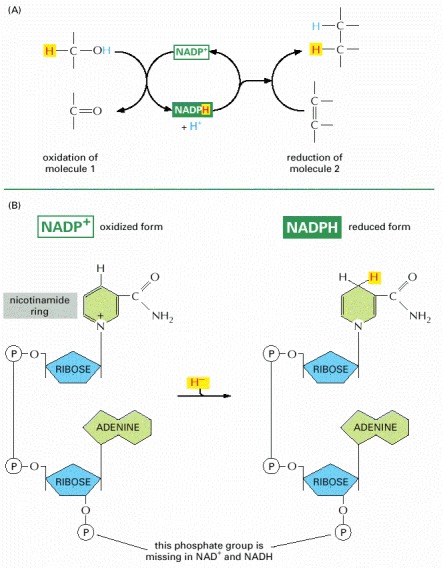
(A) NADPH is produced in reactions of the general type shown on the left, in which two hydrogen atoms are removed from a substrate. The oxidized form of the carrier molecule, NADP+, receives one hydrogen atom plus an electron (a hydride ion), and the proton (H+) from the other H atom is released into solution. Because NADPH holds its hydride ion in a high-energy linkage, the added hydride ion can easily be transferred to other molecules, as shown on the right. (B) The structure of NADP+ and NADPH. The part of the NADP+ molecule known as the nicotinamide ring accepts two electrons together with a proton (the equivalent of a hydride ion, H-), forming NADPH. The molecules NAD+ and NADH are identical in structure to NADP+ and NADPH, respectively, except that the indicated phosphate group is absent from both.
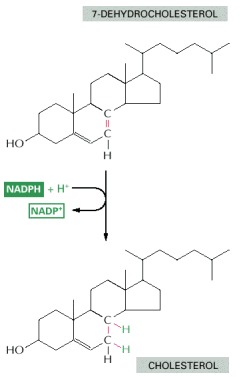
As in many other biosynthetic reactions, the reduction of the C=C bond is achieved by the transfer of a hydride ion from the carrier molecule NADPH, plus a proton (H+) from the solution.
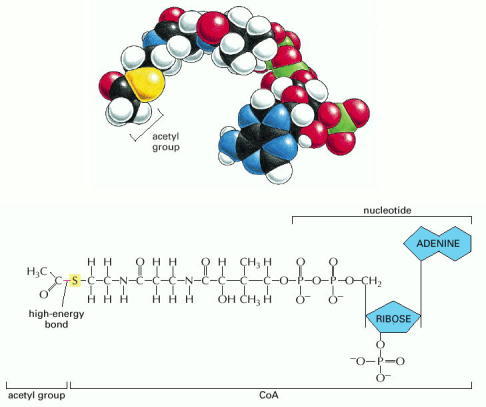
A space-filling model is shown above the structure. The sulfur atom (yellow) forms a thioester bond to acetate. Because this is a high-energy linkage, releasing a large amount of free energy when it is hydrolyzed, the acetate molecule can be readily transferred to other molecules.
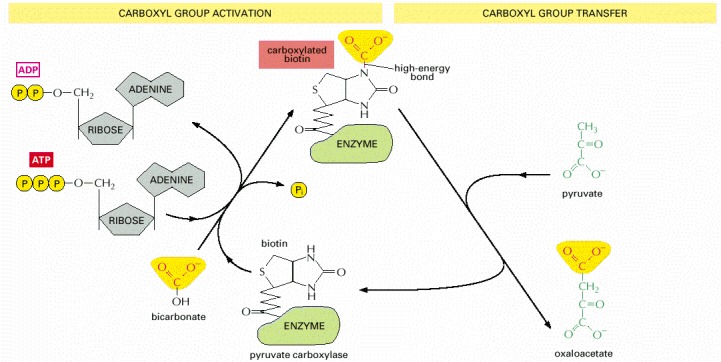
Carboxylated biotin is used by the enzyme pyruvate carboxylase to transfer a carboxyl group in the production of oxaloacetate, a molecule needed for the citric acid cycle. The acceptor molecule for this group transfer reaction is pyruvate. Other enzymes use biotin to transfer carboxyl groups to other acceptor molecules. Note that synthesis of carboxylated biotin requires energy that is derived from ATP—a general feature of many activated carriers.
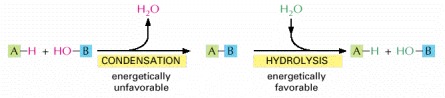
The macromolecules of the cell are polymers that are formed from subunits (or monomers) by a condensation reaction and are broken down by hydrolysis. The condensation reactions are all energetically unfavorable.
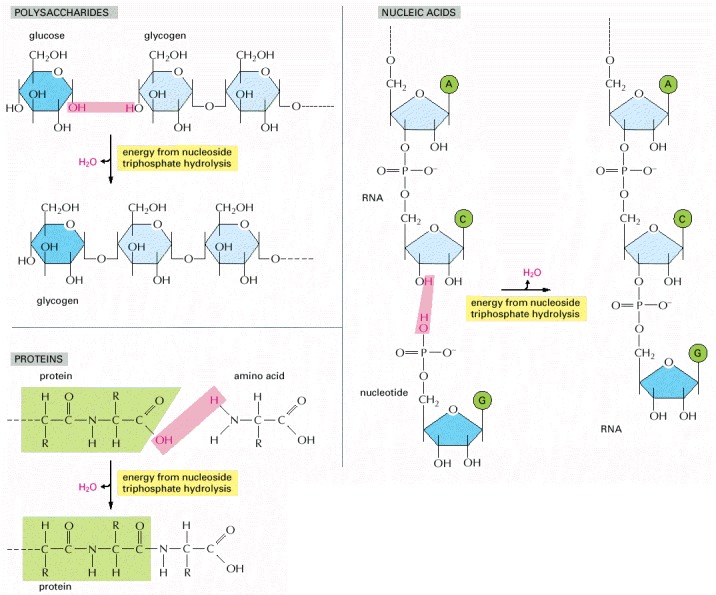
Synthesis of each kind of biological polymer involves the loss of water in a condensation reaction. Not shown is the consumption of high-energy nucleoside triphosphates that is required to activate each monomer prior to its addition. In contrast, the reverse reaction—the breakdown of all three types of polymers—occurs by the simple addition of water (hydrolysis).
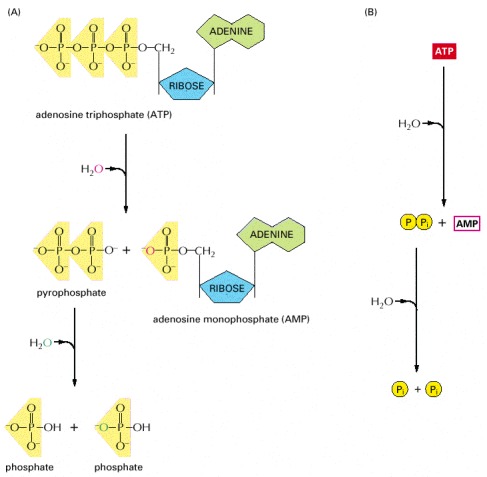
This route releases about twice as much free energy as the reaction shown earlier in Figure 2-57. (A) In the two successive hydrolysis reactions, oxygen atoms from the participating water molecules are retained in the products, as indicated, whereas the hydrogen atoms dissociate to form free hydrogen ions, (H+, not shown). (B) Diagram of overall reaction in summary form.
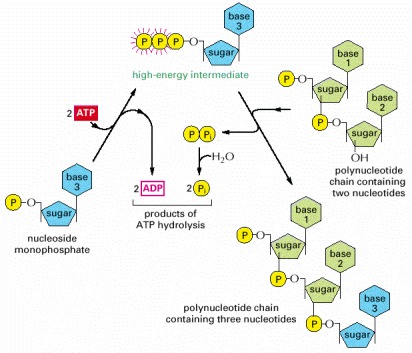
In the first step, a nucleoside monophosphate is activated by the sequential transfer of the terminal phosphate groups from two ATP molecules. The high-energy intermediate formed—a nucleoside triphosphate—exists free in solution until it reacts with the growing end of an RNA or a DNA chain with release of pyrophosphate. Hydrolysis of the latter to inorganic phosphate is highly favorable and helps to drive the overall reaction in the direction of polynucleotide synthesis. For details, see Chapter 5.
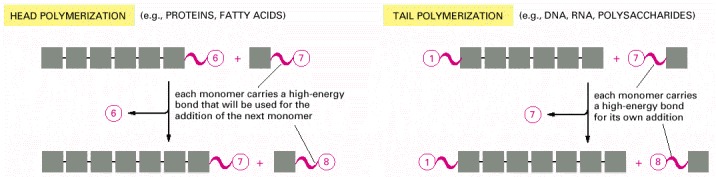
The head growth of polymers is compared with its alternative tail growth. As indicated, these two mechanisms are used to produce different biological macromolecules.
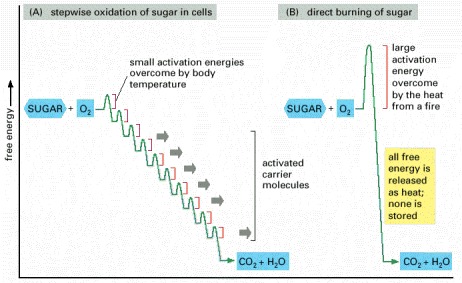
(A) In the cell, enzymes catalyze oxidation via a series of small steps in which free energy is transferred in conveniently sized packets to carrier molecules—most often ATP and NADH. At each step, an enzyme controls the reaction by reducing the activation energy barrier that has to be surmounted before the specific reaction can occur. The total free energy released is exactly the same in (A) and (B). But if the sugar was instead oxidized to CO2 and H2O in a single step, as in (B), it would release an amount of energy much larger than could be captured for useful purposes.
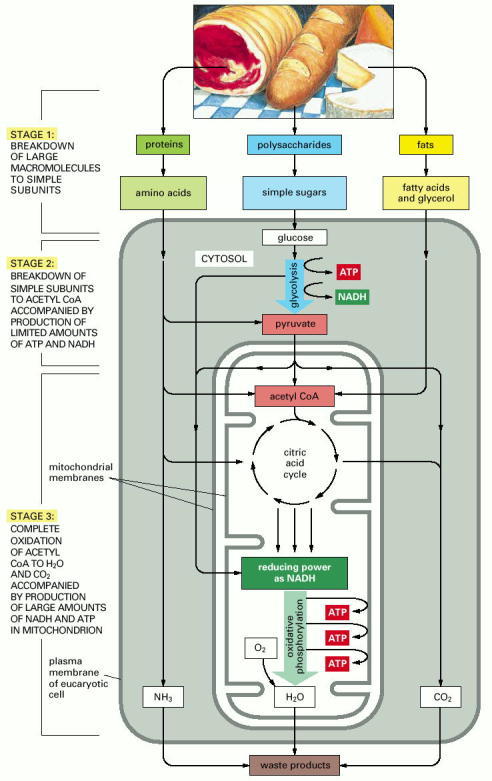
This series of reactions produces ATP, which is then used to drive biosynthetic reactions and other energy-requiring processes in the cell. Stage 1 occurs outside cells. Stage 2 occurs mainly in the cytosol, except for the final step of conversion of pyruvate to acetyl groups on acetyl CoA, which occurs in mitochondria. Stage 3 occurs in mitochondria.
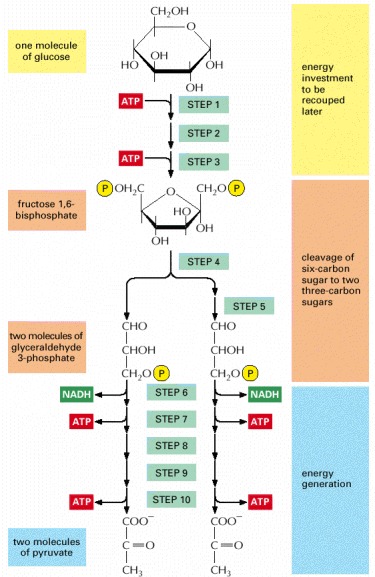
Each of the 10 steps shown is catalyzed by a different enzyme. Note that step 4 cleaves a six-carbon sugar into two three-carbon sugars, so that the number of molecules at every stage after this doubles. As indicated, step 6 begins the energy generation phase of glycolysis, which causes the net synthesis of ATP and NADH molecules (see also Panel 2-8).
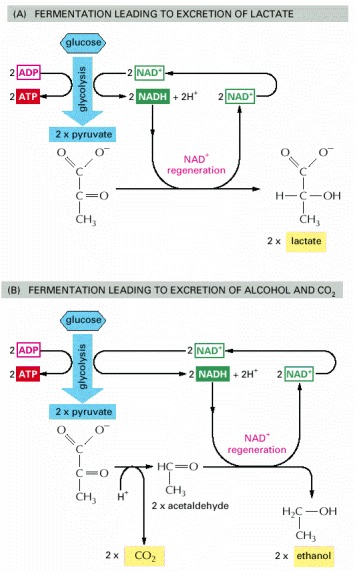
(A) When inadequate oxygen is present, for example, in a muscle cell undergoing vigorous contraction, the pyruvate produced by glycolysis is converted to lactate as shown. This reaction regenerates the NAD+ consumed in step 6 of glycolysis, but the whole pathway yields much less energy overall than complete oxidation. (B) In some organisms that can grow anaerobically, such as yeasts, pyruvate is converted via acetaldehyde into carbon dioxide and ethanol. Again, this pathway regenerates NAD+ from NADH, as required to enable glycolysis to continue. Both (A) and (B) are examples of fermentations.
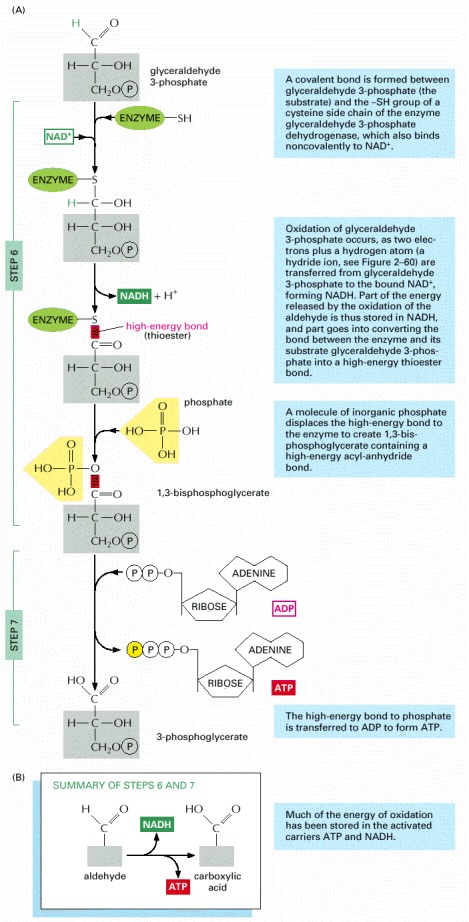
In these steps the oxidation of an aldehyde to a carboxylic acid is coupled to the formation of ATP and NADH. (A) Step 6 begins with the formation of a covalent bond between the substrate (glyceraldehyde 3-phosphate) and an -SH group exposed on the surface of the enzyme (glyceraldehyde 3-phosphate dehydrogenase). The enzyme then catalyzes transfer of hydrogen (as a hydride ion—a proton plus two electrons) from the bound glyceraldehyde 3-phosphate to a molecule of NAD+. Part of the energy released in this oxidation is used to form a molecule of NADH and part is used to convert the original linkage between the enzyme and its substrate to a high-energy thioester bond (shown in red). A molecule of inorganic phosphate then displaces this high-energy bond on the enzyme, creating a high-energy sugar-phosphate bond instead (red). At this point the enzyme has not only stored energy in NADH, but also coupled the energetically favorable oxidation of an aldehyde to the energetically unfavorable formation of a high-energy phosphate bond. The second reaction has been driven by the first, thereby acting like the “paddle wheel” coupler in Figure 2-56.
In reaction step 7, the high-energy sugar-phosphate intermediate just made, 1,3-bisphosphoglycerate, binds to a second enzyme, phosphoglycerate kinase. The reactive phosphate is transferred to ADP, forming a molecule of ATP and leaving a free carboxylic acid group on the oxidized sugar. (B) Summary of the overall chemical change produced by reactions 6 and 7.
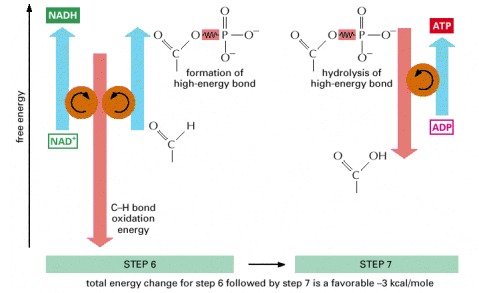
The C-H bond oxidation energy drives the formation of both NADH and a high-energy phosphate bond. The breakage of the high-energy bond then drives ATP formation.
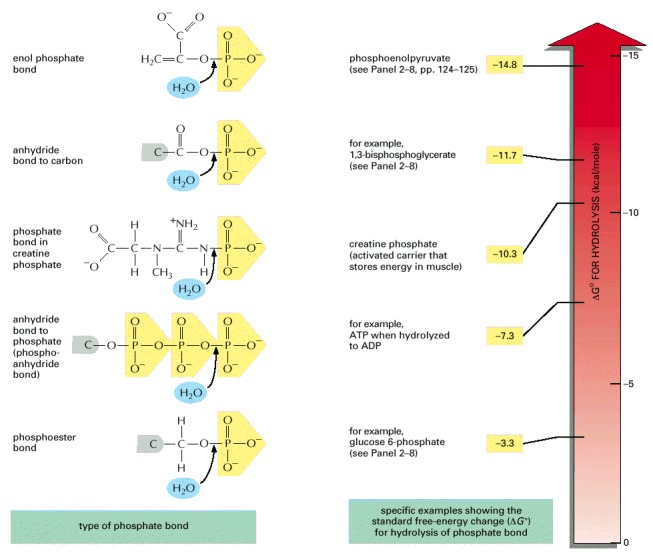
The transfer of a phosphate group from any molecule 1 to any molecule 2 is energetically favorable if the standard free-energy change (ΔG°) for the hydrolysis of the phosphate bond in molecule 1 is more negative than that for hydrolysis of the phosphate bond in molecule 2. Thus, for example, a phosphate group is readily transferred from 1,3-bisphosphoglycerate to ADP, forming ATP. Note that the hydrolysis reaction can be viewed as the transfer of the phosphate group to water.
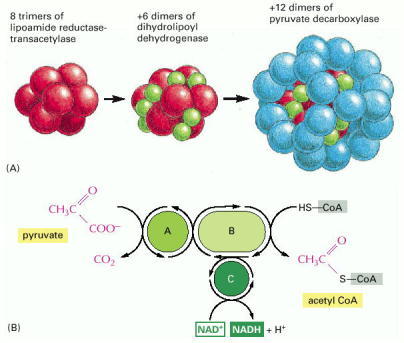
(A) The structure of the pyruvate dehydrogenase complex, which contains 60 polypeptide chains. This is an example of a large multienzyme complex in which reaction intermediates are passed directly from one enzyme to another. In eucaryotic cells it is located in the mitochondrion. (B) The reactions carried out by the pyruvate dehydrogenase complex. The complex converts pyruvate to acetyl CoA in the mitochondrial matrix; NADH is also produced in this reaction. A, B, and C are the three enzymes pyruvate decarboxylase, lipoamide reductase-transacetylase, and dihydrolipoyl dehydrogenase, respectively. These enzymes are illustrated in (A); their activities are linked as shown.
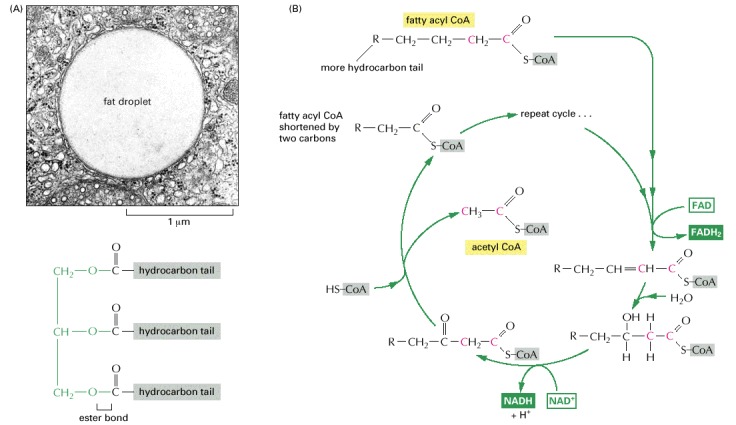
(A) Electron micrograph of a lipid droplet in the cytoplasm (top), and the structure of fats (bottom). Fats are triacylglycerols. The glycerol portion, to which three fatty acids are linked through ester bonds, is shown here in green. Fats are insoluble in water and form large lipid droplets in the specialized fat cells (called adipocytes) in which they are stored. (B) The fatty acid oxidation cycle. The cycle is catalyzed by a series of four enzymes in the mitochondrion. Each turn of the cycle shortens the fatty acid chain by two carbons (shown in red) and generates one molecule of acetyl CoA and one molecule each of NADH and FADH2. The structure of FADH2 will be presented in Figure 2-80B. (A, courtesy of Daniel S. Friend.)
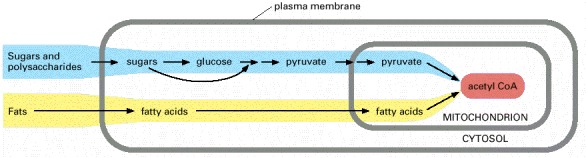
The mitochondrion in eucaryotic cells is the place where acetyl CoA is produced from both types of major food molecules. It is therefore the place where most of the cell's oxidation reactions occur and where most of its ATP is made.
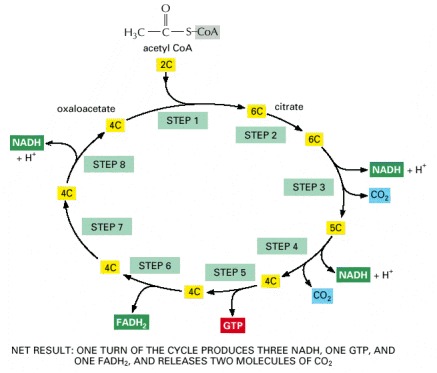
The reaction of acetyl CoA with oxaloacetate starts the cycle by producing citrate (citric acid). In each turn of the cycle, two molecules of CO2 are produced as waste products, plus three molecules of NADH, one molecule of GTP, and one molecule of FADH2. The number of carbon atoms in each intermediate is shown in a yellow box. For details, see Panel 2-9 (pp. 126–127).
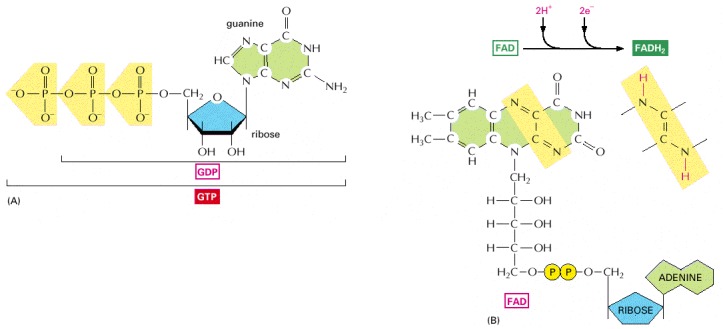
(A) GTP and GDP are close relatives of ATP and ADP, respectively. (B) FADH2 is a carrier of hydrogens and high-energy electrons, like NADH and NADPH. It is shown here in its oxidized form (FAD) with the hydrogen-carrying atoms highlighted in yellow.
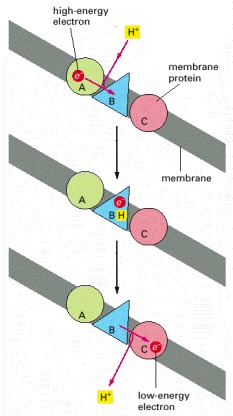
A high-energy electron (derived, for example, from the oxidation of a metabolite) is passed sequentially by carriers A, B, and C to a lower energy state. In this diagram carrier B is arranged in the membrane in such a way that it takes up H+ from one side and releases it to the other as the electron passes. The result is an H+ gradient. This gradient represents a form of stored energy that is harnessed by other membrane proteins to drive the formation of ATP.
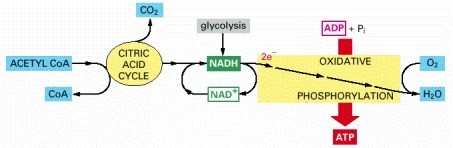
Molecules of NADH and FADH2 (FADH2 is not shown) are produced by the citric acid cycle. These activated carriers donate high-energy electrons that are eventually used to reduce oxygen gas to water. A major portion of the energy released during the transfer of these electrons along an electron-transfer chain in the mitochondrial inner membrane (or in the plasma membrane of bacteria) is harnessed to drive the synthesis of ATP: hence the name oxidative phosphorylation.
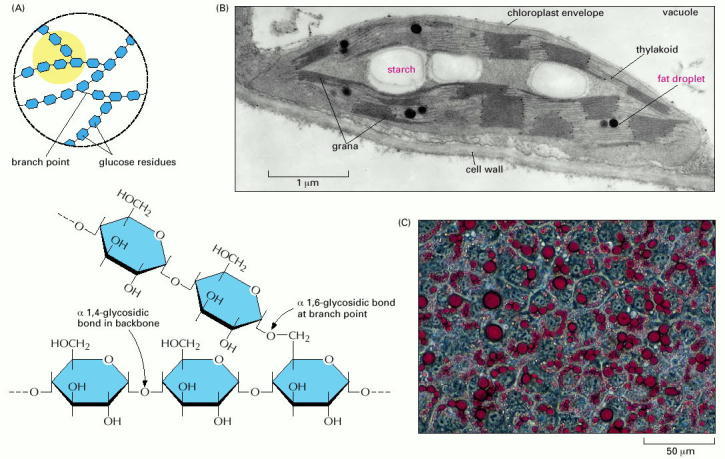
(A) The structures of starch and glycogen, the storage form of sugars in plants and animals, respectively. Both are storage polymers of the sugar glucose and differ only in the frequency of branch points (the region in yellow is shown enlarged below). There are many more branches in glycogen than in starch. (B) A thin section of a single chloroplast from a plant cell, showing the starch granules and lipid droplets that have accumulated as a result of the biosyntheses occurring there. (C) Fat droplets (stained red) beginning to accumulate in developing fat cells of an animal. (B, courtesy of K. Plaskitt; C, courtesy of Ronald M. Evans and Peter Totonoz.)
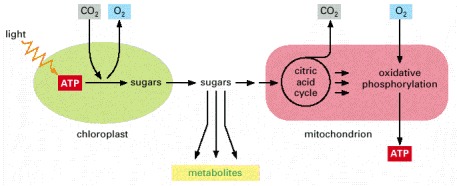
In plants, the chloroplasts and mitochondria collaborate to supply cells with metabolites and ATP.
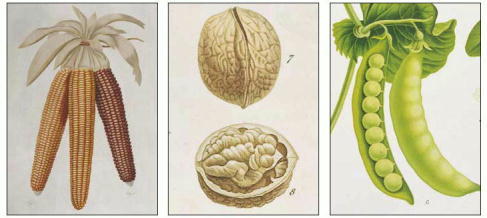
Corn, nuts, and peas all contain rich stores of starch and fat that provide the young plant embryo in the seed with energy and building blocks for biosynthesis. (Courtesy of the John Innes Foundation.)
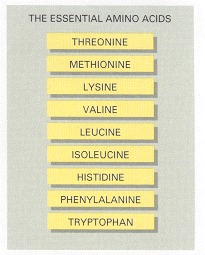
These cannot be synthesized by human cells and so must be supplied in the diet.
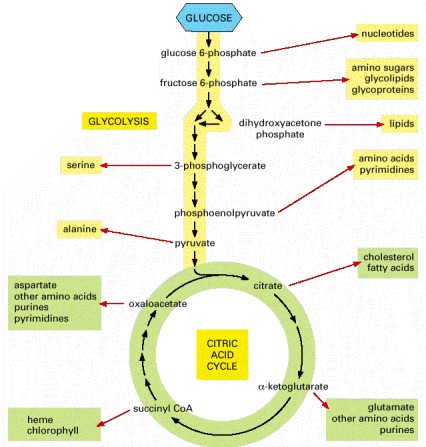
The amino acids, nucleotides, lipids, sugars, and other molecules—shown here as products—in turn serve as the precursors for the many macromolecules of the cell. Each black arrow in this diagram denotes a single enzyme-catalyzed reaction; the red arrows generally represent pathways with many steps that are required to produce the indicated products.
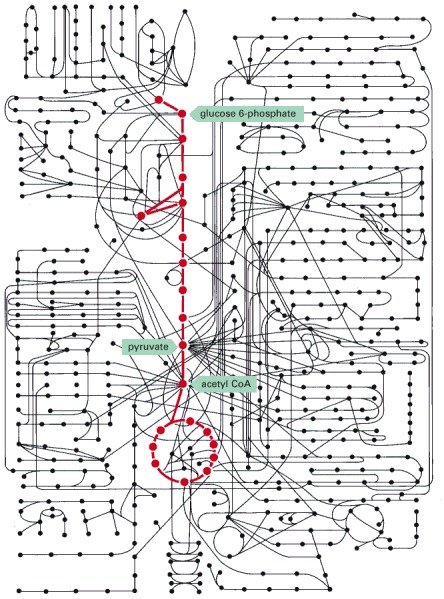
Some 500 metabolic reactions of a typical cell are shown schematically with the reactions of glycolysis and the citric acid cycle in red. Other reactions either lead into these two central pathways—delivering small molecules to be catabolized with production of energy—or they lead outward and thereby supply carbon compounds for the purpose of biosynthesis.
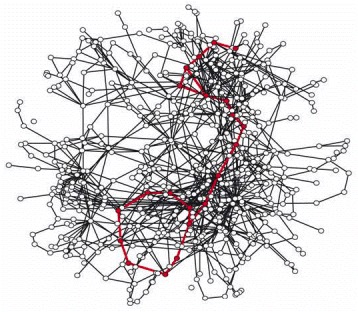
As in Figure 2-88, the reactions of glycolysis and the citric acid cycle are highlighted in red. This metabolic map is unusual in making use of three-dimensions, so as to allow the many interactions between pathways to be emphasized. It is meant to be viewed on a computer screen, where it can be rotated and inspected from every angle. (From H. Jeong, S.P. Mason, A-L. Barabási and N. Oltava, Nature 411:41–42, 2001. © Macmillan Magazines Ltd.)
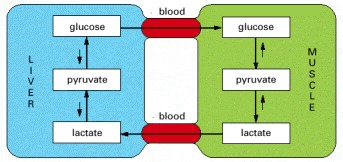
The principal fuel of actively contracting muscle cells is glucose, much of which is supplied by liver cells. Lactic acid, the end product of anaerobic glucose breakdown by glycolysis in muscle, is converted back to glucose in the liver by the process of gluconeogenesis.