Chapter 17.1 - Figures
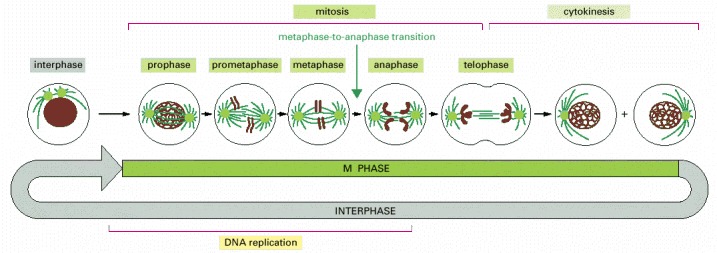
The easily visible processes of nuclear division (mitosis) and cell division (cytokinesis), collectively called M phase, typically occupy only a small fraction of the cell cycle. The other, much longer, part of the cycle is known as interphase. The five stages of mitosis are shown: an abrupt change in the biochemical state of the cell occurs at the transition from metaphase to anaphase. A cell can pause in metaphase before this transition point, but once the point has been passed, the cell carries on to the end of mitosis and through cytokinesis into interphase. Note that DNA replication occurs in interphase. The part of interphase where DNA is replicated is called S phase (not shown).
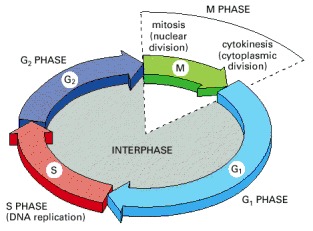
The cell grows continuously in interphase, which consists of three phases: DNA replication is confined to S phase; G1 is the gap between M phase and S phase, while G2 is the gap between S phase and M phase. In M phase, the nucleus and then the cytoplasm divide.
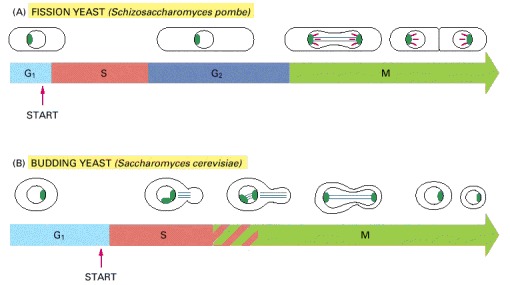
(A) The fission yeast has a typical eucaryotic cell cycle with G1, S, G2, and M phases. In contrast with what happens in higher eucaryotic cells, however, the nuclear envelope of the yeast cell does not break down during M phase. The microtubules of the mitotic spindle (light green) form inside the nucleus and are attached to spindle pole bodies (dark green) at its periphery. The cell divides by forming a partition (known as the cell plate) and splitting in two. The condensed mitotic chromosomes (red) are readily visible in fission yeast, but are less easily seen in budding yeasts. (B) The budding yeast has normal G1 and S phases but does not have a normal G2 phase. Instead, a microtubule-based spindle begins to form inside the nucleus early in the cycle, during S phase. In contrast with a fission yeast cell, the cell divides by budding. As in fission yeasts, but in contrast with higher eucaryotic cells, the nuclear envelope remains intact during mitosis, and the spindle forms within the nucleus.
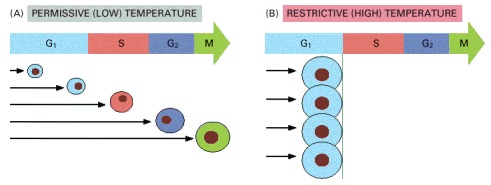
(A) At the permissive (low) temperature, the cells divide normally and are found in all phases of the cycle (the phase of the cell is indicated by its color). (B) On warming to the restrictive (high) temperature, at which the mutant gene product functions abnormally, the mutant cells continue to progress through the cycle until they come to the specific step that they are unable to complete (initiation of S phase, in this example). Because the cdc mutants still continue to grow, they become abnormally large. By contrast, non-cdc mutants, if deficient in a process that is necessary throughout the cycle for biosynthesis and growth (such as ATP production), halt haphazardly at any stage of the cycle—depending on when their biochemical reserves run out (not shown).
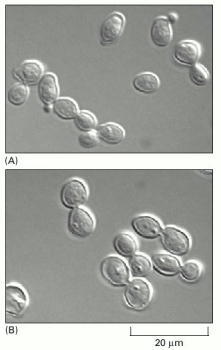
(A) In a normal population of proliferating yeast cells, buds vary in size according to the cell-cycle stage. (B) In a cdc15 mutant grown at the restrictive temperature, cells complete anaphase but cannot complete the exit from mitosis and cytokinesis. As a result, they arrest uniformly with the large buds, which are characteristic of late M phase. (Courtesy of Jeff Ubersax.)
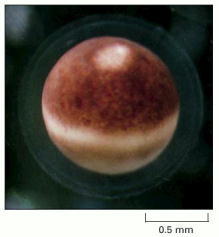
The pale spot near the top shows the site of the nucleus, which has displaced the brown pigment in the surface layer of the egg cytoplasm. Although this cannot be seen in the picture, the nuclear envelope has broken down during the process of egg maturation. (Courtesy of Tony Mills.)
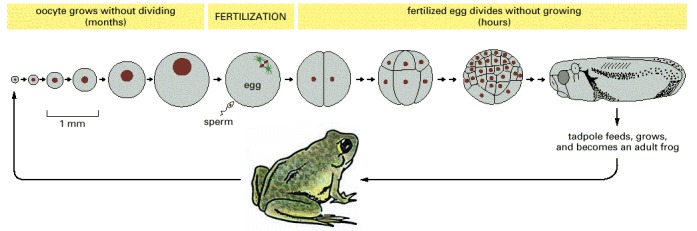
The oocyte grows without dividing for many months in the ovary of the mother frog and finally matures into an egg. Upon fertilization, the egg cleaves very rapidly—initially at a rate of one division cycle every 30 minutes—forming a multicellular tadpole within a day or two. The cells get progressively smaller with each division, and the embryo remains the same size. Growth starts only when the tadpole begins feeding. The drawings in the top row are all on the same scale (but the frog below is not).
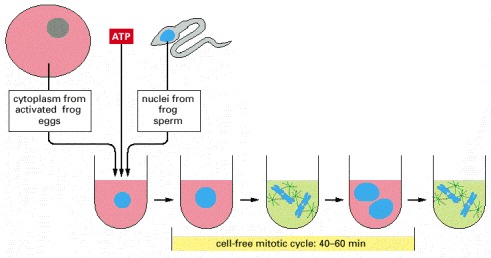
A large batch of activated frog eggs is broken open by gentle centrifugation, which also separates the cytoplasm from other cell components. The undiluted cytoplasm is collected, and sperm nuclei are added to it, together with ATP. The sperm nuclei decondense and then go through repeated cycles of DNA replication and mitosis, indicating that the cell-cycle control system is operating in this cell-free cytoplasmic extract.
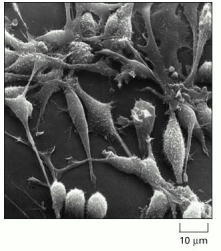
The cells in this scanning electron micrograph are rat fibroblasts. (Courtesy of Guenter Albrecht-Buehler.)
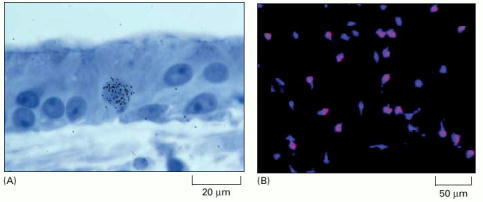
(A) The tissue has been exposed for a short period to 3H-thymidine and the labeled cells have been visualized by autoradiography. Silver grains (black dots) in the photographic emulsion over a nucleus indicate that the cell incorporated 3H-thymidine into its DNA and thus was in S phase some time during the labeling period. In this specimen, showing the sensory epithelium from the inner ear of a chicken, the presence of an S-phase cell is evidence of cell proliferation occurring in response to damage. (B) An immunofluorescence micrograph of BrdU-labeled glial precursor cells in culture. The cells were exposed to BrdU for 4 h and were then fixed and labeled with fluorescent anti-BrdU antibodies (red). All the cells are stained with a blue fluorescent dye. (A, courtesy of Mark Warchol and Jeffrey Corwin; B, from D. Tang, Y. Tokumoto, and M. Raff, J. Cell Biol. 148:971–984, 2000. © The Rockefeller University Press.)
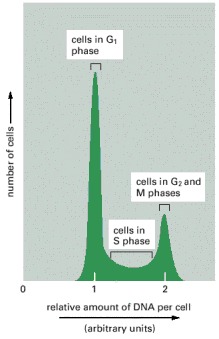
This graph shows typical results obtained for a proliferating cell population when the DNA content of its individual cells is determined in a flow cytometer. (A flow cytometer, also called a fluorescence-activated cell sorter, or FACS, can also be used to sort cells according to their fluorescence—see Figure 8-2). The cells analyzed here were stained with a dye that becomes fluorescent when it binds to DNA, so that the amount of fluorescence is directly proportional to the amount of DNA in each cell. The cells fall into three categories: those that have an unreplicated complement of DNA and are therefore in G1 phase, those that have a fully replicated complement of DNA (twice the G1 DNA content) and are in G2 or M phase, and those that have an intermediate amount of DNA and are in S phase. The distribution of cells in the case illustrated indicates that there are greater numbers of cells in G1 phase than in G2 + M phase, showing that G1 is longer than G2 + M in this population.
Chapter 17.2 - Figures
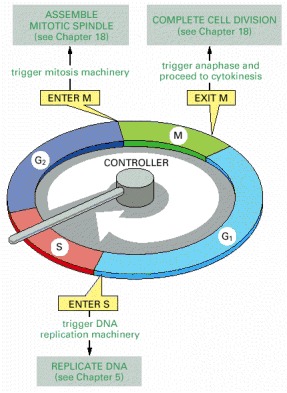
The essential processes of the cell cycle—such as DNA replication, mitosis, and cytokinesis—are triggered by a cell-cycle control system. By analogy with a washing machine, the cell-cycle control system is shown here as a central arm—the controller—that rotates clockwise, triggering essential processes when it reaches specific points on the outer dial.
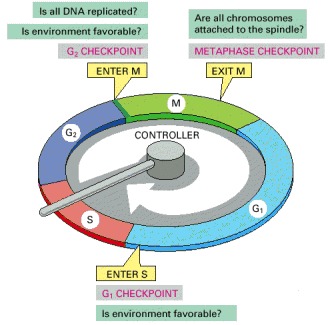
Information about the completion of cell-cycle events, as well as signals from the environment, can cause the control system to arrest the cycle at specific checkpoints. The most prominent checkpoints occur at locations marked with yellow boxes.
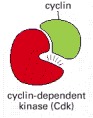
A complex of cyclin with Cdk acts as a protein kinase to trigger specific cell-cycle events. Without cyclin, Cdk is inactive.
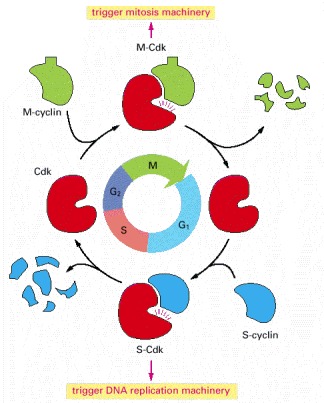
Cdk associates successively with different cyclins to trigger the different events of the cycle. Cdk activity is usually terminated by cyclin degradation. For simplicity, only the cyclins that act in S phase (S-cyclin) and M phase (M-cyclin) are shown, and they interact with a single Cdk; as indicated, the resulting cyclin-Cdk complexes are referred to as S-Cdk and M-Cdk, respectively.
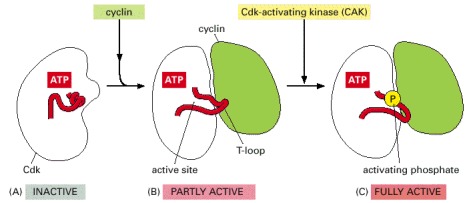
These drawings are based on three-dimensional structures of human Cdk2, as determined by x-ray crystallography. The location of the bound ATP is indicated. The enzyme is shown in three states. (A) In the inactive state, without cyclin bound, the active site is blocked by a region of the protein called the T-loop (red). (B) The binding of cyclin causes the T-loop to move out of the active site, resulting in partial activation of the Cdk2. (C) Phosphorylation of Cdk2 (by CAK) at a threonine residue in the T-loop further activates the enzyme by changing the shape of the T-loop, improving the ability of the enzyme to bind its protein substrates.
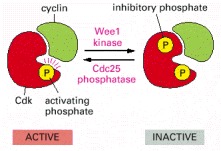
The active cyclin-Cdk complex is turned off when the kinase Wee1 phosphorylates two closely spaced sites above the active site. Removal of these phosphates by the phosphatase Cdc25 results in activation of the cyclin-Cdk complex. For simplicity, only one inhibitory phosphate is shown. The activating phosphate is added by CAK, as shown in Figure 17-17.
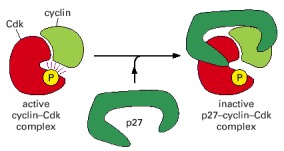
This drawing is based on the three-dimensional structure of the human cyclin A-Cdk2 complex bound to the CKI p27, as determined by x-ray crystallography. The p27 binds to both the cyclin and Cdk in the complex, distorting the active site of the Cdk. It also inserts into the ATP-binding site, further inhibiting the enzyme activity.
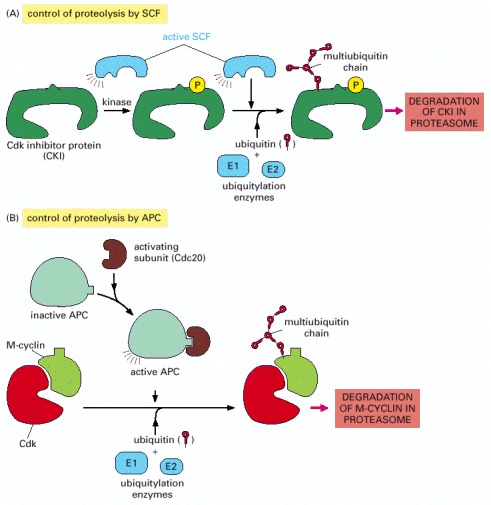
(A) The phosphorylation of a target protein, such as the CKI shown, allows the protein to be recognized by SCF, which is constitutively active. With the help of two additional proteins called E1 and E2, SCF serves as a ubiquitin ligase that transfers multiple ubiquitin molecules onto the CKI protein. The ubiquitylated CKI protein is then immediately recognized and degraded in a proteasome. (B) M-cyclin ubiquitylation is performed by APC, which is activated in late mitosis by the addition of an activating subunit to the complex. Both SCF and APC contain binding sites that recognize specific amino acid sequences of the target protein.
Chapter 17.3 - Figures
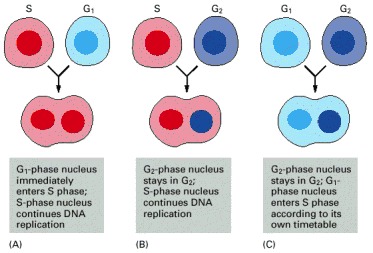
These experiments were carried out in 1970 in cultured mammalian cells. (A) The results show that S-phase cytoplasm contains factors that drive a G1 nucleus directly into DNA synthesis. (B) A G2 nucleus, having already replicated its DNA, is refractory to these factors. (C) Fusion of a G2 cell with a G1 cell does not drive the G1 nucleus into DNA synthesis, indicating that the cytoplasmic factors for DNA replication that were present in the S-phase cell disappear when the cell moves from S phase into G2. (Adapted from R.T. Johnson and P.N. Rao, Nature 226:717–722, 1970.)
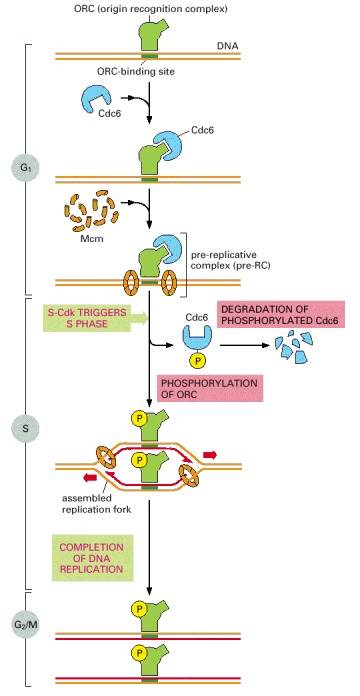
The ORC remains associated with a replication origin throughout the cell cycle. In early G1, Cdc6 associates with ORC. Aided by Cdc6, Mcm ring complexes then assemble on the adjacent DNA, resulting in the formation of the pre-replicative complex. The S-Cdk (with assistance from another protein kinase, not shown) then triggers origin firing, assembling DNA polymerase and other replication proteins and activating the Mcm protein rings to migrate along DNA strands as DNA helicases. The S-Cdk also blocks rereplication by causing the dissociation of Cdc6 from origins, its degradation, and the export of all excess Mcm out of the nucleus. Cdc6 and Mcm cannot return to reset an ORC-containing origin for another round of DNA replication until M-Cdk has been inactivated at the end of mitosis (see text).
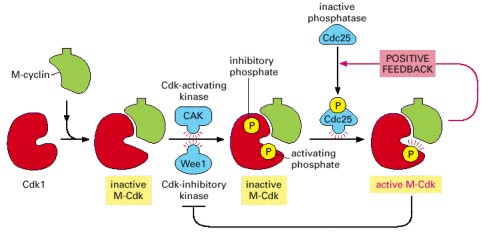
Cdk1 associates with M-cyclin as the levels of M-cyclin gradually rise. The resulting M-Cdk complex is phosphorylated on an activating site by the Cdk-activating kinase (CAK) and on a pair of inhibitory sites by the Wee1 kinase. The resulting inactive M-Cdk complex is then activated at the end of G2 by the phosphatase Cdc25. Cdc25 is stimulated in part by Polo kinase, which is not shown for simplicity. Cdc25 is further stimulated by active M-Cdk, resulting in positive feedback. This feedback is enhanced by the ability of M-Cdk to inhibit WeeI.
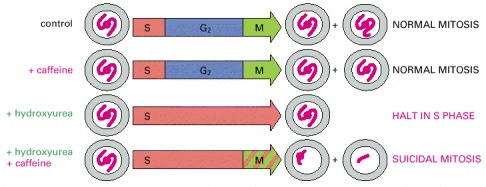
In the experiments diagrammed here, mammalian cells in culture were treated with caffeine and hydroxyurea, either alone or in combination. Hydroxyurea blocks DNA synthesis. This block activates a checkpoint mechanism that arrests the cells in S phase, delaying mitosis. But if caffeine is added as well as hydroxyurea, the checkpoint mechanism fails, and the cells proceed into mitosis according to their normal schedule, with incompletely replicated DNA. As a result, the cells die.
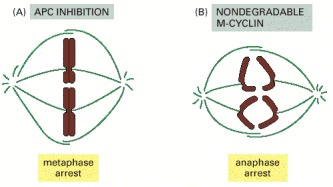
(A) An APC inhibitor was added to frog egg extracts undergoing mitosis in vitro (see Figure 17-9). The inhibitor arrested mitosis at metaphase, indicating that proteolysis is required for the separation of sister chromatids at the metaphase-to-anaphase transition. A similar arrest occurs in budding yeasts with mutations in components of the APC. (B) A nondegradable mutant form of M-cyclin was added to mitotic frog egg extracts. This addition arrested mitosis after sister-chromatid separation, indicating that destruction of M-cyclin is not required for sister-chromatid separation but is required for the subsequent exit from mitosis. (Based on S.L. Holloway et al., Cell 73:1393–1402, 1993.)
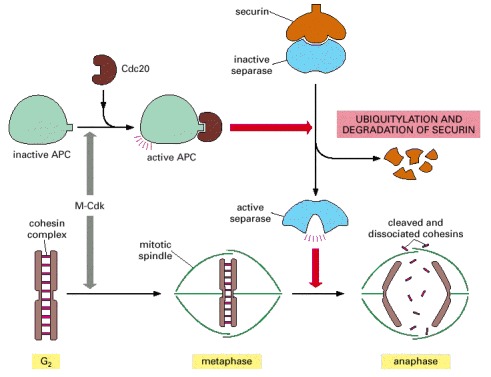
The activation of APC by Cdc20 leads to the ubiquitylation and destruction of securin, which normally holds separase in an inactive state. The destruction of securin allows separase to cleave a subunit of the cohesin complex holding the sister chromatids together. The pulling forces of the mitotic spindle then pull the sister chromatids apart. In budding yeasts at least, cohesin cleavage by separase is facilitated by the phosphorylation of the cohesin complex adjacent to the cleavage site, just before anaphase begins. The phosphorylation is mediated by Polo kinase and provides an additional control on the timing of the metaphase-to-anaphase transition.
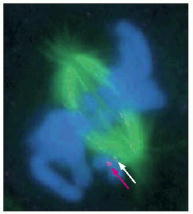
This fluorescence micrograph shows a mammalian cell in prometaphase, with the mitotic spindle in green and the sister chromatids in blue. One sister chromatid pair is not yet attached to the spindle. The presence of Mad2 on the kinetochore of the unattached chromosome is revealed by the binding of anti-Mad2 antibodies (red dot, indicated by red arrow). Another chromosome has just attached to the spindle, and its kinetochore has a low level of Mad2 still associated with it (pale dot, indicated by white arrow). (From J.C. Waters et al., J. Cell Biol. 141:1181–1191, 1998. © The Rockefeller University Press.)
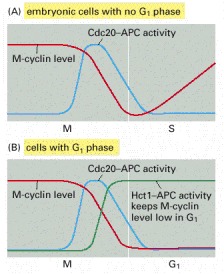
(A) In early embryonic cell cycles, Cdc20-APC activity rises at the end of metaphase, triggering M-cyclin destruction. Because M-Cdk activity stimulates Cdc20-APC activity, the loss of M-cyclin leads to APC inactivation after mitosis, which allows M-cyclins to begin accumulating again. (B) In cells containing a G1 phase, the drop in M-Cdk activity in late mitosis leads to the activation of Hct1-APC (as well as to the accumulation of CKI proteins, not shown). This ensures a continued suppression of Cdk activity after mitosis, as required for a G1 phase.
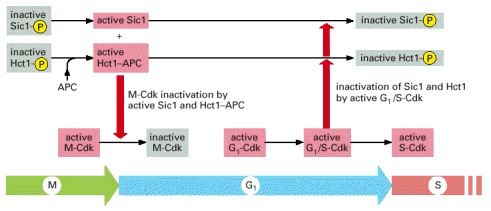
As cells exit from mitosis and inactivate M-Cdk, the resulting increase in Hct1 and Sic1 activities results in stable Cdk inactivation during G1. When conditions are right for entering a new cell cycle, the increase in G1-Cdk and G1/S-Cdk activities leads to the inhibition of Sic1 and Hct1 by phosphorylation, allowing S-Cdk activity to increase.
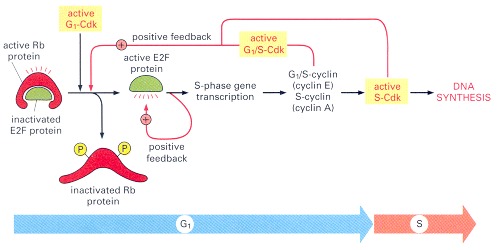
G1-Cdk activity (cyclin D-Cdk4) initiates Rb phosphorylation. This inactivates Rb, freeing E2F to activate the transcription of S-phase genes, including the genes for a G1/S-cyclin (cyclin E) and S-cyclin (cyclin A). The resulting appearance of G1/S-Cdk and S-Cdk activities further enhances Rb phosphorylation, forming a positive feedback loop. E2F acts back to stimulate the transcription of its own gene, forming another positive feedback loop.
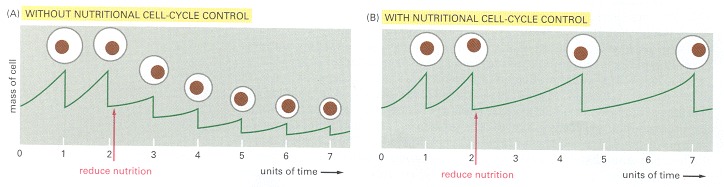
These graphs show the relationship between growth rate, cell size, and cell cycle time. (A) If cell division continued at an unchanged rate when cells were starved and stopped growing, the daughter cells produced at each division would become progressively smaller. (B) Yeast cells respond to some forms of nutritional deprivation by slowing the rate of progress through the cell cycle so that the cells have more time to grow. As a result, cell size remains unchanged or is reduced slightly. (A unit of time is the cycle time observed when nutrients are in excess.)
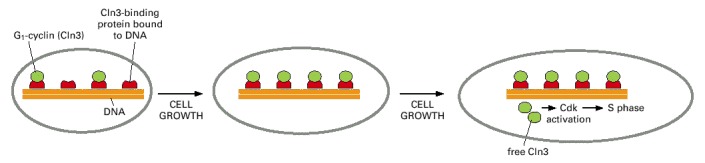
The cell contains a fixed number of proteins (red) that are bound to DNA and bind and inhibit Cln3 molecules (green). As the cell grows, the total number of Cln3 molecules increases in parallel with total cell protein. When the cell is small (left), all of the Cln3 is inactivated by the excess of Cln3-binding protein. As the cell grows, however, it reaches a threshold size at which the number of Cln3 molecules equals the number of Cln3-binding proteins (middle). When the cell exceeds this size, free Cln3 can bind to Cdk, which can now trigger the next cell cycle (right).
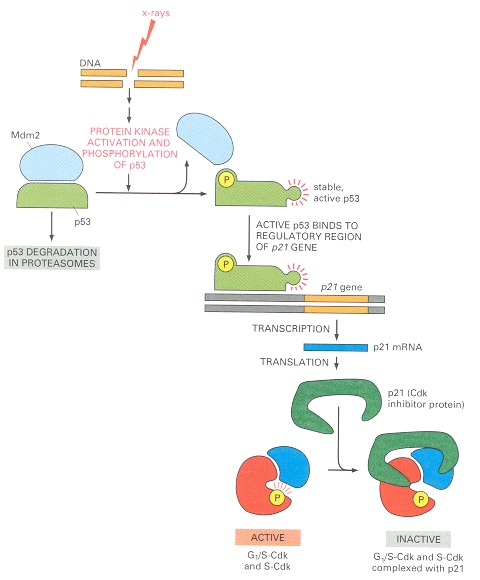
When DNA is damaged, protein kinases that phosphorylate p53 are activated. Mdm2 normally binds to p53 and promotes its ubiquitylation and destruction in proteasomes. Phosphorylation of p53 blocks its binding to Mdm2; as a result, p53 accumulates to high levels and stimulates transcription of the gene that encodes the CKI protein p21. The p21 binds and inactivates G1/S-Cdk and S-Cdk complexes, arresting the cell in G1. In some cases, DNA damage also induces either the phosphorylation of Mdm2 or a decrease in Mdm2 production, which causes an increase in p53 (not shown).
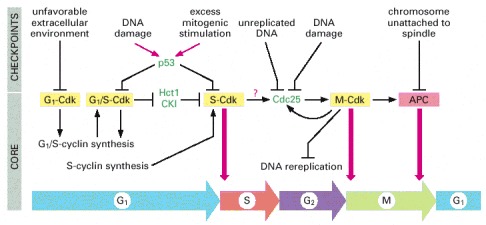
The core of the cell-cycle control system consists of a series of cyclin-Cdk complexes (yellow). The activity of each complex is also influenced by various inhibitory checkpoint mechanisms, which provide information about the extracellular environment, cell damage, and incomplete cell-cycle events (top). These mechanisms are not present in all cell types; many are missing in early embryonic cell cycles, for example.
Chapter 17.4 - Figures
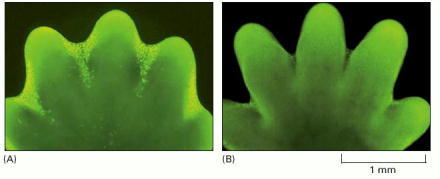
(A) The paw in this mouse embryo has been stained with a dye that specifically labels cells that have undergone apoptosis. The apoptotic cells appear as bright green dots between the developing digits. (B) This interdigital cell death eliminates the tissue between the developing digits, as seen one day later, when few, if any, apoptotic cells can be seen. (From W. Wood et al., Development 127:5245–5252, 2000. © The Company of Biologists.)
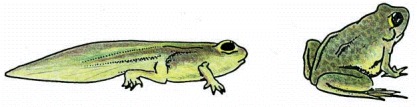
As a tadpole changes into a frog, the cells in the tadpole tail are induced to undergo apoptosis; as a consequence, the tail is lost. All the changes that occur during metamorphosis, including the induction of apoptosis in the tail, are stimulated by an increase in thyroid hormone in the blood.
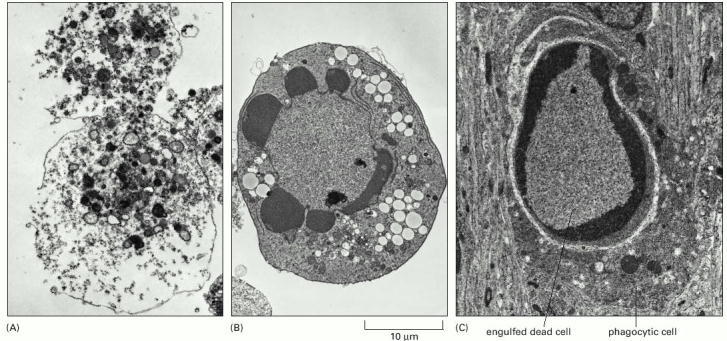
These electron micrographs show cells that have died by (A) necrosis or (B and C) apoptosis. The cells in (A) and (B) died in a culture dish, whereas the cell in (C) died in a developing tissue and has been engulfed by a neighboring cell. Note that the cell in (A) seems to have exploded, whereas those in (B) and (C) have condensed but seem relatively intact. The large vacuoles visible in the cytoplasm of the cell in (B) are a variable feature of apoptosis. (Courtesy of Julia Burne.)
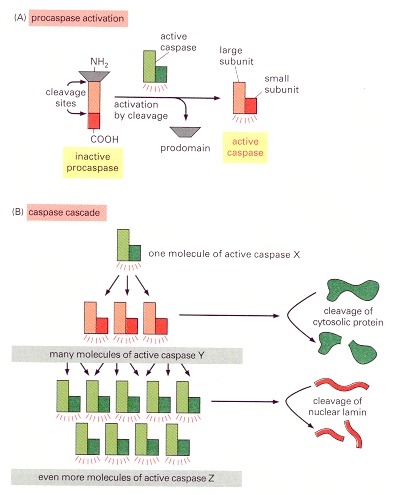
(A) Each suicide protease is made as an inactive proenzyme (procaspase), which is usually activated by proteolytic cleavage by another member of the caspase family. As indicated, two of the cleaved fragments associate to form the active site of the caspase. The active enzyme is thought to be a tetramer of two of these units (not shown). (B) Each activated caspase molecule can cleave many procaspase molecules, thereby activating them, and these can then activate even more procaspase molecules. In this way, an initial activation of a small number of procaspase molecules (called initiator caspases) can lead, via an amplifying chain reaction (a cascade), to the explosive activation of a large number of procaspase molecules. Some of the activated caspases (called effector caspases) then cleave a number of key proteins in the cell, including specific cytosolic proteins and nuclear lamins, leading to the controlled death of the cell.
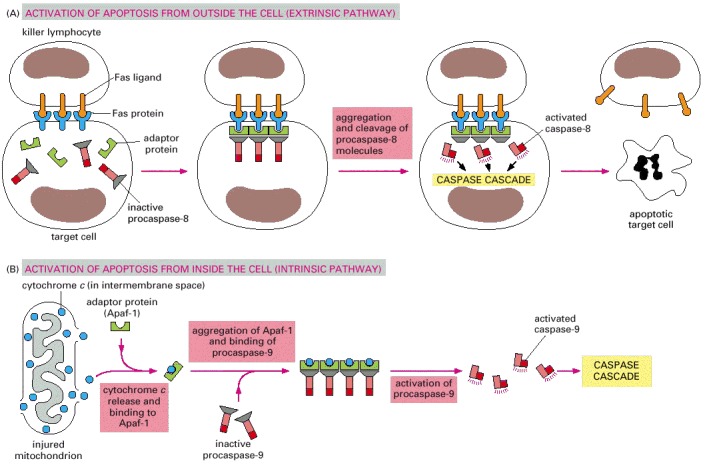
(A) Extracellular activation. A killer lymphocyte carrying the Fas ligand binds and activates Fas proteins on the surface of the target cell. Adaptor proteins bind to the intracellular region of aggregated Fas proteins, causing the aggregation of procaspase-8 molecules. These then cleave one another to initiate the caspase cascade. (B) Intracellular activation. Mitochondria release cytochrome c, which binds to and causes the aggregation of the adaptor protein Apaf-1. Apaf-1 binds and aggregates procaspase-9 molecules, which leads to the cleavage of these molecules and the triggering of a caspase cascade. Other proteins that contribute to apoptosis are also released from the mitochondrial intermembrane space (not shown).
Chapter 17.5 - Figures
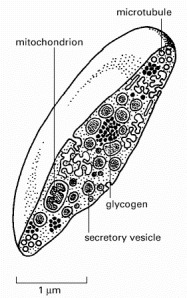
Platelets are miniature cells without a nucleus. They circulate in the blood and help stimulate blood clotting at sites of tissue damage, thereby preventing excessive bleeding. They also release various factors that stimulate healing. The platelet shown here has been cut in half to show its secretory vesicles, some of which contain platelet-derived growth factor (PDGF). See also Figure 16-47B-D.
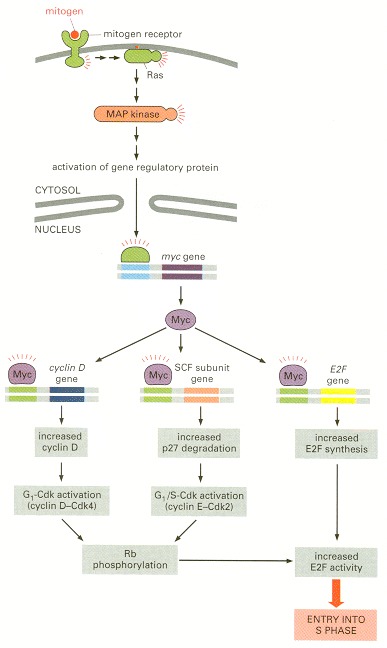
The binding of mitogens to cell-surface receptors leads to the activation of Ras and a MAP kinase cascade. One effect of this pathway is the increased production of the gene regulatory protein Myc. Myc increases the transcription of several genes, including the gene encoding cyclin D and a gene encoding a subunit of the SCF ubiquitin ligase. The resulting increase in G1-Cdk and G1/S-Cdk activities promotes Rb phosphorylation and activation of the gene regulatory protein E2F, resulting in S-phase entry (see Figure 17-30). Myc may also promote E2F activity directly by stimulating the transcription of the E2F gene. Although, for simplicity, Myc is shown as a monomer, it functions as a heterodimer with another protein called Max.
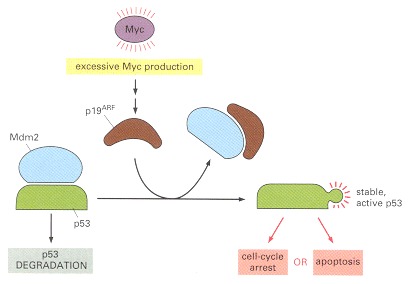
Abnormally high levels of Myc cause the activation of p19ARF, which binds and inhibits Mdm2 and thereby causes increased p53 levels (see Figure 17-33). Depending on the cell type and extracellular conditions, p53 then causes either cell-cycle arrest or apoptosis.
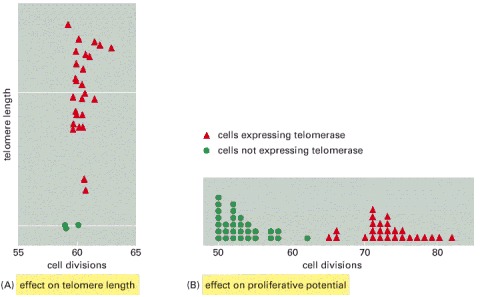
(A) Normal human fibroblasts do not contain telomerase, and so their telomeres gradually shorten and lose their normal cap structure as the cells proliferate. Cells forced to express telomerase, however, maintain telomere length (and normal cap structures) after many divisions. (B) The normal human fibroblasts stopped dividing after about 50–60 divisions in these experiments, whereas the cells expressing telomerase were still dividing at the end of the experiment. (Based on A. Bodnar et al., Science 279:349–352, 1998.)
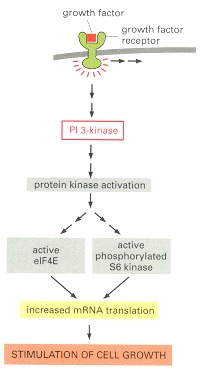
In this simplified scheme, activation of cell-surface receptors leads to the activation of PI 3-kinase, which promotes protein synthesis, at least partly through the activation of eIF4E and S6 kinase. Growth factors also inhibit protein breakdown (not shown) by poorly understood pathways.
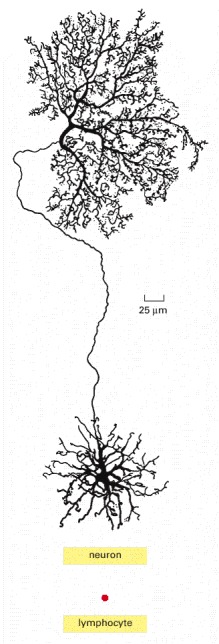
Both cells contain the same amount of DNA. A neuron grows progressively larger after it has permanently withdrawn from the cell cycle. During this time, the ratio of cytoplasm to DNA increases enormously (by a factor of more than 105 for some neurons). (Neuron from B.B. Boycott, in Essays on the Nervous System [R. Bellairs and E.G. Gray, eds]. Oxford, UK: Clarendon Press, 1974.)
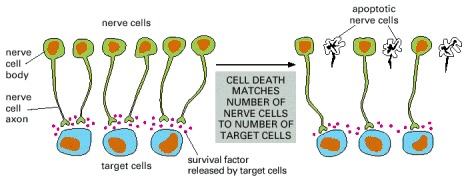
More nerve cells are produced than can be supported by the limited amount of survival factors released by the target cells. Therefore, some cells receive an insufficient amount of survival factors to keep their suicide program suppressed and, as a consequence, undergo apoptosis. This strategy of overproduction followed by culling ensures that all target cells are contacted by nerve cells and that the extra nerve cells are automatically eliminated.
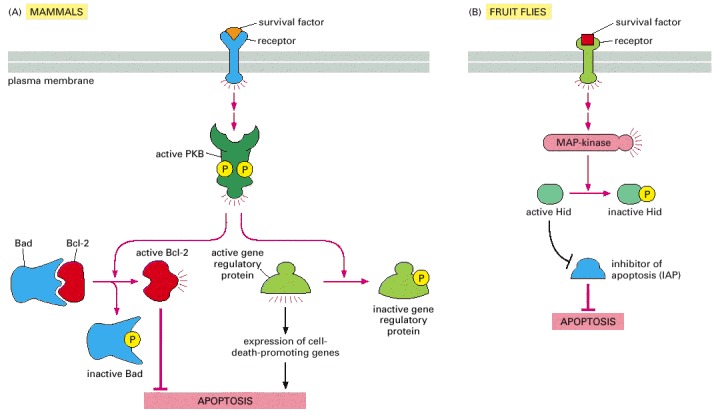
(A) In mammalian cells, the binding of some survival factors to cell-surface receptors leads to the activation of various protein kinases, including protein kinase B (PKB), that phosphorylate and inactivate the Bcl-2 family member Bad. When not phosphorylated, Bad promotes apoptosis by binding and inhibiting Bcl-2. Once phosphorylated, Bad dissociates, freeing Bcl-2 to suppress apoptosis. As indicated, PKB also suppresses death by phosphorylating and thereby inhibiting gene regulatory proteins of the Forkhead family that stimulate the transcription of genes that encode proteins that promote apoptosis. (B) In Drosophila, some survival factors inhibit apoptosis by stimulating the phosphorylation of the Hid protein. When not phosphorylated, Hid promotes cell death by inhibiting IAPs. Once phosphorylated, Hid no longer inhibits IAPs, which become active and block cell death.
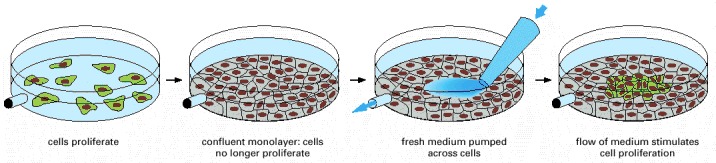
Cells in a confluent monolayer do not divide (gray). The cells resume dividing (green) when exposed directly to fresh culture medium. Apparently, in the undisturbed confluent monolayer, proliferation has halted because the medium close to the cells is depleted of mitogens, for which the cells compete.
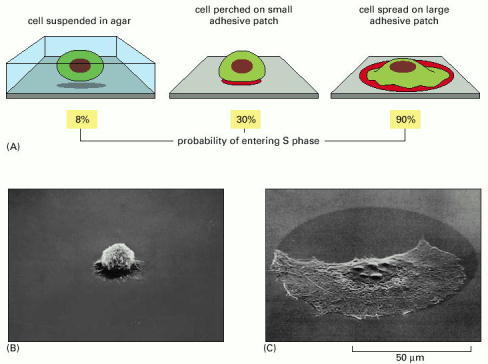
In this experiment, cells are either held in suspension or allowed to settle on patches of an adhesive material (palladium) on a nonadhesive substratum. The patch diameter, which is variable, determines the extent to which an individual cell spreads and the probability that it will progress into S phase. 3H-thymidine is added to the culture medium, and after 1 or 2 days, the culture is fixed and autoradiographed to determine the percentage of cells that have entered S phase (see Figure 17-11A). (A) Few cells of the 3T3 cell line enter S phase when held rounded up in suspension, but adherence even to a very tiny patch—one that is too small to allow spreading—enables many of them to enter S phase. (B and C) These scanning electron micrographs show a cell perched on a small patch compared with a cell spread on a large patch.
In contrast to fibroblasts and epithelial cells, some cell types in the body (including lymphocytes and blood cell precursors) can divide readily in suspension (see also Figure 19-62). (B and C, from C. O'Neill, P. Jordan, and G. Ireland, Cell 44:489–496, 1986. © Elsevier.)
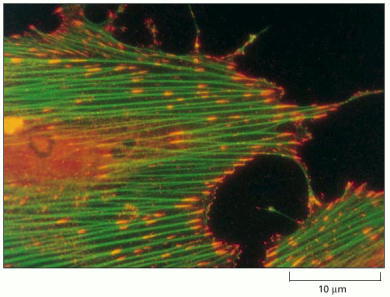
This fluorescence micrograph shows a fibroblast cultured on a substratum coated with the extracellular matrix molecule fibronectin. Actin filaments have been labeled to fluoresce green, while activated proteins that contain phosphotyrosine have been labeled with an antibody that is tagged to fluoresce red. Where the two components overlap, the resulting color is orange. The actin filaments terminate at focal adhesions, where the cell attaches to the substratum. Proteins containing phosphotyrosine are also concentrated at these sites. This is thought to reflect the local activation of focal adhesion kinase (FAK) and other protein kinases stimulated by transmembrane integrin proteins that bind to fibronectin extracellularly and (indirectly) to actin filaments intracellularly. Signals generated at such adhesion sites help regulate cell division, growth, and survival, in both fibroblasts and epithelial cells. (Courtesy of Keith Burridge.)
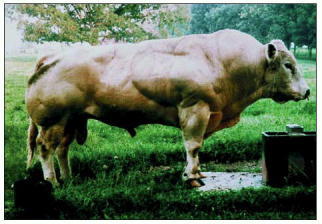
The mutation leads to a dramatic increase in the mass of muscle tissue, as illustrated in this Belgian Blue bull. The Belgium Blue was produced by cattle breeders and was only recently found to have a mutation in the myostatin gene. Mice purposely made deficient in the same gene also have remarkably big muscles (see Figure 22-43). (From A.C. McPherron and S.-J. Lee, Proc. Natl. Acad. Sci. USA 94:12457–12461, 1997. © National Academy of Sciences.)
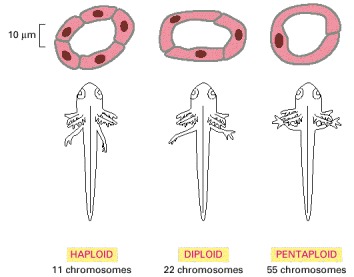
In all organisms, from bacteria to humans, cell size is proportional to ploidy. Pentaploid salamanders, for example, have cells that are much larger than those of haploid salamanders. The animals and their individual organs, however, are the same size because each tissue in the pentaploid animal contains fewer cells. This indicates that the size of an organism or organ is not controlled simply by counting cell divisions or cell numbers; total cell mass must somehow be regulated. (Adapted from G. Fankhauser, in Analysis of Development [B.H. Willier, P.A. Weiss, and V. Hamburger, eds.], pp. 126–150. Philadelphia: Saunders, 1955.)
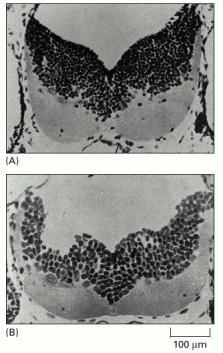
(A) This light micrograph shows a cross section of the hindbrain of a haploid salamander. (B) A corresponding cross section of the hindbrain of a tetraploid salamander, revealing how reduced cell numbers compensate for increased cell size. (From G. Fankhauser, Int. Rev. Cytol. 1:165–193, 1952.)