Chapter 1 - Figures
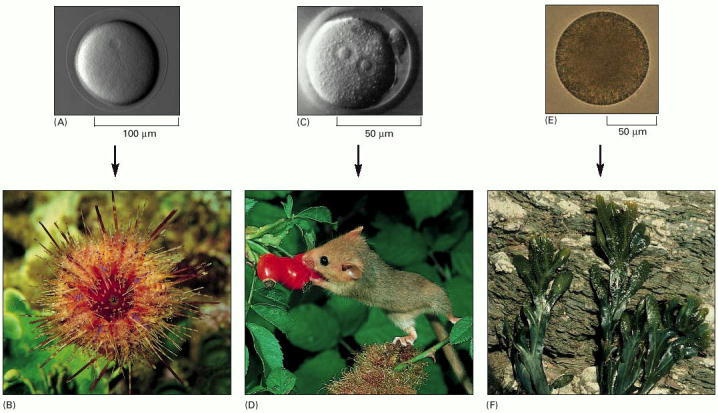
(A and B) A sea urchin egg gives rise to a sea urchin. (C and D) A mouse egg gives rise to a mouse. (E and F) An egg of the seaweed Fucus gives rise to a Fucus seaweed. (A, courtesy of David McClay; B, courtesy of M. Gibbs, Oxford Scientific Films; C, courtesy of Patricia Calarco, from G. Martin, Science 209:768–776, 1980. © AAAS; D, courtesy of O. Newman, Oxford Scientific Films; E and F, courtesy of Colin Brownlee.)
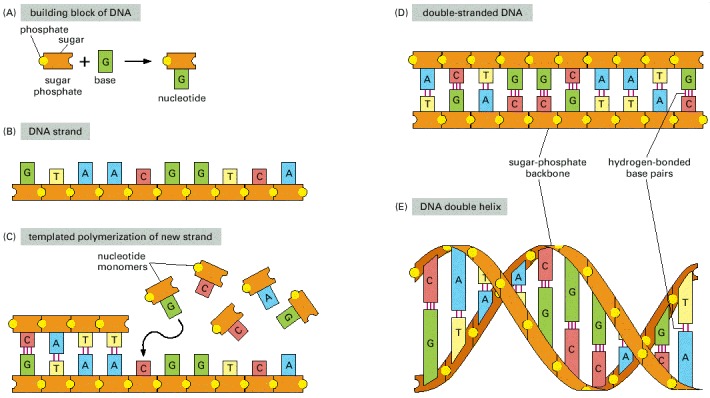
(A) DNA is made from simple subunits, called nucleotides, each consisting of a sugar-phosphate molecule with a nitrogen-containing sidegroup, or base, attached to it. The bases are of four types (adenine, guanine, cytosine, and thymine), corresponding to four distinct nucleotides, labeled A, G, C, and T. (B) A single strand of DNA consists of nucleotides joined together by sugar-phosphate linkages. Note that the individual sugar-phosphate units are asymmetric, giving the backbone of the strand a definite directionality, or polarity. This directionality guides the molecular processes by which the information in DNA is interpreted and copied in cells: the information is always “read” in a consistent order, just as written English text is read from left to right. (C) Through templated polymerization, the sequence of nucleotides in an existing DNA strand controls the sequence in which nucleotides are joined together in a new DNA strand; T in one strand pairs with A in the other, and G in one strand with C in the other. The new strand has a nucleotide sequence complementary to that of the old strand, and a backbone with opposite directionality: corresponding to the GTAA... of the original strand, it has ...TTAC. (D) A normal DNA molecule consists of two such complementary strands. The nucleotides within each strand are linked by strong (covalent) chemical bonds; the complementary nucleotides on opposite strands are held together more weakly, by hydrogen bonds. (E) The two strands twist around each other to form a double helix—a robust structure that can accommodate any sequence of nucleotides without altering its basic structure.
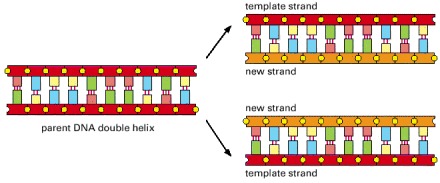
In this process, the two strands of a DNA double helix are pulled apart, and each serves as a template for synthesis of a new complementary strand.
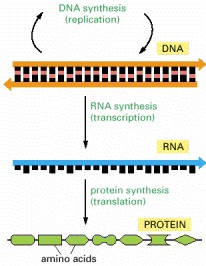
Genetic information is read out and put to use through a two-step process. First, in transcription, segments of the DNA sequence are used to guide the synthesis of molecules of RNA. Then, in translation, the RNA molecules are used to guide the synthesis of molecules of protein.
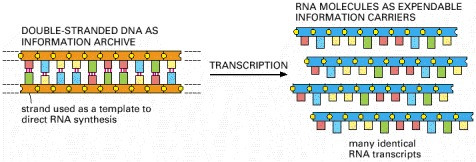
Each cell contains a fixed set of DNA molecules—its archive of genetic information. A given segment of this DNA serves to guide the synthesis of many identical RNA transcripts, which serve as working copies of the information stored in the archive. Many different sets of RNA molecules can be made by transcribing selected parts of a long DNA sequence, allowing each cell to use its information store differently.
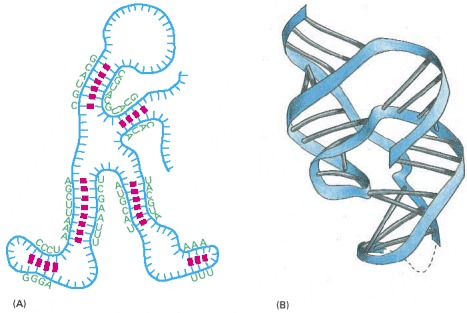
(A) Nucleotide pairing between different regions of the same RNA polymer chain causes the molecule to adopt a distinctive shape. (B) The three-dimensional structure of an actual RNA molecule, from hepatitis delta virus, that catalyzes RNA strand cleavage. (B, based on A.R. Ferré D'Amaré, K. Zhou, and J.A. Doudna, Nature 395:567–574, 1998. © Macmillan Magazines Ltd.)
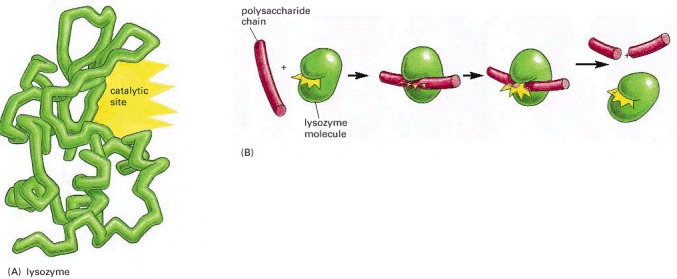
(A) In a protein molecule the polymer chain folds up to into a specific shape defined by its amino acid sequence. A groove in the surface of this particular folded molecule, the enzyme lysozyme, forms a catalytic site. (B) A polysaccharide molecule (red)—a polymer chain of sugar monomers—binds to the catalytic site of lysozyme and is broken apart, as a result of a covalent bond-breaking reaction catalyzed by the amino acids lining the groove.
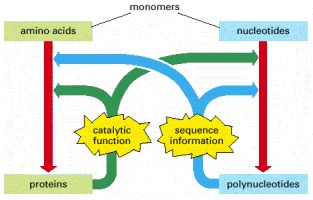
Polynucleotides (nucleotide polymers) and proteins (amino acid polymers) provide the sequence information and the catalytic functions that serve—through a complex set of chemical reactions—to bring about the synthesis of more polynucleotides and proteins of the same types.
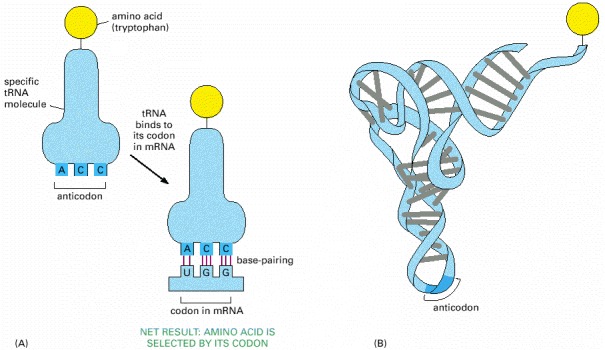
(A) A tRNA molecule specific for the amino acid tryptophan. One end of the tRNA molecule has tryptophan attached to it, while the other end displays the triplet nucleotide sequence CCA (its anticodon), which recognizes the tryptophan codon in messenger RNA molecules. (B) The three-dimensional structure of the tryptophan tRNA molecule. Note that the codon and the anticodon in (A) are in antiparallel orientations, like the two strands in a DNA double helix (see Figure 1-2), so that the sequence of the anticodon in the tRNA is read from right to left, while that of the codon in the mRNA is read from left to right.
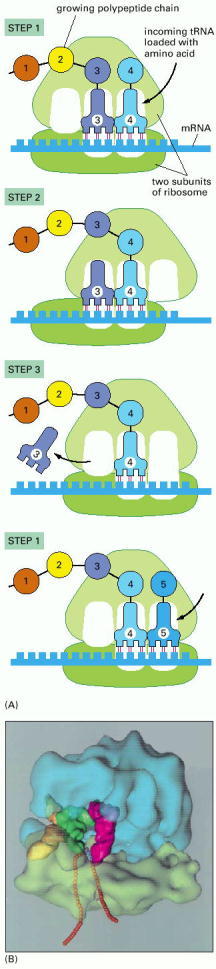
(A) The diagram shows how a ribosome moves along an mRNA molecule, capturing tRNA molecules that match the codons in the mRNA and using them to join amino acids into a protein chain. The mRNA specifies the sequence of amino acids. (B) The three-dimensional structure of a bacterial ribosome (pale green and blue), moving along an mRNA molecule (orange beads), with three tRNA molecules (yellow, green, and pink) at different stages in their process of capture and release. The ribosome is a giant assembly of more than 50 individual protein and RNA molecules. (B, courtesy of Joachim Frank, Yanhong Li, and Rajendra Agarwal.)
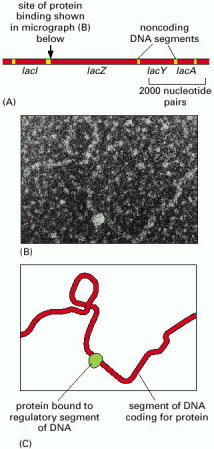
The protein-coding DNA segments (red) have regulatory and other noncoding DNA segments (yellow) between them. (B) An electron micrograph of DNA from this region, with a protein molecule (encoded by the lac1 gene) bound to the regulatory segment; this protein controls the rate of transcription of the lacZ, lacY, and lacA genes. (C) A drawing of the structures shown in (B). (B, courtesy of Jack Griffith.)
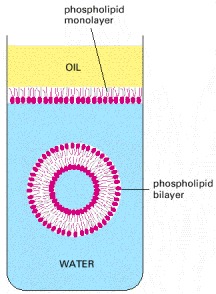
These have a hydrophilic (water-loving, phosphate) head group and a hydrophobic (water-avoiding, hydrocarbon) tail. At an interface between oil and water, they arrange themselves as a single sheet with their head groups facing the water and their tail groups facing the oil. When immersed in water, they aggregate to form bilayers enclosing aqueous compartments.
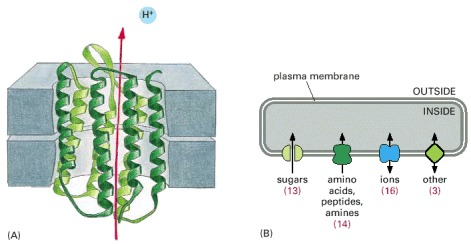
(A) Structure of a molecule of bacteriorhodopsin, from the archaean (archaebacterium) Halobacterium halobium. This transport protein uses the energy of absorbed light to pump protons (H+ ions) out of the cell. The polypeptide chain threads to and fro across the membrane; in several regions it is twisted into a helical conformation, and the helical segments are arranged to form the walls of a channel through which ions are transported. (B) Diagram of the set of transport proteins found in the membrane of the bacterium Thermotoga maritima. The numbers in parentheses refer to the number of different membrane transport proteins of each type. Most of the proteins within each class are evolutionarily related to one another and to their counterparts in other species.
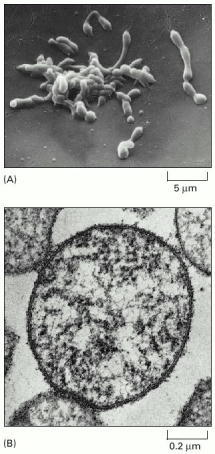
(A) Scanning electron micrograph showing the irregular shape of this small bacterium, reflecting the lack of any rigid wall. (B) Cross section (transmission electron micrograph) of a Mycoplasma cell. Of the 477 genes of Mycoplasma genitalium, 37 code for transfer, ribosomal, and other nonmessenger RNAs. Functions are known, or can be guessed, for 297 of the genes coding for protein: of these, 153 are involved in DNA replication, transcription, and translation and related processes involving DNA, RNA, and protein; 29 in the membrane and surface structures of the cell; 33 in the transport of nutrients and other molecules across the membrane; 71 in energy conversion and the synthesis and degradation of small molecules; and 11 in the regulation of cell division and other processes. (A, from S. Razin, M. Banai, H. Gamliel, A. Pollack, W. Bredt, and I. Kahane, Infect. Immun. 30:538–546, 1980; B, courtesy of Roger Cole, in Medical Microbiology, 4th edn., [S. Baron ed.]. Galveston: University of Texas Medical Branch, 1996.)
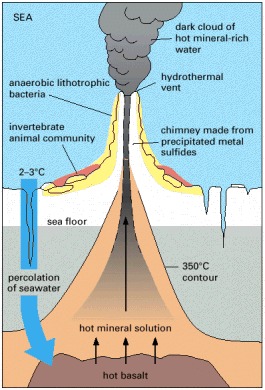
. Water percolates down toward the hot molten rock upwelling from the Earth's interior and is heated and driven back upward, carrying minerals leached from the hot rock. A temperature gradient is set up, from more than 350°C near the core of the vent, down to 2–3°C in the surrounding ocean. Minerals precipitate from the water as it cools, forming a chimney. Different classes of organisms, thriving at different temperatures, live in different neighborhoods of the chimney. A typical chimney might be a few meters tall, with a flow rate of 1–2 m/sec.
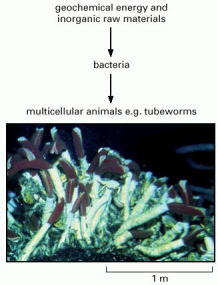
Close to the vent, at temperatures up to about 150°C, various lithotrophic species of bacteria and archaea (archaebacteria) live, directly fuelled by geochemical energy. A little further away, where the temperature is lower, various invertebrate animals live by feeding on these microorganisms. Most remarkable are the giant (2-meter) tube worms, which, rather than feed on the lithotrophic cells, live in symbiosis with them: specialized organs in the worms harbor huge numbers of symbiotic sulfur-oxidizing bacteria. These bacteria harness geochemical energy and supply nourishment to their hosts, which have no mouth, gut, or anus. The dependence of the tube worms on the bacteria for the harnessing of geothermal energy is analogous to the dependence of plants on chloroplasts for the harnessing of solar energy, discussed later in this chapter. The tube worms, however, are thought to have evolved from more conventional animals, and to have become secondarily adapted to life at hydrothermal vents. (Courtesy of Dudley Foster, Woods Hole Oceanographic Institution.)
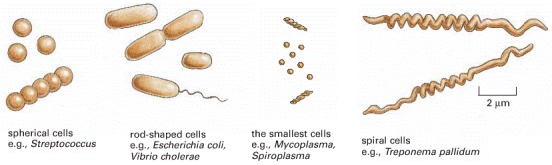
Although most are small, as shown, there are also some giant species. An extreme example (not shown) is the cigar-shaped bacterium Epulopiscium fishelsoni, which lives in the gut of the surgeon fish and can be up to 600 μm long.
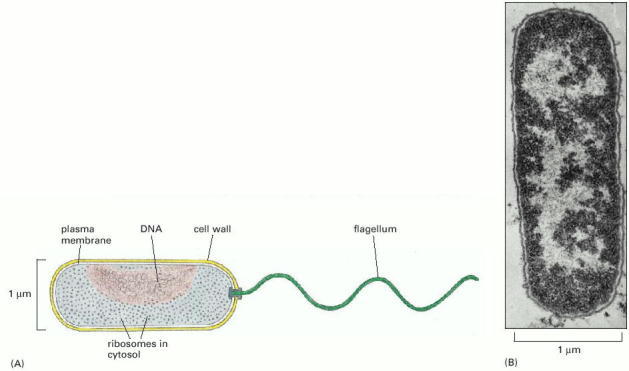
(A) The bacterium Vibrio cholerae, showing its simple internal organization. Like many other species, Vibrio has a helical appendage at one end—a flagellum—that rotates as a propeller to drive the cell forward. (B) An electron micrograph of a longitudinal section through the widely studied bacterium Escherichia coli (E. coli). This is related to Vibrio but lacks a flagellum. The cell's DNA is concentrated in the lightly stained region. (B, courtesy of E. Kellenberger.)
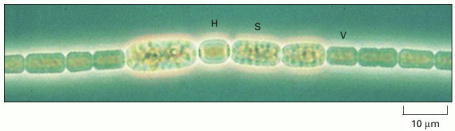
The cells of this species form long, multicellular filaments. Most of the cells (labeled V) perform photosynthesis, while others become specialized for nitrogen fixation (labeled H), or develop into resistant spores (labeled S). (Courtesy of Dave G. Adams.)
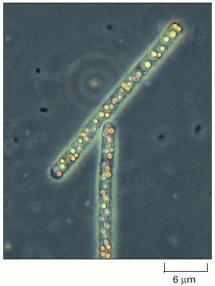
Beggiatoa, which lives in sulfurous environments, gets its energy by oxidizing H2S and can fix carbon even in the dark. Note the yellow deposits of sulfur inside the cells. (Courtesy of Ralph W. Wolfe.)
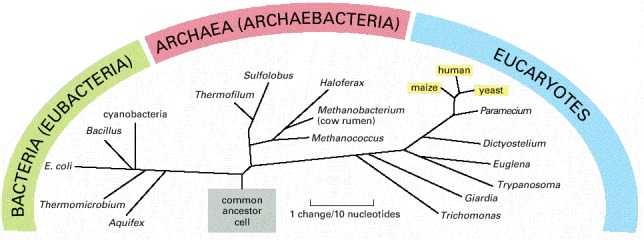
Note that traditionally the word bacteria has been used to refer to procaryotes in general, but more recently has been redefined to refer to eubacteria specifically. Where there might be ambiguity, we use the term eubacteria when the narrow meaning is intended. The tree is based on comparisons of the nucleotide sequence of a ribosomal RNA subunit in the different species. The lengths of the lines represent the numbers of evolutionary changes that have occurred in this molecule in each lineage (see Figure 1-22).

A part of the gene for the smaller of the two main RNA components of the ribosome is shown. Corresponding segments of nucleotide sequence from an archaean (Methanococcus jannaschii), a eubacterium (Escherichia coli) and a eucaryote (Homo sapiens) are aligned in parallel. Sites where the nucleotides are identical between species are indicated by a vertical line; the human sequence is repeated at the bottom of the alignment so that all three two-way comparisons can be seen. A dot halfway along the E. coli sequence denotes a site where a nucleotide has been either deleted from the eubacterial lineage in the course of evolution, or inserted in the other two lineages. Note that the sequences from these three organisms, representative of the three domains of the living world, all differ from one another to a roughly similar degree, while still retaining unmistakable similarities.
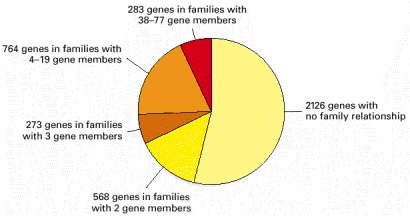
The biggest family consists of 77 genes coding for varieties of ABC transporters—a class of membrane transport proteins found in all three domains of the living world. (After F. Kunst et al., Nature 390:249–256, 1997. © Macmillan Magazines Ltd.)
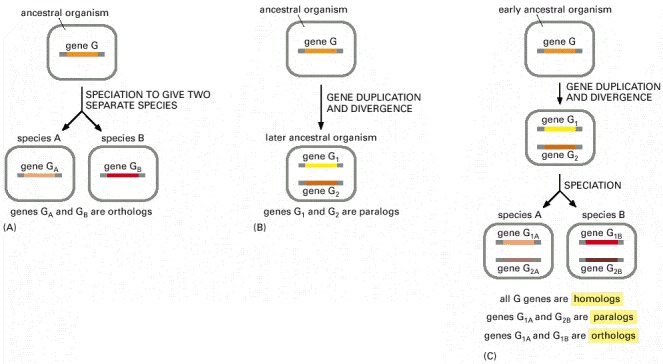
(A) and (B) The most basic possibilities. (C) A more complex pattern of events that can occur.
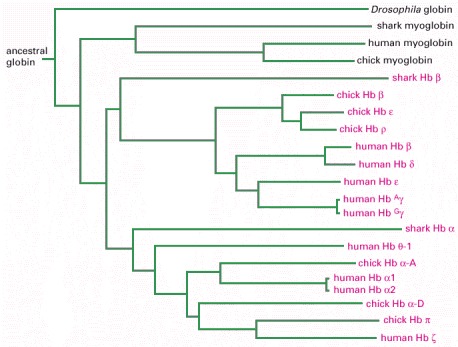
This diagram shows the pedigree of the hemoglobin (Hb), myoglobin, and globin genes of human, chick, shark, and Drosophila. The lengths of the lines represent the amount of divergence in amino acid sequence.
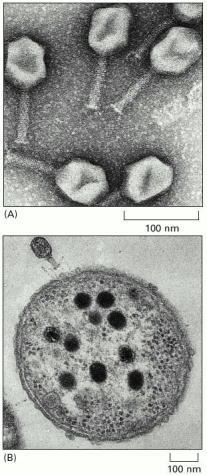
. (A) An electron micrograph of particles of a bacterial virus, the T4 bacteriophage. The head of this virus contains the viral DNA; the tail contains apparatus for injecting the DNA into a host bacterium. (B) A cross section of a bacterium with a T4 bacteriophage latched onto its surface. The large dark objects inside the bacterium are the heads of new T4 particles in course of assembly. When they are mature, the bacterium will burst open to release them. (A, courtesy of James Paulson; B, courtesy of Jonathan King and Erika Hartwig from G. Karp, Cell and Molecular Biology, 2nd edn. New York: John Wiley & Sons, 1999. © John Wiley.)
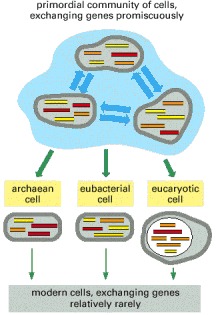
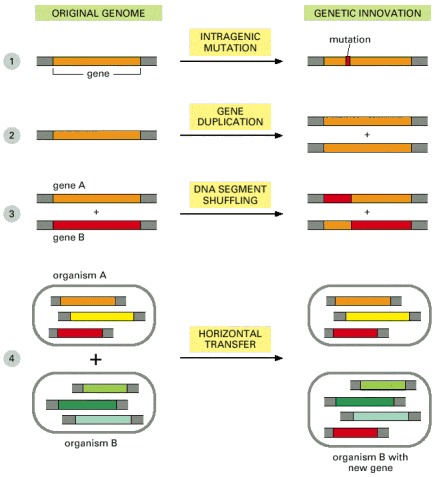
In the early days of life on Earth, cells may have been less capable of maintaining their separate identities and may have exchanged genes much more readily than now. In this way, the archaean, eubacterial, and eucaryotic lineages may have inherited different but overlapping subsets of genes from a primordial community of cells that were exchanging genes promiscuously.
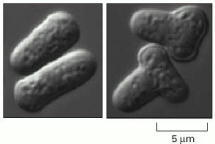
A normal yeast (of the species Schizosaccharomyces pombe) is compared with a mutant in which a change in a single gene has converted the cell from a cigar shape (left) to a T shape (right). The mutant gene therefore has a function in the control of cell shape. But how, in molecular terms, does the gene product perform that function? That is a harder question, and needs biochemical analysis to answer it. (Courtesy of Kenneth Sawin and Paul Nurse.)
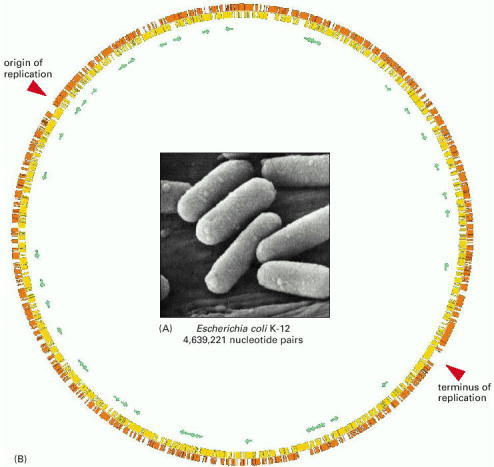
(A) A cluster of E. coli cells. (B) A diagram of the E. coli genome of 4,639,221 nucleotide pairs (for E. coli strain K-12). The diagram is circular because the DNA of E. coli, like that of other procaryotes, forms a single, closed loop. Protein-coding genes are shown as yellow or orange bars, depending on the DNA strand from which they are transcribed; genes encoding only RNA molecules are indicated by green arrows. Some genes are transcribed from one strand of the DNA double helix (in a clockwise direction in this diagram), others from the other strand (counterclockwise). (A, courtesy of Tony Brain and the Science Photo Library; B, after F. R. Blattner et al., Science 277:1453–1462, 1997. © AAAS.)
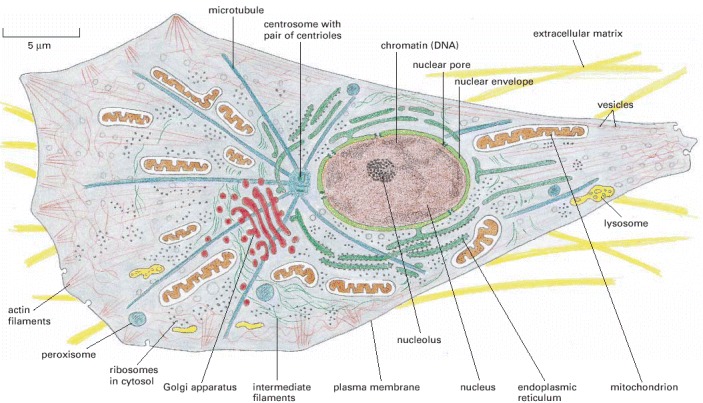
The drawing depicts a typical animal cell, but almost all the same components are found in plants and fungi and in single-celled eucaryotes such as yeasts and protozoa. Plant cells contain chloroplasts in addition to the components shown here, and their plasma membrane is surrounded by a tough external wall formed of cellulose.
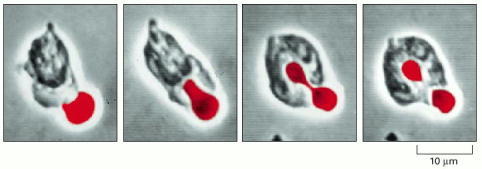
This series of stills from a movie shows a human white blood cell (a neutrophil) engulfing a red blood cell (artificially colored red) that has been treated with antibody. (Courtesy of Stephen E. Malawista and Anne de Boisfleury Chevance.)
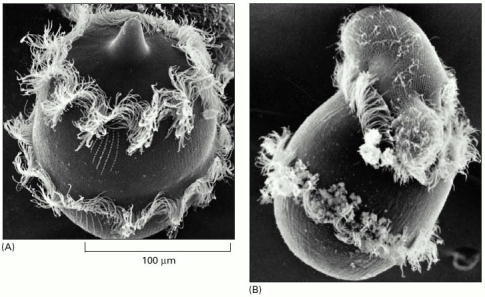
(A) Didinium is a carnivorous protozoan, belonging to the group known as ciliates. It has a globular body, about 150 μm in diameter, encircled by two fringes of cilia—sinuous, whiplike appendages that beat continually; its front end is flattened except for a single protrusion, rather like a snout. (B) Didinium normally swims around in the water at high speed by means of the synchronous beating of its cilia. When it encounters a suitable prey, usually another type of protozoan, it releases numerous small paralyzing darts from its snout region. Then, the Didinium attaches to and devours the other cell by phagocytosis, inverting like a hollow ball to engulf its victim, which is almost as large as itself. (Courtesy of D. Barlow.)
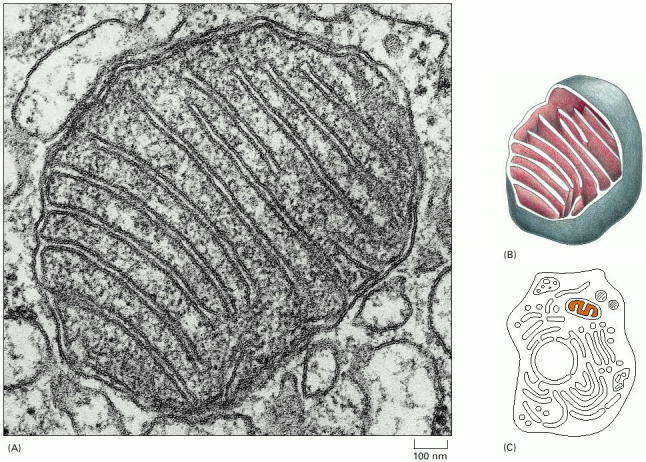
(A) A cross section, as seen in the electron microscope. (B) A drawing of a mitochondrion with part of it cut away to show the three-dimensional structure. (C) A schematic eucaryotic cell, with the interior space of a mitochondrion, containing the mitochondrial DNA and ribosomes, colored. Note the smooth outer membrane and the convoluted inner membrane, which houses the proteins that generate ATP from the oxidation of food molecules. (A, courtesy of Daniel S. Friend.)
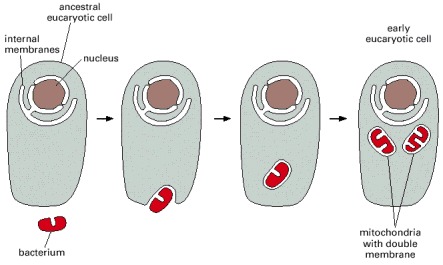
An ancestral eucaryotic cell is thought to have engulfed the bacterial ancestor of mitochondria, initiating a symbiotic relationship.
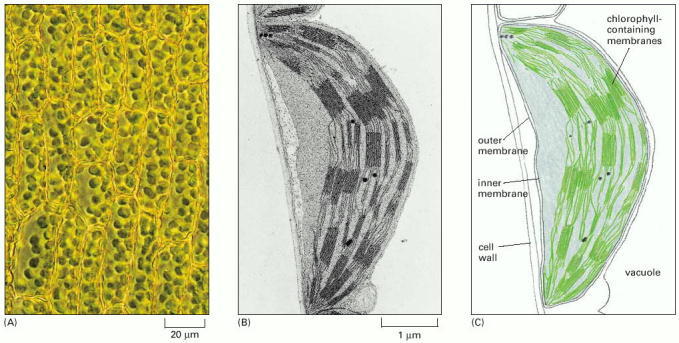
These organelles capture the energy of sunlight in plant cells and some single-celled eucaryotes. (A) Leaf cells in a moss seen in the light microscope, showing the green chloroplasts. (B) An electron micrograph of a chloroplast in a leaf of grass, showing the highly folded system of internal membranes containing the chlorophyll molecules by which light is absorbed. (C) An interpretative drawing of (B). (B, courtesy of Eldon Newcomb.)
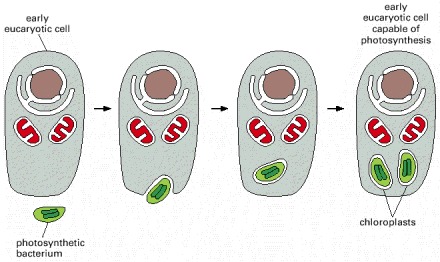
An early eucaryotic cell, already possessing mitochondria, engulfed a photosynthetic bacterium (a cyanobacterium) and retained it in symbiosis. All present-day chloroplasts are thought to trace their ancestry back to a single species of cyanobacterium that was adopted as an internal symbiont (an endosymbiont) over a billion years ago.
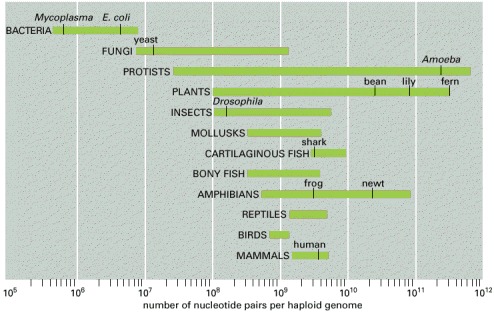
Genome size is measured in nucleotide pairs of DNA per haploid genome, that is, per single copy of the genome. (The cells of sexually reproducing organisms such as ourselves are generally diploid: they contain two copies of the genome, one inherited from the mother, the other from the father.) Closely related organisms can vary widely in the quantity of DNA in their genomes, even though they contain similar numbers of functionally distinct genes. (Data from W.-H. Li, Molecular Evolution, pp. 380–383. Sunderland, MA: Sinauer, 1997.)
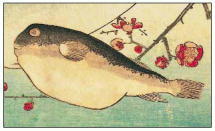
This organism has a genome size of 400 million nucleotide pairs—about one-quarter as much as a zebrafish, for example, even though the two species of fish have similar numbers of genes. (From a woodcut by Hiroshige, courtesy of Arts and Designs of Japan.)
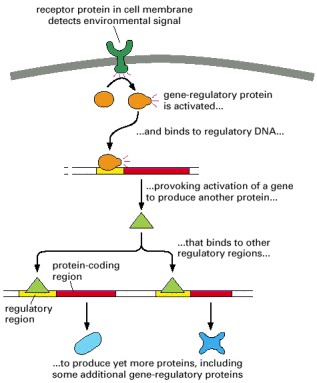
Regulatory DNA allows gene expression to be controlled by regulatory proteins, which are in turn the products of other genes. This diagram shows how a cell's gene expression is adjusted according to a signal from the cell's environment. The initial effect of the signal is to activate a regulatory protein already present in the cell; the signal may, for example, trigger the attachment of a phosphate group to the regulatory protein, altering its chemical properties.
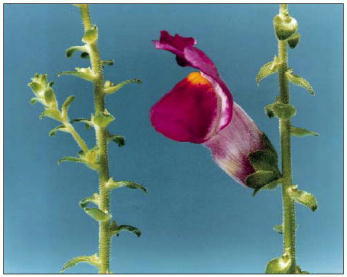
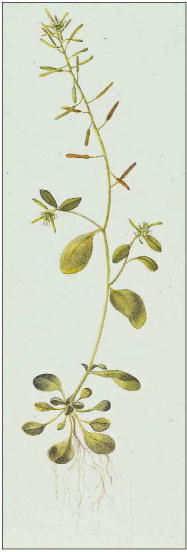
The role of a regulatory gene is demonstrated in the snapdragon Antirrhinum. In this example, a mutation in a single gene coding for a regulatory protein causes leafy shoots to develop in place of flowers: because a regulatory protein has been changed, the cells adopt characters that would be appropriate to a different location in the normal plant. The mutant is on the left, the normal plant on the right. (Courtesy of Enrico Coen and Rosemary Carpenter.)
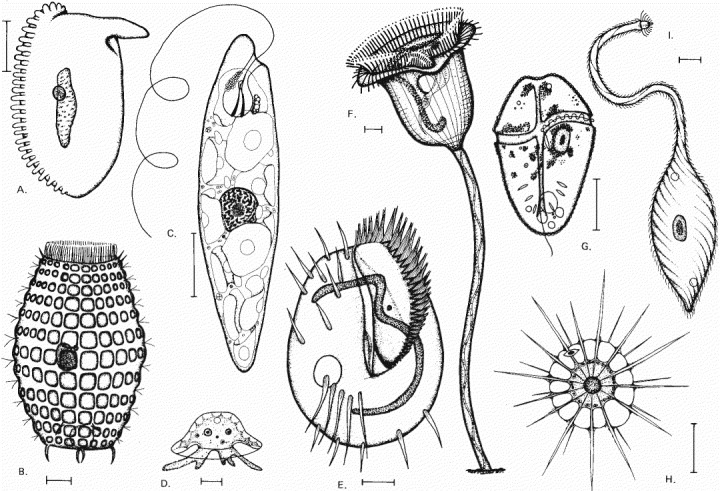
The drawings are done to different scales, but in each case the scale bar represents 10 μm. The organisms in (A), (B), (E), (F), and (I) are ciliates; (C) is a euglenoid; (D) is an amoeba; (G) is a dinoflagellate; (H) is a heliozoan. (From M.A. Sleigh, Biology of Protozoa. Cambridge, UK: Cambridge University Press, 1973.)
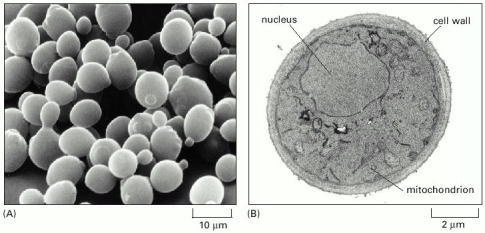
(A) A scanning electron micrograph of a cluster of the cells. This species is also known as budding yeast; it proliferates by forming a protrusion or bud that enlarges and then separates from the rest of the original cell. Many cells with buds are visible in this micrograph. (B) A transmission electron micrograph of a cross section of a yeast cell, showing its nucleus, mitochondrion, and thick cell wall. (A, courtesy of Ira Herskowitz and Eric Schabatach.)
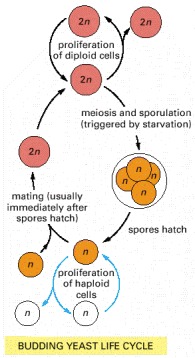
Depending on environmental conditions and on details of the genotype, cells of this species can exist in either a diploid state, with a double chromosome set, or a haploid state, with a single chromosome set. The diploid form can either proliferate by ordinary cell-division cycles or undergo meiosis to produce haploid cells. The haploid form can either proliferate by ordinary cell-division cycles or undergo sexual fusion with another haploid cell to become diploid. Meiosis is triggered by starvation and gives rise to spores—haploid cells in a dormant state, resistant to harsh environmental conditions.
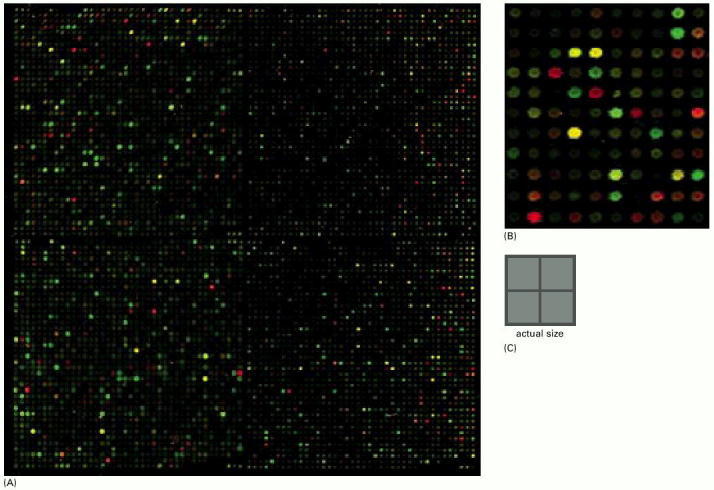
Samples of DNA sequence corresponding to each of the ~6300 protein-coding genes in the yeast genome are deposited in a square array on a glass microscope slide: (A) shows the entire array of 6400 spots; (B) shows a small region at higher magnification; (C) shows the actual size of array (A). The array has been used here to compare the sets of mRNA molecules produced by yeast cells with and without glucose in their culture medium. If the cells supplied with glucose transcribe a particular gene into mRNA, a preparation of mRNA from these cells will contain molecules that can bind selectively to the corresponding DNA spot in the array. In practice, the mRNA extracted from the cells is not applied directly to the array but is used (as we explain in Chapter 8) to generate another mixture of nucleic acid molecules, called cDNA molecules, that correspond in sequence to the mRNA molecules. In this experiment, they are tagged with a chemical label that fluoresces green. When the cDNA mixture is applied to the array, each cDNA in the mixture binds to its corresponding spot in the array: a bright green fluorescence at a given spot indicates strong expression of a specific gene. The whole procedure is now repeated with yeast cells deprived of glucose, tagging their cDNAs with a red fluorescent label and applying it to the same DNA array. Therefore, a green spot indicates a gene expressed more strongly in the presence of glucose than in its absence; a red spot indicates the opposite. Spots in the array corresponding to genes that are expressed equally in the two conditions bind both green and red cDNA molecules equally and therefore glow yellow. (From J.L. DeRisi et al., Science 278:680–686, 1997. © AAAS.)
(Courtesy of Toni Hayden and the John Innes Foundation.)
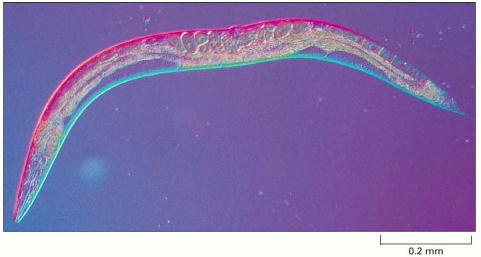
This small nematode, about 1 mm long, lives in the soil. Most individuals are hermaphrodites, producing both eggs and sperm. (Courtesy of Ian Hope.)
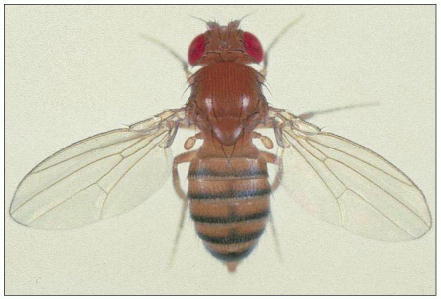
Molecular genetic studies on this fly have provided the main key to understanding how all animals develop from a fertilized egg into an adult. (From E.B. Lewis, Science 221:cover, 1983. © AAAS.)
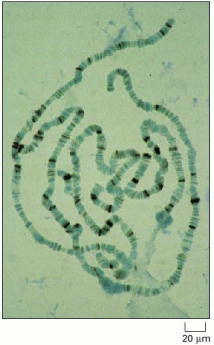
Because many rounds of DNA replication have occurred without an intervening cell division, each of the chromosomes in these unusual cells contains over a 1000 identical DNA molecules, all aligned in register. This makes them easy to see in the light microscope, where they display a characteristic and reproducible banding pattern. Specific bands can be identified as the locations of specific genes: a mutant fly with a region of the banding pattern missing shows a phenotype reflecting loss of the genes in that region. Genes that are being transcribed at a high rate correspond to bands with a “puffed” appearance. The bands stained dark brown in the micrograph are sites where a particular regulatory protein is bound to the DNA. (Courtesy of B. Zink and R. Paro, from R. Paro, Trends Genet. 6:416–421, 1990. © Elsevier.)
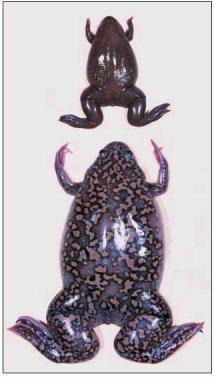
X. tropicalis, above, has an ordinary diploid genome; X. laevis, below, has twice as much DNA per cell. From the banding patterns of their chromosomes and the arrangement of genes along them, as well as from comparisons of gene sequences, it is clear that the high-ploidy species have evolved through duplications of the whole genome. These duplications are thought to have occurred in the aftermath of matings between frogs of slightly divergent Xenopus species. (Courtesy of E. Amaya, M. Offield, and R. Grainger, Trends Gen. 14:253–255, 1998. © Elsevier.)
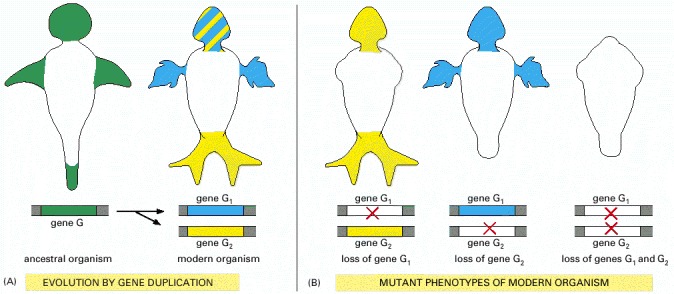
In this hypothetical example, an ancestral multicellular organism has a genome containing a single copy of gene G, which performs its function at several sites in the body, indicated in green. (A) Through gene duplication, a modern descendant of the ancestral organism has two copies of gene G, called G1 and G2. These have diverged somewhat in their patterns of expression and in their activities at the sites where they are expressed, but they still retain important similarities. At some sites, they are expressed together, and each independently performs the same old function as the ancestral gene G (alternating green and yellow stripes); at other sites, they are expressed alone and serve new purposes. (B) Because of a functional overlap, the loss of one of the two genes by mutation (red cross) reveals only a part of its role; only the loss of both genes in the double mutant reveals the full range of processes for which these genes are responsible. Analogous principles apply to duplicated genes that operate in the same place (for example, in a single-celled organism) but are called into action together or individually in response to varying circumstances. Thus, gene duplications complicate genetic analyses in all organisms.
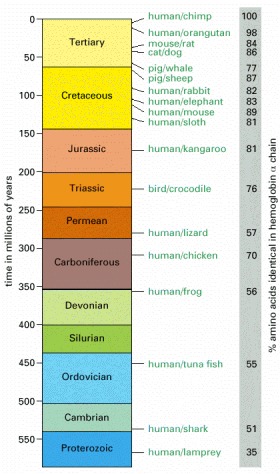
The scale on the left shows the estimated date and geological era of the last common ancestor of each specified pair of animals. Each time estimate is based on comparisons of the amino acid sequences of orthologous proteins; the longer a pair of animals have had to evolve independently, the smaller the percentage of amino acids that remain identical. Data from many different classes of proteins have been averaged to arrive at the final estimates, and the time scale has been calibrated to match the fossil evidence that the last common ancestor of mammals and birds lived 310 million years ago. The figures on the right give data on sequence divergence for one particular protein (chosen arbitrarily)—the α chain of hemoglobin. Note that although there is a clear general trend of increasing divergence with increasing time for this protein, there are also some irregularities. These reflect the randomness of the evolutionary process and, probably, the action of natural selection driving especially rapid changes of hemoglobin sequence in some organisms that experienced special physiological demands. On average, within any particular evolutionary lineage, hemoglobins accumulate changes at a rate of about 6 altered amino acids per 100 amino acids every 100 million years. Some proteins, subject to stricter functional constraints, evolve much more slowly than this, others as much as 5 times faster. All this gives rise to substantial uncertainties in estimates of divergence times, and some experts believe that the major groups of mammals diverged from one another as much as 60 million years more recently than shown here. (Adapted from S. Kumar and S.B. Hedges, Nature 392:917–920, 1998.)
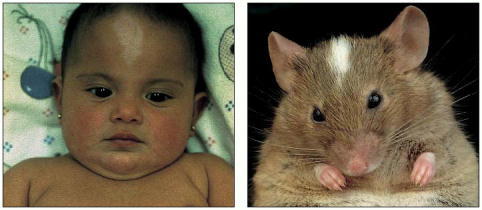
The human baby and the mouse shown here have similar white patches on their foreheads because both have mutations in the same gene (called kit), required for the development and maintenance of pigment cells. (From R.A. Fleischman, Proc. Natl. Acad. Sci. USA 88:10885–10889, 1991. © National Academy of Sciences.)